-
Paper Information
- Previous Paper
- Paper Submission
-
Journal Information
- About This Journal
- Editorial Board
- Current Issue
- Archive
- Author Guidelines
- Contact Us
American Journal of Linguistics
2012; 1(3): 63-69
doi: 10.5923/j.linguistics.20120103.06
The Socio-Economic Significance of Four Phonetic Characteristics in North American English
 Abstract
 Reference
 Full-Text PDF
 Full-Text HTML
Germán Coloma
CEMA University, Av. Cordoba 374, Buenos Aires, C1054AAP, Argentina
Correspondence to: Germán Coloma , CEMA University, Av. Cordoba 374, Buenos Aires, C1054AAP, Argentina.
| Email: |  |
Copyright © 2012 Scientific & Academic Publishing. All Rights Reserved.
This paper uses a least-square regression method that relates per-capita income to four phonetic characteristics (r-dropping, and the so-called “father-bother”, “cot-caught” and “pin-pen” mergers), to study the socio-economic significance of those characteristics in North American English. As a result we find a positive and statistically significant relationship between per-capita income and r-dropping, and between per-capita income and the presence of the “cot-caught” merger, and a negative and statistically significant relationship between per-capita income and the “pin-pen” merger. No statistically significant relationship is found, however, between per-capita income and the presence of a “father-bother” merger or split.
Keywords: Statistical Regression, Phonetic Characteristics, Per-Capita Income, North American English
Cite this paper: Germán Coloma , "The Socio-Economic Significance of Four Phonetic Characteristics in North American English", American Journal of Linguistics, Vol. 1 No. 3, 2012, pp. 63-69. doi: 10.5923/j.linguistics.20120103.06.
Article Outline
1. Introduction
- In previous work[6], we proposed a method, drawn from the field of economic statistics (also known as “econometrics”), to detect the socio-economic significance of linguistic variables. In this paper we apply essentially the same methodology to analyze the socio-economic significance of four phonetic characteristics that are useful to define different geographic areas in North American English. The method consists of running a least-square regression whose dependent variable is per-capita income, and whose independent variables are categorical variables that capture the presence or absence of certain linguistic characteristics.Since the pioneering work by Labov[8] about the social stratification of the English language in New York City, the relationship between linguistic variables and social classes has been a standard issue in empirical sociolinguistics. The way in which sociolinguistics defines the concept of social class, however, has traditionally relied on a somewhat subjective classification based on several variables defined by each researcher, and no clear method of identifying social membership has emerged (see, for example, Macauley[12]).In economics, by contrast, the majority of the studies regarding inequality rely on a very specific and objective measure of social segmentation, which is the level of income of the individuals under analysis. When economic researchers analyze the effect of a certain policy on inequality, for example, the standard methodology consists of calculating its impact on the different quintiles or deciles of the income distribution of the affected population, and that impact is the one that finally defines if the policy under analysis is “progressive” or “regressive”. Moreover, the measurement of economic welfare largely relies on the different income levels as well, through the use of the so-called “welfare functions”. Those functions are typically weighted sums of the levels of per-capita income for different individuals or group of individuals in a certain population, whose weights are inversely related to those income levels.Although income is by no means the only measure to place an individual into a social class, it has the appealing property that it is a magnitude which can be defined as a continuous variable, and this allows to compare two individuals in ways that are not possible using purely qualitative variables. For example, if we divide a population into a high class, a middle class and a low class, then in principle we cannot say “how much higher” the high class is in relationship to the middle class or to the low class. Conversely, if we have information about the individuals’ income, moreover, we can divide the population in as many income classes as we want or need, by simply defining different limits for those classes.The method proposed here relies on the idea that income is a variable which is closely linked to the social status of the individuals, and the relationship between that variable and the linguistic characteristics possessed by those individuals can be seen as a sign that those characteristics are associated to higher or lower levels of income (and thus to higher or lower social classes). The absolute value, the sign and the statistical significance of the coefficients estimated in the regression analyses, therefore, could be useful to interpret the linguistic variables included in the regression as “social class markers”. Using a terminology that is also drawn from econometrics, we will state that the estimated coefficients are the “hedonic prices” of the linguistic characteristics under analysis, in the sense that they serve to attach a (positive or negative) economic value to each characteristic. In an environment like the one that we use in this paper, these hedonic prices are supposed to be useful to detect if the analyzed linguistic characteristics can be seen as positive or negative sociolinguistic markers1.This study about the socio-economic significance of phonetic characteristics in North American English is related to several contributions of the literature, both linguistic and economic. In the linguistic literature, its most obvious link is with the so-called “variable rule analysis”, which began with Cedergren and Sankoff[1] and later developed into numerous contributions devoted to many world languages. Some of those contributions have included income as an indicator of social class, especially through the use of multidimensional indices. One of the methodologies proposed to build those indices is precisely least-square regression analysis2.In the economic literature, correspondingly, least-square regression analysis and hedonic pricing are well-developed tools that are used for many purposes. One of these purposes has been to analyze the relationship of income and linguistic variables, to see if these variables are able to explain some income differences among individuals. This is one of the basis of the so-called “economics of language”, which is a branch of economics that tries to analyze the effects of language on economic activity3.The econometric method that we use here shares insights from both the sociolinguistic and the economic approach, since it uses a least-square regression analysis in which the linguistic variables are the independent variables and income is the dependent variable, but its focus is on the effect of socio-economic status on language. The obtained coefficients, therefore, will not be interpreted as measures of the economic impact of a linguistic characteristic, but as signs that such characteristic has a positive or negative socio-economic meaning.This paper is organized in four additional sections besides this introduction. In section 2 we describe the four phonetic variables that we use, and their geographic distribution in the United States of America and Canada. In section 3 we quantify those variables according to the population and the income of the areas in which each phonetic characteristic appears. In section 4 we briefly explain the methodology used and the results obtained, and in section 5 we present the conclusions of the whole paper.
2. Phonetic characteristics of North American English
- North American English is supposed to have a number of phonetic characteristics that are useful to contrast it with other varieties of English outside North America4. Some of these characteristics are also used to distinguish among accents within North America, and those accents are typically associated with certain geographical areas.One of the characteristics that is generally considered as typical of North American English is rhoticity, that is, the use of the phoneme /r/ in syllabic codas in words such as “car”, “beer” and “more”. Non-rhotic accents, conversely, have lost that r-sound, and have sometimes replaced it by a glide. These non-rhotic accents are also said to exhibit “r-dropping”, especially when they are considered from the point of view of rhotic-accent speakers.Although rhoticity seems to be dominant in North America, there are areas of the United States in which r-dropping is common and even characteristic. Following Labov, Ash and Boberg[10], we can consider that r-dropping is a feature of the English generally spoken in the states of Alabama, Georgia, Louisiana, Mississippi, South Carolina, Connecticut, Maine, Massachusetts, Rhode Island, New Hampshire and New York5.A second phonetic characteristic that is widespread in North America is the so-called “father-bother merger”, that is, the merger of the phonemes /
 / and /
  / in words such as “father” and “bother”, or “palm” and “pot”. When those phonemes merge into a single one, the new phoneme is generally pronounced using the unrounded open back vowel sound[
 ]6.The “father-bother” merger, however, is not present in the typical speech of some North American areas. These areas are the US states of Connecticut, Maine, Massachusetts, Rhode Island, New Hampshire and Vermont, and the Canadian provinces of Prince Edward, Nova Scotia, New Brunswick and Newfoundland. In those cases we can speak of a “father-bother split”, which implies the actual difference between /
 / and /
 / in words such as “father” and “bother”, or “palm” and “pot”.Another important vowel merger that is common in North American English is the so-called “cot-caught merger”, that is, the merger of the phonemes /
 / and /
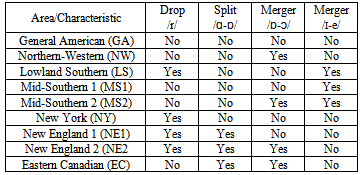
  / in words such as “cot” and “caught”, or “pot” and “bought”7. This merger is supposed to be a general feature of the English spoken in Canada, and also of the accent of the following US states: Alaska, Arizona, California, Colorado, Idaho, Kansas, Kentucky, Maine, Minnesota, Montana, Nebraska, New Hampshire, Oklahoma, Nevada, New Mexico, North Dakota, Oregon, Utah, Vermont, Washington, West Virginia and Wyoming8.A last phonetic characteristic that we are going to use in this paper is the so-called “pin-pen” merger, which is the merger of the phonemes /i/ and /e/ into a single one when they appear before nasal consonants (in words such as “pin” and “pen”, or “tin” and “ten”). The typical pronunciation for this merger is the unrounded semi-closed front vowel sound[i], and its geographical distribution is supposed to occur in the states of Alabama, Arkansas, Georgia, Indiana, Kansas, Kentucky, Louisiana, Mississippi, Missouri, Nebraska, North Carolina, Oklahoma, South Carolina, Tennessee, Texas, Virginia and West Virginia.The intersection of the isoglosses for the four phonetic characteristics described defines nine different geographic areas. One of them is the one that coincides with the characteristics that seem to be dominant in the whole North American continent, which are rhoticity, the “father-bother” merger, and the absence of the “cot-caught” and “pin-pen” mergers. These characteristics are associated with the accent that is commonly referred to as “General American” (GA) in most phonetics’ textbooks 9, and we will use that expression to name the geographical area in which they are all present. That area consists of the states of Delaware, Florida, Hawaii, Illinois, Iowa, Maryland, Michigan, New Jersey, Ohio, Pennsylvania, South Dakota and Wisconsin, and the District of Columbia.The second important geographic area that we will define is characterized by rhoticity, the “father-bother” merger, the “cot-caught” merger, and the absence of the “pin-pen” merger. This combination appears in the US states of Alaska, Arizona, California, Colorado, Idaho, Minnesota, Montana, Nevada, New Mexico, North Dakota, Oregon, Utah, Washington and Wyoming, the Canadian provinces of Alberta, British Columbia, Manitoba, Ontario and Saskatchewan, and the three Canadian “territories” (Yukon, Northwest and Nunavut). As the largest part of this area is in the Northern and Western regions of the United States and Canada, we will define it as “Northern-Western” (NW).The presence of the “pin-pen” merger, conversely, is strongly associated to the Southern and Midland areas of the United States. Its intersection with other phonetic characteristics, however, allows us to define three separate regions in this set of states. We will use the expression “Lowland Southern” (LS) to define the area in which the “pin-pen” merger coexists with r-dropping, and this occurs in the states of Alabama, Georgia, Louisiana, Mississippi and South Carolina. On the other hand, for the states in which the “pin-pen” merger occurs but the accent is rhotic, we will use the expression “Mid-Southern”. This group of states can be further divided into two subsets, depending on the fact that they also exhibit the “cot-caught” merger. The area denoted as “Mid-Southern 1” (MS1) is the one in which we simultaneously find rhoticity and the “pin-pen” merger but no “cot-caught” merger, which covers the states of Arkansas, Indiana, Missouri, North Carolina, Tennessee, Texas and Virginia. The area denoted as “Mid-Southern 2” (MS2) is the one in which we simultaneously find rhoticity, the “pin-pen” merger and the “cot-caught” merger, and this occurs in Kansas, Kentucky, Nebraska, Oklahoma and West Virginia.The combination of r-dropping and no “pin-pen” merger is characteristic of the North-Eastern part of the United States. In New York (NY), for example, this occurs together with the “father-bother” merger and the absence of the “cot-caught” merger. In the group of states generally referred to as New England, conversely, r-dropping coexists with the “father-bother” split. These New English states can be further divided in two subsets, regarding the presence or absence of the “cot-caught” merger. The group of New English states where the “cot-caught” merger is absent (NE1) is formed by Connecticut, Massachusetts and Rhode Island, while the group of New English states in which the “cot-caught” merger is present (NE2) is constituted by the states of Maine and New Hampshire.The last area that arises when we overlap the geographic distribution of the four phonetic characteristics described in this section is the one in which we simultaneously find the “father-bother” split and the “cot-caught” merger, but no r-dropping and no “pin-pen” merger. This covers the Canadian provinces of Prince Edward, Nova Scotia, New Brunswick and Newfoundland, and the US state of Vermont. Although one US state is present in this set, we will use the expression “Eastern Canadian” (EC) to refer to it, since most of its population is located in the eastern (or “maritime”) provinces of Canada.All the intersections of the four phonetic characteristics and their use to define geographic areas appear on table 1. In it we have used the labels “Split /
 -
- /”, “Merger /
 -
- /” and “Merger /i-e/” to refer to the “father-bother” split, the “cot-caught” merger and the “pin-pen” merger, respectively. Note that all the characteristics have been described as “deviations from the General American standard” (so the General American area has a “No” in each of the four columns of the table).The reader may note that, although the characteristics used are not the same, this phonetic division of geographic areas strongly resembles the one used in the modern literature about North American dialectology10. It can even be seen as a refinement of the traditional classification of North American dialects into North-Eastern accents (New England 1, New England 2 and Eastern Canadian), Southern accents (Lowland Southern, Mid-Southern 1 and Mid-Southern 2) and standard American accents (General American, Northern-Western and New York).
|
3. Demographic and Economic Importance of Phonetic Characteristics
- The demographic and economic importance of the four phonetic characteristics mentioned in the previous section can be assessed through a variety of indicators. The two most important ones are probably the total population and the gross domestic product (GDP), associated to each of the areas in which we have divided North America.There are several sources on which we can rely to find the data needed to quantify population and GDP. We have basically used three of them, which are the US Department of Commerce[20], Statistics Canada[16] and the World Bank[21]. From them we have obtained the information to calculate the figures that appear on table 2.
| ||||||||||||||||||||||||||||||||
4. Socio-economic Valuation Through Hedonic Pricing
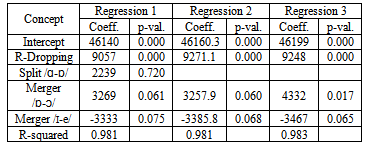
- As we mentioned in section 1, hedonic pricing is an analytical method, originally developed in the field of economic statistics, to decompose the total value of a certain good or service into partial values, associated to the characteristics possessed by such good or service. It relies on a least-square regression analysis, in which the dependent variable is a monetary magnitude (e.g., the price of a good, or the income of a group of people), and the dependent variables represent the characteristics associated to that magnitude.In a context like that, the hedonic prices are the coefficients of the independent variables corresponding to the different characteristics, which are obtained as the result of a least-square regression analysis. This econometric methodology has proved to be very useful when economists want to price characteristics that have no comparable market value (e.g., the presence of adverse effects in drugs, the existence of a park in a certain neighborhood, the presence of pollution in a river). It has also been extensively used to isolate the effect of peoples’ characteristics on wages and other forms of income, both in cases in which those characteristics may have an impact on the person’s productivity (e.g., having a university degree) and in cases in which the focus of the study is wage discrimination (e.g., being part of a certain ethnic group).Least-square regression analyses are relatively common in phonetics (to find correlations between acoustic variables used to characterize sounds) and in sociolinguistics (to find correlations between linguistic variables and environmental determinants such as gender, age and social class)12. They are also very frequently used in economics to explain the behavior of variables such as GDP per capita. It is not very common, however, to find regression analyses that correlate economic and linguistic variables, although there are some papers that have advanced in that direction, especially in what concerns the relationships between linguistic capacities and income levels.The method that we use in this section, although similar to the ones commonly used in economics, has a completely different and, probably, more modest objective. Its aim is not to explain economic phenomena through linguistic variables (or vice-versa), but to correlate per-capita income levels and phonetic variables, to see if those variables have a statistically significant value as a positive or negative sociolinguistic marker. In order to do that, we run a multiple least-square regression whose form is the following:GDPPC = α0 + α1*DROPR + α2*SPLITAO + α3*MERGEOO + α4*MERGEIE ;where GDPPC is the per-capita income of the different US states and Canadian provinces, and DROPR, SPLITAO, MERGEOO and MERGEIE are “dummy variables” (i.e., variables that can take a value of either zero or one) that account for the presence or absence of the four phonetic characteristics analyzed in this paper (i.e., r-dropping, the “father-bother” split, the “cot-caught” merger, and the “pin-pen” merger).In a regression like this, α1, α2, α3 and α4 are the hedonic prices of the characteristics under analysis, and the estimated values for those coefficients are measures of the expected increases or decreases in GDP per capita that can be associated to those characteristics. As a result of our regression analysis, moreover, we also obtain measures of the statistical significance of those characteristics (which can be deduced from their respective “p-values”) and a measure of the goodness-of-fit of the regression (through the so-called “coefficient of determination” or “R2 coefficient”)13. All these results are reported on table 4, which shows the output of three regressions performed using different assumptions.
|
|
5. Conclusions
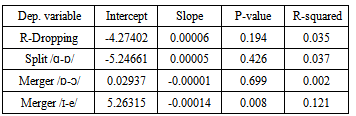
- The sociolinguistic literature has long been interested in interpreting different linguistic characteristics as socio-economic “markers”. The methodologies proposed to do that, however, tend to be rather subjective, since the very concept of social class (which is taken from the sociological literature) is something that depends on different variables whose relative importance is not clear.The economic literature, in contrast, tends to use a single indicator of socio-economic status (per capita income), which has the advantage of being a continuous variable. Making use of that property, in this paper we have tried to link income to several phonetic characteristics, and to infer if those characteristics could be associated to increases or reduction in that income.The geographic distribution of four important phonetic characteristics that are present in North American English (r-dropping, and the “father-bother”, “cot-caught” and “pin-pen” mergers) is useful to define different areas and to study the relationship between the presence or absence of those characteristics and per-capita income in those areas. In order to do that, we have first used a descriptive approach that calculates the figures for the GDP per capita that correspond to regions in which each of the four analyzed characteristics is either present or absent, and found some variation that seems to indicate that r-dropping and the “father-bother” split are associated to areas with a relatively higher per-capita income, while the “cot-caught” merger and the “pin-pen” merger are associated to areas with a relatively lower per-capita income. These results are essentially the same that we find when we run logistic regression equations in which each characteristic is the dependent variable and GDP per capita is the independent variable, although those equations always show a very poor fit and, sometimes, coefficients that are not statistically different from zero.If we apply an alternative method (hedonic pricing), drawn from the literature on economic statistics, and use GDP per capita as the dependent variable and the four phonetic characteristics as independent variables, then our results improve considerably. We now find that, although the “father-bother” split coefficient is not statistically different from zero, the coefficients for r-dropping and the “cot-caught” and “pin-pen” mergers are statistically significant. We also find that, controlling for the presence of the other characteristics, the “cot-caught” merger seems to increase rather than decrease the expected per-capita income of the regions in which it is present. These results seem to be relatively robust, since they do not qualitatively change when we try different regression specifications.The empirical exercise that we performed in this paper, however, may be subject to some criticism. One of its biggest weaknesses is that it relies on aggregate data (at a state or provincial level), and it is therefore unable to capture the association between phonetic differences and variables such as gender, age or social class inside a particular geographic area15. This weakness, notwithstanding, has more to do with the actual database that we assembled than with the method itself, since it would be perfectly possible to apply a similar methodology using data from individuals (who report their personal incomes). The main advantage of the methodology presented here, we believe, is the fact that it addresses the correlation that linguistic variables simultaneously have with a socio-economic variable such as per-capita income, and measures that correlation through a set of monetary values (hedonic prices) that can be contrasted among themselves using their sign, their absolute value and their statistical significance.
Notes
- 1. For a review of the literature about hedonic pricing, which includes a detailed explanation of its use in economics, see Nesheim[13].2. For a good review about the literature on numerical social-class index, see Chambers[2], chapter 2. 3. For an introduction to the economics of language, with examples taken from the literature on the relationship between language proficiency and income, see Chiswick[3].4. See, for example, Swan[18].5. In fact, the isoglosses reported in[10] do not exactly coincide with state borders. In this paper, however, we will approximate them to those borders, in order to make them comparable with the quantitative information that we use in the following sections.6. For a more precise description of this and other mergers analyzed in this paper, see Thomas[19].7. When the “cot-caught” merger appears together with the “father-bother” merger, the three phonemes of standard British English which are commonly denoted as /
 /, /
/, / / and /
 / merge into a single one, which is typically pronounced as[
 ]. In accents characterized by the “cot-caught” merger and the “father-bother” split, conversely, /
  / and /
 / merge into a phoneme whose standard pronunciation is the rounded mid-open back vowel[
 ], and the unrounded open vowel[
 ] is kept as separate phoneme.8.This feature, for example, is used to characterize the kind of American (Californian) English described in Ladefoged[11].9. See, for example, Rogers[14], chapter 6.10. See, for example, Clopper and Pisoni[5].11. The figures on table 2 do not include the ones that correspond to the Canadian province of Quebec, which is supposed to be a basically Francophone area.12. See, for example, Clopper and Pisoni[4] and Labov[9].13. For an explanation of these concepts, see Johnson[7], chapter 3.14. All the regressions whose results are reported in this paper were run using E-Views 3.1.15. In variables such as r-dropping, for example, a considerable social-class variation has been reported in several geographic locations (Romaine[15]), and it is even possible to find cases in which r-dropping is associated to age or to the history of a person’s family in a particular area (Sumner and Samuel[17]).
References
| [1] | Cedergren, Henrietta and David Sankoff, “Variable Rules: Performance as a Statistical Reflection of Competence”, Language, vol.50, pp.333-355, 1974. |
| [2] | Chambers, J. K., Sociolinguistic Theory, revised edition, Wiley-Blackwell, UK, 2009. |
| [3] | Chiswick, Barry, “The economics of language: an introduction and overview”, Bonn Institute for the Study of Labor, IZA DP 3568, 2008. |
| [4] | Clopper, Cynthia and David Pisoni, “Some Acoustic Cues for the Perceptual Categorization of American English Regional Dialects”, Journal of Phonetics, vol.32, pp.111-140, 2004. |
| [5] | Clopper, Cynthia and David Pisoni, “The Nationwide Speech Project: A New Corpus of American English Dialects”, Speech Communication, vol.48, pp.633-644, 2006. |
| [6] | Coloma, Germán, “An Econometric Method to Detect the Social Significance of Linguistic Variables”, Glottotheory, vol.3, no.2, pp.9-21, 2010. |
| [7] | Johnson, Keith, Quantitative Methods in Linguistics, Blackwell, USA, 2008. |
| [8] | Labov, William, The Social Stratification of English in New York City, Center for Applied Linguistics, USA, 1966. |
| [9] | Labov, William, “A sociolinguistic perspective on sociophonetic research”, Journal of Phonetics, vol.34, pp.500-515, 2006. |
| [10] | Labov, William, Sharon Ash and Charles Boberg, Atlas of North American English: Phonetics, Phonology and Sound Change, Mouton, Germany, 2007. |
| [11] | Ladefoged, Peter, “Illustrations of the IPA: American English”, in Handbook of the International Phonetic Association, pp.41-44, Cambridge University Press, UK, 1999. |
| [12] | Macauley, Ronald, “Sociolect/Social Class”, Encyclopedia of Language and Linguistics, 2nd. edition, pp.484-489, 2006 |
| [13] | Nesheim, Lars, “Hedonic price functions”, London University College, CEMMAP WP 18/06, 2006. |
| [14] | Rogers, Henry, The sounds of language, Longman, UK, 2000. |
| [15] | Romaine, Suzanne, “Language and Social Class”, International Encyclopedia of the Social and Behavioral Sciences, pp.8308-8312, 2001. |
| [16] | Statistics Canada, Nominal and Real GDP by Province and Territory 2004-2008, Online Available: www.statcan.gc.ca. |
| [17] | Sumner, Meghan and Arthur Samuel, “The Effect of Experience on the Perception and Representation of Dialect Variants”, Journal of Memory and Language, vol.60, pp.487-501, 2009. |
| [18] | Swan, Michael, “English in the Present Day”, Encyclopedia of Language and Linguistics, 2nd. ed., pp.149-156, 2006. |
| [19] | Thomas, Erik, “Vowel Shifts and Mergers”; Encyclopedia of Language and Linguistics, 2nd. ed., pp.484-494, 2006. |
| [20] | US Department of Commerce, Nominal and Real GDP by State 1997-2008, Online Available: www.bea.gov. |
| [21] | World Bank, Population and Gross Domestic Product 2008, Online Available: http://dataworldbank.org. |