Kebede Abu Aragaw
Department of Statistics, Arba Minch University, Arba Minch, Ethiopia
Correspondence to: Kebede Abu Aragaw, Department of Statistics, Arba Minch University, Arba Minch, Ethiopia.
| Email: |  |
Copyright © 2015 Scientific & Academic Publishing. All Rights Reserved.
This work is licensed under the Creative Commons Attribution International License (CC BY).
http://creativecommons.org/licenses/by/4.0/

Abstract
Satisfying users need in academic libraries should be the primary objective of the libraries and librarians. Satisfaction is the pleasure, fulfillment, and happiness gained when one fulfilled his/her desire need, expectation, and better services. The aim of the study was to assess the factors that affect satisfaction of library users of Science Library, Addis Ababa University. Our study used primary data which was collected by distributing structured questionnaire for 144 students of Science library users, Addis Ababa University and analyzed using SPSS version 16. The study used both descriptive and inferential statistics method of data analysis. Under descriptive statistics, frequency table and bar chart which was essential for determining the percentage of students whether satisfied or dissatisfied based on different factors. Under inferential part, chi-square test of associations and binary logistic regression were used. Out of 144 respondents 41.7% were satisfied by using library and the remaining 58.3% were not satisfied. Satisfaction of students on the use of library was depend on availability of reference and text book, the services given by the library workers, availability of catalogue while searching for books and availability of internet services. The bivariate analysis reveals statistically significant association between reference/text book, availability of internet connection, time spent in the library, problem within library and satisfaction of students. In contrast, there is no significant association between Satisfaction of respondent on service given by the librarian and qualification of librarian, availability of catalogues while searching to got reference/text book. Results for binary multiple logistic regression analysis reveals that reference, availability of internet connection and time spent in the library have a statistically significant positive effect on Satisfaction of students in academic libraries. The result also shows that odds of dissatisfaction of students that did not threat wisely by the librarian is 3.563 times that of did not get discussion room given the other variables were kept constant. Generally better service given by librarians plays a critical role in determining the satisfaction of library users'.
Keywords:
Satisfaction of Academic Library Users, Logistic Regression, Science Library, Addis Ababa University
Cite this paper: Kebede Abu Aragaw, Assessing Satisfaction of Library Users in Case of Science Library, Addis Ababa University, International Journal of Library Science, Vol. 4 No. 3, 2015, pp. 59-64. doi: 10.5923/j.library.20150403.03.
1. Introduction
Library is the center of reference, books, periodicals, computers, internet services and other media. Library forms a vital parts of the world’s methods of communication and education. People in all walks of life, use library resources in their work, including students, teachers, scientists, scholars, and government officials. Large number of people turns to library to satisfy desire for knowledge and to obtain materials for some kinds of leisure time activity. In addition, many people enjoy book discussion, concerts, and variety of other activities provided by libraries.Satisfaction of library users is the users feel after dealing with library. This includes their perception to be gained in using the library services and materials such as reference, books, catalogue, internet services, and opening time of library. User satisfaction is a complex concept. It may simply be how good users feel after dealing with a library, it may include their likelihood to return to that library when next they need information. It may also include their perception of how well the experience answered their information problem, improved their productivity or the quality of their own creativity. Satisfying users need in academic libraries should be the primary objective of the libraries and librarians. Satisfaction is the pleasure, fulfillment, and happiness gained when one fulfilled his/her desire need, expectation, and better services. Millson-Martula and Menon (1995) state that one element of high quality service is “the incorporation of users’ personal needs and expectations into the development of programs and service”. The concept of user satisfaction in the library has evolved to include a broader focus on the users’ perspective of the library. Applegate (1997) defines user “satisfaction as a personal, emotional reaction to a library service or product”.Each year new students enter the learning environment with varying library usage and information gathering skills. Even in academic situation, users need and expectations vary. The capacity of Addis Ababa University to accept new students increase from time to time. To serve and satisfy their needs, the facility also increases from time to time. Among this, establishing additional library with enough materials and services is the primary goal. Addis Ababa University consists of Kennedy Library, Science Library, Faculty of Business and Economics Library, Technology library, Law library Medical Faculty Library and Digital Library. This study concerns only Science library.
1.1. Statement of the Problem
The successful planning of any information use pattern system in library must ultimately depend upon understanding of users need and performance in seeking information. One important measure libraries successful as information system is the degree to which it’s various service and facilities are used by its potential user group. This measure is simultaneously a good indicator of how well the library planners understand users need related to information seeking pattern. A library provides the ground by making home for information, for assigning their thirsty of those who continuously try to acquire knowledge. In this case the quality and effectiveness of library depends on the availability of the relevant information and there access to the users. Research concerning satisfaction of academic library users can be conducted for qualification of the existing library and information system the benefit of improving the efficiency and effectiveness of the library giving information and assess to users. In this respect, the study was essential because it is the means to know information seeking behaviors, the materials mostly used by users and problem related to information use in library. Of the particular interest to this study was the Science academic library in Addis Ababa University and its users.
1.2. Objective of the Study
1.2.1. General Objective
The main objective of the study was to asses satisfaction of Science library users in Addis Ababa University.
1.2.2. Specific Objective
v To know the present status of Science library v Assess whether the librarian were qualified enough to satisfy the users needv To test whether availability of reference, availability of internet connection and time spent in the library, availability of catalogues, service given by the librarian and qualification of librarian effect Satisfaction of students given by academic libraries.
1.3. Significance of the Study
This study helps to adjust the information source, service delivered by Science Library and constraints faced by Library users. In addition, the study was important for the library administrators and workers to know the major problem and provides direction to take the appropriate measurement. Furthermore, it is our hope that the study may also give some understanding to the academic libraries of similar nature to conduct periodicals.
2. Data and Methodology
2.1. Data
2.1.1. Source of Data
2.1.1.1. Description of study Area and Method of Data Collection
The study was conducted in Science Library, which was found in Science Faculty in Addis Ababa University. As the source of data for the study is primary data, structured questionnaires used to collect information from respondents.
2.2. Sample Size Determination
Even though it is known that more reliable information is obtained from large sample size and accurate and successful result on the finding, by considering availability of budget, time and data collectors will determine the required sample size. To determine sample size variability; confidence levels and margin of error is considered. In this research to determine the sample size simple random sampling was used. First to determine sample size we need to conduct a pilot survey since there is no previous result and difficult to guess the distribution of the population. A pilot survey is used to determine sample size and check the appropriate usage of questions through the main variable. Then based on these we will prepare the questionnaires to the selected sample and get the proportion of samples so that we could use the formula for sample size determination. Accordingly, the value of p and q was obtained from pilot survey. In this research, the formula used to determine sample size was as follow: Where: Z=z-distributionno= initial sample sized = margin of errorp = the proportion of sample (students) who was satisfied with libraryq = the proportion of sample (students) who was not satisfied with libraryThe sample size required to conduct this research depend on level significance (α=0.05), Margin of error (d=0.08) and the proportion of sample who was satisfy with library (p=0.4). Following the procedure we have got sample size 144. Further discussions on sampling methods are available in detail in (Cochran, 1977).
2.3. Methodology
In this study we have used binary logistic regression to analyze our data because our response variable is dichotomous variable.
2.3.1. Binary Logistic Regression Analysis
Logistic regression is part of a family of models called the Generalized Linear Model used when the response variable is qualitative in nature or categorical and independent variables may be either continuous or categorical. Qualitative response variable are either binary (dichotomous variable) or multiple category. Binomial or binary logistic regression is the form of regression which is used when the dependent variable is dichotomous and the independent variables are of any type (Hosmer and Lemeshow, 2000).
2.3.1.1. Assumptions of Logistic Regression
• Meaningful coding. Logistic coefficients will be difficult to interpret if not coded meaningfully. The convention for binomial logistic regression is to code the dependent class of greatest interest as 1 and the other class as 0.• Logistic regression does not assume a linear relationship between the dependent and independent variables.• The independent variables need not be interval, nor normally distributed, nor linearly related, nor of equal variance within each group.• The categories (groups) must be mutually exclusive and exhaustive; a case can only be in one group and every case must be a member of one of the groups.
2.3.1.2. Model Specification
When the response variable is binary; there is considerable empirical evidence that the shape of the response function should be nonlinear. A monotonically increasing (or decreasing) S-shaped (or reverse S-shaped) function. This function is called the logistic response function and has the form: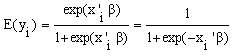 | (3.1) |
Where 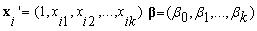 The above function can be easily linearized.
 | (3.2) |
be the linear predictor where  is defined by the linear transformation
  | (3.3) |
The transformation is called the logit transformation of the probability  and the ratio
  in the transformation is called the odds.
2.3.1.3. Method of Estimation
The general method of estimating logistic regression parameters is called maximum likelihood. The method of maximum likelihood yields values for the unknown parameters which maximize the probability of obtaining the observed set of data. In order to apply this method we first construct a function, called the likelihood function. This function expresses the probability of the observed data as a function of the unknown parameters. The maximum likelihood estimators of these parameters are chosen to be those values that maximize this function. Thus, the resulting estimators are those which agree most closely with the observed data. We now describe how to find these values from the logistic regression model. Since each yi represents a Bernoulli count in the ith population, the probability distribution function of yi is given by: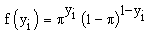 | (3.4) |
Then the likelihood function is the joint probability distribution of all n observation is: 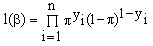 | (3.5) |
The principle of maximum likelihood states that we use as our estimate of parameter the value which maximizes the expression in equation (3.5). However, it is easier mathematically to work with the log of equation (3.5). This expression, the log likelihood, is defined as: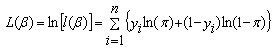 | (3.6) |
The maximum likelihood estimates are the values for  that maximize the likelihood function in equation (3.6). Through maximization of the log-likelihood function we can theoretically estimate the parameter vector
  . But the equation is nonlinear in
  , and as a result the estimates do not have a closed form expression. Therefore,
  will be obtained by maximizing using iterative algorithm method (Agresti, 1996).
2.3.1.4. Goodness of Fit of the Model
After fitting a model to a set of data, it is natural to enquire about the extent to which the fitted values of the response variable under the model compare with the observed values. If the agreement between the observations and the corresponding fitted values is good, the model may be acceptable. If not, the current form of model will certainly not be acceptable and the model will need to be revised.
2.3.1.4.1. Pearson Chi-Square Test
The Pearson  statistic is based on observed
  and expected
 observations.
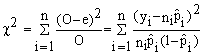 | (3.7) |
Where:  is the observed value of Y.
 is the predicted or fitted value of Y for a given of xini is the number of observations.High values of Pearson chi-square for a given independent variables indicates that there is strong association between each of the given independent variables and the dependent variable keeping the effect of the other factors constant. That is, testing the hypothesis:Ho = There is no association between the variablesH1 = There is association between the dependent and the particular independent variableThe decision was based on the Chi-square value, P-value and at 0.05 level of significance.
2.3.1.4.2. The Likelihood Ratio Test
The likelihood ratio (LR) test is performed by estimating two models and comparing the fit of one model to the fit of the other. Removing predictor variables from a model will almost always make the model fit worse (i.e., a model will have a lower log likelihood), but it is necessary to test whether the observed difference in model fit is statistically significant. The likelihood ratio test does this by comparing the log likelihoods of the two models. If this difference is statistically significant, then the less restrictive model (the one with more variables) is said to fit the data significantly better than the more restrictive model. If one has the log likelihoods from the models, the likelihood ratio statistic is fairly easy to calculate. The likelihood ratio test is performed to test the overall significance of all coefficients in the model on the basis of the test statistic: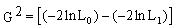 | (3.8) |
Where: L0 is the likelihood of the null model and L1 is the likelihood of the saturated model. Under the global null hypothesis, H0: β1 = β2 = ... = βk = 0, the statistic G2 follows a chi-square distribution with k-1 degrees of freedom and measures how well the independent variables affect the response variable (Hosmer and Lemeshow, 2000).
2.3.1.4.3. Hosmer-Lemeshow Test
The Hosmer-Lemeshow test is used to check the overall model fit. In this approach, data are divided into g (usually10) groups. From each group, the observed and expected number of events will be computed. Then, the Hosmer-Lemeshow test statistic is given by: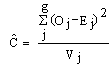 | (3.9) |
Where:  g is the number of group,
  is observed number of events in the jth group, Ej is expected number of events in the jth group, and Vj is a variance correction factor for the jth group. If the observed number of events differs from what is expected by the model, the statistic
  will be large and there will be evidence against the null hypothesis that the model is adequate to fit the data. This statistic has an approximate chi-square distribution with (g-2) degrees of freedom (Agresti, 1996).
2.3.1.4.4. Wald Test
A Wald test is used to test the statistical significance of each coefficient (β) in the model. The test statistic is a chi-square statistic with a desirable outcome of non-significance, indicating that the model prediction does not significantly differ from the observed.The hypothesis to be tested is: Versus
  at
at  level of significance.The Wald test statistics, Z, for this hypothesis is
 | (3.10) |
 is the square of the estimated regression coefficient and
  is the variance of
3. Results and Discussion
3.1. The Bivariate Analysis
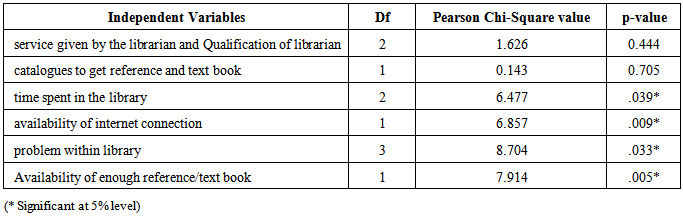
This section uses the Pearson chi-square test to assess factors affecting satisfaction of library users and independent variables. The level of significance for the association was set up at 20% to 25%. For all independent variables taking one-at-a time, a test of association was carried out using the Pearson chi-square. High values of Pearson chi-square for a given independent variable indicates that there is strong association between the given independent variable and the dependent variable keeping the effect of the other factors constant. That is, testing the hypothesis:Ho = There is no association between the response and an independent variableH1 = There is association between the response and a particular independent variableThe decision was based on the Chi-square value, P-value and at 0.05 level of significance. Table 1 shows that there is statistically significant association between reference/text book, availability of internet connection, time spent in the library, problem within library and satisfaction of students. In contrast, there is no significant association between Satisfaction of respondent on service given by the librarian and Qualification of librarian, availability of catalogues while searching to got reference / text book. Table 1. Shows chi square values along with their associated p-values for the independent variables and Satisfaction of library users
 |
| |
|
3.2. Multivariable Analysis
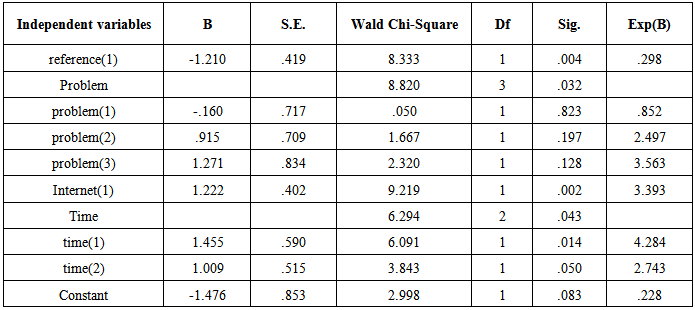
Binary logistic regression was employed to predict the probability that Science Library users were satisfied. The results of the binary logistic regression are given in Table 2 which displays the estimated coefficients, odds ratio, p-value and Wald statistic. The result revealed that out of all variables entered into the logistic model, all were found statistically significant.Table 2. Results of Binary Logistic Regression Analysis for the independent variables and Satisfaction of library users
 |
| |
|
Binary logistic regression analysis revealed controlling other variables in the model, the odds of dissatisfaction of students that spend medium time in the library is 4.284 times higher than the odds of students spend more time given the effect of other Variables were kept constant. Similarly, the odds of dissatisfaction of students that spend few time in the library is 2.743 times higher than the odds of students spend more time given the effect of other variables were kept constant. As compared to library users who hadn't got discussion room, library users who didn't got enough place were 25% less likely to be satisfied. Similarly, the odds of dissatisfaction of students that did not threaten wisely by the librarian is 3.563 times higher than that of library users who did not got discussion room given the other variables were kept constant.
3.3. Goodness of Fit of Logistic Regression Model
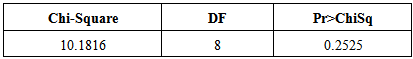
A. The Hosmer and Lemeshow Goodness-of-Fit Test tests the hypothesis:Ho: The model is a good fit versus.Ha: The model is not a good fitThe value of the Hosmer-Lemeshow goodness-of-fit statistic is  =10.1816 and the corresponding p-value computed from the chi-square distribution with 8 degrees of freedom is 0.2525. A large p-value (>0.05) usually suggests that the fitted model is an adequate model. In this case, the p-value = 0.2525>0.05, so we do not reject the null hypothesis, and the model predicts the data very well (Table 3).
Table 3. Hosmer and Lemeshow Goodness-of-Fit Test
 |
| |
|
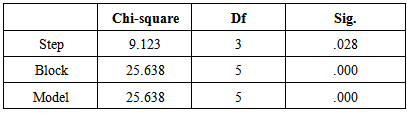
B. Omnibus Tests of Model CoefficientsThe omnibus test of model coefficients tests if the model with the predictors is significantly different from the model with only the intercept. From table 4 of omnibus test of model coefficient indicates the overall significance of the model coefficient when at least one variable is including in the model.Therefore, the binary logistic model is fitted or the model is significance.Table 4. Omnibus Tests of Model Coefficients
 |
| |
|
4. Conclusions
From the responses of the library users several findings have been summarized. Based on these findings with the help of the facts discussed in the background information which obtained from the library users and in the review of related researches the following conclusions has been made. The analysis of data revealed that most of the library users depend on the procedure of checking Science library catalogue, only some students asking the circulation desk for help and asking students/ classmates for obtaining information or materials. Therefore, the library should make its users well aware to the author/title catalogue and other retrieving tools, in order to make the users effective information users in the library and to have a better information use pattern. More than half of the respondents have indicated that they have good relationship with the librarian. However, some of the library users those reply poor relationship described such relationship as a presence of users’ discrimination in reading service which has a negative impact on the information use pattern of users.Even though, most of the users have good relationship, the library should try its best to improve the existing poor relationship has an important step to increase the habit of libraryusers.41.7% of the respondents were partly satisfied with the library materials; the library still need has to give a considerable attention. The problem encountered by majority of users when searching for information in library was found to be the unavailability of required information and the other is that it takes too much time to retrieve information. Therefore, to increase the satisfaction of library users, orientation should be given on the use, rule and regulation of the library. The presence of orientation increases the attitude of users to the use of information source and service available in the library. Hence, orientation is important program that should be expand in a wider way to make all users aware the available service and sources in the academic libraries.
References
| [1] | Millson-Martula, C., and Menon, V. (1995). Customer expectations: Concepts and reality for academic library services. College & Resmrch Libraries, 56(l), 33-47. |
| [2] | Applegate, R. (1997). “Models of Satisfaction” in Encyclopedia of Library and Information Science, 60(23), pp. 200. |
| [3] | Cochran, W. G., (1977). Sampling Techniques, 3rd, Ed, John Wiley& Sons, Inc., New York. |
| [4] | Hosmer, D.W. and Lemeshow, S. (2000). Applied Logistic Regression. John Wiley and Sons Inc., New York. |
| [5] | Agresti, A. (1996). An Introduction to Categorical data Analysis. John Wiley and Sons, Inc., New York. |

 Abstract
 Reference
 Full-Text PDF
 Full-text HTML