Konstantinos Kalovrektis1, Apostolos Xenakis1, Antonios Gotsinas2, Ioannis Korinthios1, Georgios Stamoulis1
1Department of Computer Science and Telecommunications, University of Thessaly, Lamia, Greece
2Department of Computer Science, University of Piraeus, Piraeus, Greece
Correspondence to: Konstantinos Kalovrektis, Department of Computer Science and Telecommunications, University of Thessaly, Lamia, Greece.
| Email: |  |
Copyright © 2020 The Author(s). Published by Scientific & Academic Publishing.
This work is licensed under the Creative Commons Attribution International License (CC BY).
http://creativecommons.org/licenses/by/4.0/

Abstract
Stress is a natural reaction of our body when we are facing new emotions and demanding tasks at our daily lives. Anxiety further enhances the feeling of fear. In addition, anxiety is caused due to a stimulus that makes people feeling weak, because of an overall insecurity regarding what is going to happen. The difference between stress and anxiety lies in the fact that stress is an internal emotion as opposed to external psycho - compressive factors that constitute stress (i.e. such as a loss of a beloved person, a natural disaster, pressure in working conditions etc.). In this paper, we design, propose and test a wireless sensor system for measuring and transmitting biometric magnitudes of heart rate and blood oximetry. Parts of our system can be easily attached to a set of persons, who take part in an experimental process of controlled stress and anxiety environment and record stress biosignals. Our system is based on a lightweight customized 802.15.4 wireless protocol design, able to guarantee energy efficiency of our testbed.
Keywords:
Wireless Sensor Networks, ZigBee, Biosignal, Stress Levels, IoT
Cite this paper: Konstantinos Kalovrektis, Apostolos Xenakis, Antonios Gotsinas, Ioannis Korinthios, Georgios Stamoulis, A Customizable Wireless Sensor System for Estimating and Transmitting Human Stress Levels Biosignals with IoT Platform, Journal of Wireless Networking and Communications, Vol. 10 No. 1, 2020, pp. 9-16. doi: 10.5923/j.jwnc.20201001.02.
1. Introduction
Stress is a natural reaction of our body when we are facing new emotions, which may under certain circumstances, oppresses us. The feeling may cause weirdness, which is normal reaction, but we may find it difficult to successfully confront, because we may have not experienced it before. Stress triggers the release of adrenaline, which allows us to make quick decisions, respond to challenges and stay alert [1]. Usually, situations that cause people intense emotions are also related to stress events [2]. That is, any situation that makes us angry, sad, worried and even happy or anxious may cause us stress. Simply said, stress is a body and mind state change, due to disturbances to our emotional normal state. However, stress puts a lot of strain on our cardiovascular system and can lead to depression, or serious cardiac episodes [11] [12]. Therefore, a system that works as an alert signal regarding stress levels is vital.Anxiety is usually generated when we have a feeling of insecurity about what is going to happen, about how we can control things, when confusion prevails, and we can't figure out some things or draw clear conclusions about a situation [2], [3]. Stress at initial states might act as an alert mechanism. Some people are unable to recognize the causes of stress as they experience it, or suffer afterwards from anxiety disorders that disrupt their lives. In most of the cases, phobias and anxiety may interfere with person’s normal lifes [9]. To this end, stress becomes a worrying factor, which we should not ignore it, especially when it begins to interfere with persons lives, reducing their strength, their well - being behaviour and their quality of life. In such cases, one has to learn ways to manage stress. In the case that stress levels increase and are maintained that way, or it is not necessarily caused by specific stimuli, then it becomes the main disorder factor and can be detrimental to a person's health status. Anxiety disorders, such as generalized anxiety disorder or panic disorder, simple or complex phobias (i.e. agoraphobia, social phobia, hypochondria etc.) are differentiated from the daily feeling of anxiety in terms of their occurrence frequency and intensity [8] [10].The difference between stress and anxiety therefore lies in the fact that stress is an internal emotional condition as opposed to an external psycho - compressive factors that constitute stress (i.e. a loss of a person, a natural disaster phenomenon, pressure conditions in working environments etc.). As aforementioned, stress is a condition characterized as disturbance of our normal way of living, while anxiety is an emotion of fear we experience, due to an unknown situation with consequences we cannot acknowledge. In the long run, both stress and anxiety may cause heart rate problems [14], hear beat disturbances, blood oximetry variations and blood pressure rise [9] [10].Therefore, energy efficient acquisition of biometric signals to study the influence of stress and anxiety factors in a controllable experimental environment plays an important role for the study of stress and their influence on peoples' health conditions such as cardiovascular problems and depression [11]. In this paper, we design, test and propose a wireless sensor system for measuring and efficiently transmitting biometric signals regarding stress levels, including heart rate and blood oximetry levels [14]. Our system modular design comprises of sensors that can be easily attached to a set of persons, who take part in the experimental process of controlled stress signals study. We enhance the wireless capability of our system with a customized lightweight ZigBee - based version for better scalability and efficient data transfer. We manage to connect our sensors with a central coordinator without delays or interferences. Furthermore, we transfer our system's data through an open IoT platform, such as Think Speak[18], and make them available through the Internet for further analysis.The rest of the paper is organized as follows: In section 1 we gave a brief Introduction regarding the scope of the paper and in section 2 we present some relevant works. In section 3 we describe our proposed system in terms of hardware design, usage and communication efficiency and present its functionality. Finally, in section 4 we conclude our paper.
2. Related Works
Several works according to literature have been dedicated on biosignals acquisition methods, related to studying the influence of stress and anxiety. In this section, we present some of them and comment regarding the differences of our system as compared literature. Authors in [4] suggest a stress detection system that sense stress levels through body temperature, movement rate and sweat from physical activities. The system uses a neural network approach based on Mamdani-type Fuzzy logic controller with 150 cases to test. The acquired data is stored at the Cloud, which can help monitor the person's stress level in real time, thus reducing health risks. The proposed system has a high prediction accuracy of 97% and performs with low energy in real time.Following, the work on [5] develops a comprehensive non - invasive vital signs monitoring system to measure biosignals such as heart rate variability and skin temperature changes and to assess the system's ability to detect stress levels. An algorithm is proposed to measure pulse rate with high accuracy, based on infrared (NIR) images of human cheek, and nose and forehead skin temperatures were estimated, based on infrared images. According to experimental results, the system was able to calculate pulse rate with sufficient accuracy. The work of [6], achieves the goal of developing a personal health system for detecting stress levels. The system uses analysis of the discriminative power of electro dermal activity (EDA) in distinguishing stress from cognitive load in an office-working environment. A collective of 33 subjects underwent a laboratory intervention that included mild cognitive load and two stress factors, which are relevant at the workplace: mental stress induced by solving arithmetic problems under time pressure and psychosocial stress induced by social-evaluative threat. During the experiments, a wearable device was used to monitor the EDA as a measure of the individual stress reaction. Analysis of the data showed that the distributions of the EDA peak height and the instantaneous peak rate carry information about the stress level of a person. Six classifiers were investigated regarding their ability to discriminate cognitive load from stress. A maximum accuracy of 82.8% was achieved for discriminating stress from cognitive load. This would allow keeping track of stressful phases during a working day by using a wearable EDA device.However, most of the literature studies, propose wireless data transmission devices using Bluetooth or Wi - Fi protocols to transmit information to a central collection centre for processing. In biosignals measurement and transmission systems, it is recommended that the sensors must be pervasive enough and adaptable to human body, without causing any uncomfortable situations [12] [13]. In fact, when a person is involved in the medical experimental process of wearing sensors not well attached, it may cause problems and increase stress levels, thus altering the results. We have considered this in our system design and thus properly integrate tiny sensors attached and latched on human earlobes. Moreover, our system uses a custom and lightweight ZigBee – based protocol version that uses less firmware code and thus makes the data transmission more energy efficient and robust.
3. System Model Design
In this section, we provide all details regarding the proposed system design. We also test our system’s response in terms of real data acquisition and processing.
3.1. Design and Integration
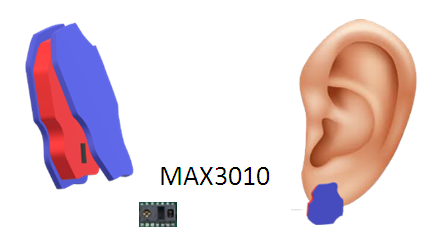
The integrated MAX30100 circuit incorporates oximeter and heart rate measurement functions. It uses photodetectors and optimized technologies for measuring reflected light radiation to detect signals of heart rate and oximetry pulses [11]. The system is depicted in fig. 1.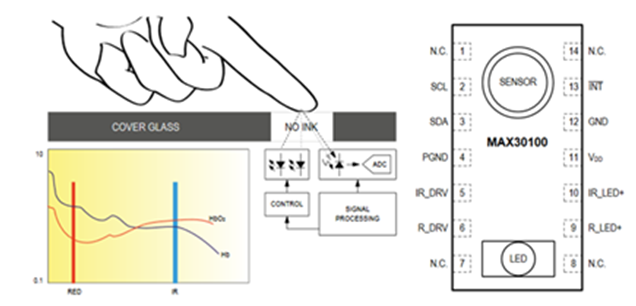 | Figure 1. MAX30100 sensor system [19] |
The integrated circuitry of MAX30100 is a key element for our proposed system due to its size and its power consumption at idle state (i.e. 0.7uA). These characteristics meet all the operating requirements of a wireless battery – operated device. Power supply circuitry requires two different voltage levels, the one at 1.8V for powering the integrated internal drive circuits and the other of 3.3V level for the LED. These power levels should be achieved by using button - cell batteries or rechargeable batteries that are small enough to fit in a small device, placed on the patients’ finger. Another important factor to be taken into design consideration is the weight. Therefore, this requirement lead us to use lithium – ion batteries that weight 30% less, as compared to Ni- MH or Ni – Cd batteries. To this end, battery size and lifetime is an important factor to be considered when designing such a WSN system, as it should be small enough to fit into a small and lightweight device design.There are many lithium batteries, in various sizes, that meet the aforementioned requirement. For our system, we choose a rechargeable lithium AA battery with a supply voltage of 1.5V, as the main power supply. The power supplies required for the operation of our system are as follows: a 1.8 voltage to supply the internal circuitry of the integrated MAX30100 [19] and a 3.3 voltage to supply the LEDs and the rest of the circuitry. As a result, a circuit power supply is required that will have the input voltage of the AA battery and will produce two levels, 1.8V and 3.3V, as required. The power supply circuitry for our proposed system uses the integrated NCP 1402 circuit [15], as shown in fig.2, which allows the battery voltage to be raised to the 3.3V level, as required to power all parts of the device’s circuitry.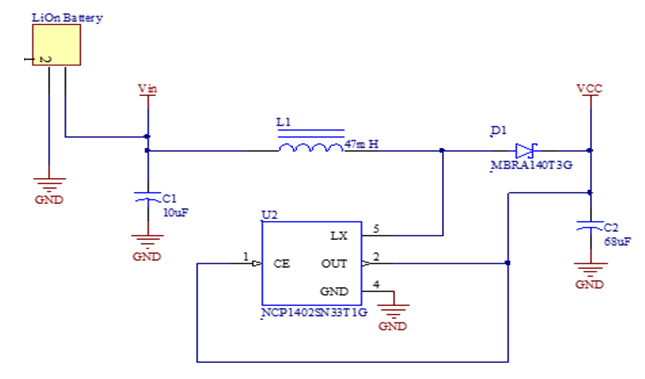 | Figure 2. Power supply NCP 1402 circuit schematic at 1.8 V [X] |
The 1.8 voltage level can be obtained by stabilizing the generated voltage of 3.3V at the output of the NCP1402 using an LDO stabilizer that has low power consumption at idle state, as the MCP1801T-1802 [20], as shown in fig. 3.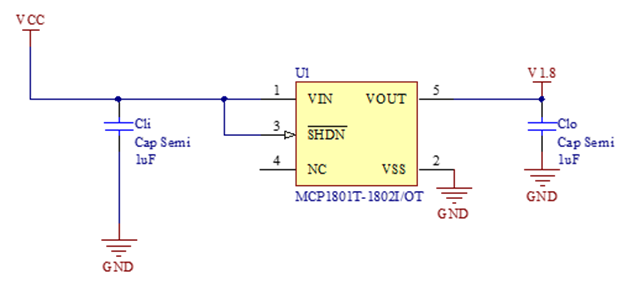 | Figure 3. Power supply NCP 1402 circuit at 3.3 V [20] |
After fulfilling the power supply requirements, we must determine the method of wireless data transmission, as captured by MAX30100 sensor [19]. The proposed way to do is based on the physical (PHY) layer and the medium control layer (MAC) of the IEEE 802.15.4 standard [15] [16], in integration with a customized and lightweight ZigBee protocol version [12] [13]. The selected hardware to enable this type of wireless communication for our system is the circuit CC2538 [17], which incorporates a wireless communication transceiver, based on the IEEE 802.15.4 standard, together with a very powerful ARM Cortex - MMH 32 microcontroller, clocked at 32MHz. This integrated circuit operates with few connected passive components externally and immediately activates a wireless transceiver to transmit packets, as dictated by the IEEE 802.15.4 standard. It also allows programming to be applied at the same chip due to its built - in microcontroller. Security functionality with 128 - bit AES encryption, authentication mechanism, signal quality control mechanism as well as data integrity mechanisms are integrated within the circuitry. As a result, the firmware is light enough to be loaded on the microcontroller. The driver of the transceiver as well as the driver of MAX30100 will be assembled by the firmware that loads inside the internal memory of ARM Cortex - M3. Technically, the integrated circuit MAX30100 requires 2 communication lines based on the Philips I2C standard. The ARM Cortex-M3 microcontroller integrated in CC2538 circuit has an I2C unit which can be properly adjusted to produce the signals required to communicate with the integrated MAX30100 circuit.The integrated circuit CC2538[17] significantly reduces the size of the printed circuit board, as it integrates the microcontroller and transceiver into a single chip requiring only a few passive external components to operate. The integrated MAX30100 circuit also has a very small size and by placing it in the bottom layer of the printed circuit board, the final printed circuit is less than 2x2cm in size. In fig. 4 we depict the schematic circuitry diagram of cc2538 and MAX30100 sensor connections.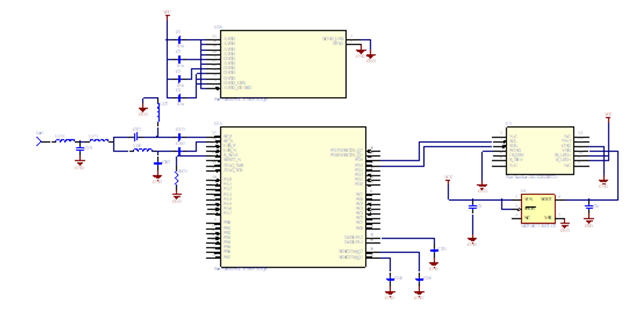 | Figure 4. Schematic circuitry diagram of cc2538 and MAX30100 connection |
The PCB board, as depicted in fig. 5, should be fitted including the battery in a shield, to easily be attached to the human earlobe, so that does not disrupt the person from wearing it. In fig. 6 we depict our proposed sensor earing, the housing of which is made of light rubber and soft plastic cover. According to fig. 6, inside the shielding we place MAX30100 sensor, while the rest of the circuit is in a form of a latch to be easily attached on the human earlobe.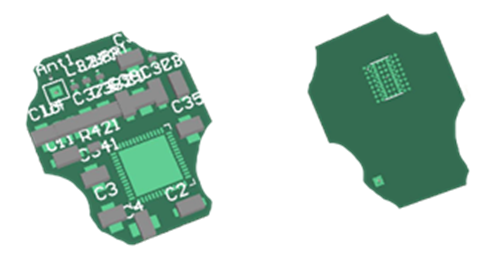 | Figure 5. PCB of the proposed system with small footprint for both sizes |
 | Figure 6. Proposed shielding for our circuit board |
3.2. Customized Wireless ZigBee Protocol
The sensors used in our system, require a communication protocol for remote measurement control and signals acquisition, in an experimental stress measurement testbed process. Our system aims to improve the measurement process by facilitating the placement, measurement and data processing from various individuals. This process requires a flexible communication method that can serve the need for remote transmission of two or more nodes simultaneously, in a secure and reliable manner. The use of the integrated transceiver in cc2538 activates a large set of capabilities in wireless communication between the nodes that will take art in the wireless communication network using the physical layer and medium access control layer (MAC) specified by IEEE 802.15.4. Thus, in this work, we propose a customized communication protocol version, that will use the PHY and MAC layer of 802.15.4, which is the lower levels of ZigBee. In fig. 7, we depict our custom protocol stack design.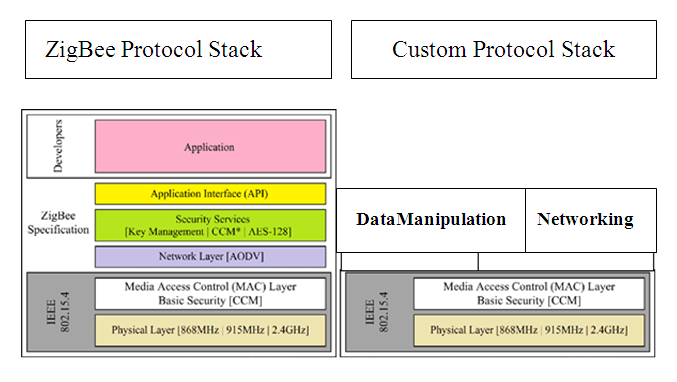 | Figure 7. Custom protocol stack (right) as compared to 802.15.4 stack (left) |
According to [15] [16], IEEE 802.15.4 protocol functions are related to the first two layers, i.e. the physical layer and the data link layer. The upper layers, i.e. the network, the security and the application layers, use mechanisms related to data routing, communication reliability and maintenance, nodes control and data integrity. It is therefore obvious that relying to all layers functionalities increase the complexity level of the communication system and its firmware, and thus makes it inappropriate for time critical biosignals applications. The upper layers of the ZigBee protocol stack, such as network layer, security layer and application layer, use data routing mechanisms, maintaining the communication between nodes, controlling the status of each node, controlling data integrity and security and more generally uses mechanisms that meet the networking and communication needs of a large set of applications. All these layers and their mechanisms give a high degree of complexity in the firmware implementation that enables the measurement and transmission of data to a central node. The most important layers for achieving a two-way wireless communication, with the ability to identify nodes (use addresses), security and integrity in the physical transfer of measurable data, are the first two layers defined by standard IEEE 802.15.4 and are integrated into the transceiver. Therefore, from all the above layers of the ZigBee protocol, for the purposes of the proposed measurement system, we designed a simplified network layer with a connection and disconnection management mechanism of a node in the network using a bind table for each node. At the same layer, we have implemented a measured data management mechanism, whose function is the preparation of measurement data in packets to be sent from the lower of MAC and PHY layers. The proposed communication protocol defines two types of devices, which are a coordinator and one or more measuring devices, called signal measurements sensor nodes. The coordinator is a device node, responsible for setting and controlling the wireless communication network, which facilitates the sensor nodes’ connection to it. A unique PAN – ID network address characterizes the network. The coordinator selects the ID. To this end, all nodes are connected and controlled to the network via the controller. The protocol defines the following communication processes:1. Network Establishment process: In this process, the coordinator establishes a new connection, using an available wireless channel, and defined a unique PAN-ID network address. As soon as this process is completed, all other nodes are connected to the network.2. Node Connection process: This process is performed between a sensor node and a coordinator that has established a network with a specific PANID. When a sensor node is activated, it checks its internal memory for connection information to a network. If there is no connection information, it sends an Association Request packet. Any coordinator node that receives this packet, informs the upper layers regarding the nodes’ network connection and waits for a response to accept or reject the new node. If the connection is successful, the coordinator sends back a packet containing connection information, stored in its internal memory. When the process terminates, the new node is part of the network. The newly connected node has a unique 16 – bit address that uses during its packet transmissions. 3. Action Request process: a sensor node performs this process, at regular intervals. The node sends the coordinator a request to ask if there is any action assigned to the node. Sensor nodes periodically fall in sleeping mode and turn off their transceivers, in order to significantly reduce energy consumption. This means that the transceiver is not always active to receive all data packets sent by the coordinator. Thus, to ensure no packet loss while keeping low power consumption, sensor nodes activate their transceiver for a predetermined time of a few ms and send an action request packet to ask the coordinator regarding any pending action to be performed. 4. Disconnection Request process: Through this process, the coordinator decides which node remains network – active and which gets disconnected. For this reason, the coordinator sends a Disassociation Notification packet to the node that is going to be disconnected and removed from the network. As soon as the sensor node receives this packet, it erases the network information connection from its memory, and is considered as an unknown node to the network. 5. Node’s State Information process: During this process, the coordinator, sends a Network State Request packet to all network nodes. As soon as the nodes receive this packet, they take turns and send a request for transmission (i.e. action request packet). Afterwards, each node that has information to send, prepares and sends a packet including its battery status and data measurements.During the node connection process, when the coordinator receives an Association Request from a node, it processes the request and produces a unique 16 – bit address, which is attached to an Association Response packet. The network coordinator chooses a fixed 16 – bit address like 0x0000. The nodes’ address values are as follows: 0x0001, 0x0002, etc. The last value if 0xFFFD (in total 65535 addresses). The coordinator is responsible for assigning each node with a unique address and avoid a potential address value conflict, during new network associations. Except the aforementioned short fixed hex value addresses, each node is also associated with a unique MAC address. Additionally, each node also maintains, in its memory, a connection table. The connection table shows information regarding the associated nodes with the coordinator. In particular, the table maintains tuples regarding the 64 – bit hex coordinator’s address and the short 16 – bit address values. To this end, each node’s table contains one tuple (i.e. its connection with the coordinator). On the contrary, the coordinator’s table contain as many tuples as the number of connected network nodes.In fig. 8, we depict the system’s overview, in terms of connected nodes and their associations with the coordinator. The network connection follows a Star connection pattern, where there is a one to one association of each node with the coordinator. In this testbed we observe four (4) connected humans (i.e. person 1, person 2, person3, person4). Each person has attached a sensor to his earlobe, which transmits stress – related biosignals, as soon as it gets associated with the network’s coordinator.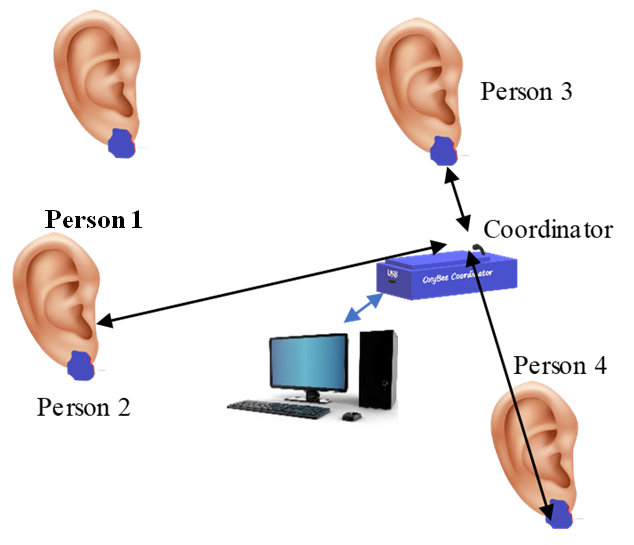 | Figure 8. WSN network star topology of our proposed system |
3.3. Biosignals Acquisition and Processing
LabVIEW interface contains a set of virtual programming tools that helps users to easily program applications that receive data from an external environment [22], as in the case of our proposed biosignals deployment, as depicted in fig. 8. Additionally, LabVIEW, uses NI VISA drivers[X] to provide an interface with the external environment via the computer’s COM serial communications port using RS – 232 protocol. The software components, and their interconnections, as used according to our design, is depicted in fig. 9.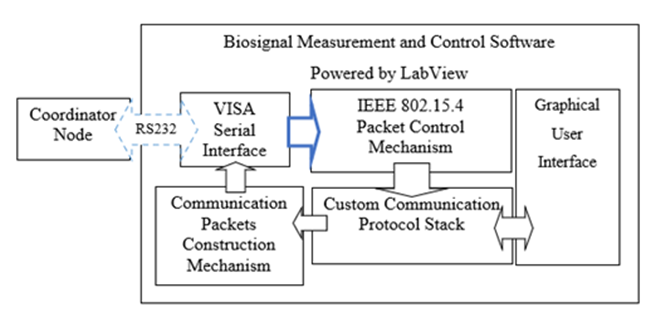 | Figure 9. Structural design of biosignals measurement system |
Using LabVIEW’s front panel, we have a graphical way, via which we can easily tune our system’s settings, and control the measurement and evaluation process [22]. The data coming from the coordinator node, correspond to the communication packets of our proposed lightweight protocol, have hexadecimal values due to their formatting process conducted by the coordinator’s software. For this reason, our software apply decoding processes, which identifies the packet types and categorizes them. This packet communication decoding mechanism, checks if there exists data on the serial interface, coming from the coordinator, and depending on the length of the data inside the register’s reception port, decodes properly all incoming packets to ZigBee – compliant packets. By using a signal measurement node and properly placing it on a patient, we connect this node to the network coordinator and it appears in the Associated Nodes table in the graphical interface environment. Each node can be used to jointly measure patients’ oxygen levels and heart rate, simply by performing one of the available commands in the user interface environment or using the interface environment to schedule periodic measurements patients, during day intervals. Our system also supports data storage for a certain period of time, in case of further off – line processing.Using LabVIEW’s environment capabilities, we can collect the signals and store them for further processing. We can also apply one of the most popular IoT platforms and data communication protocols [3] (i.e. MQTT, CoAP, AMQP, WebSocket, Node) and open a web portal, from which the medical staff and researchers from anywhere, could monitor the patients’ data, analyze them and draw conclusions regarding their health status. In our proposed system, we design a proper mechanism for collecting and transferring our data to the ThingSpeak [18] IoT platform, which enables us to create channels that can accommodate eight value fields each. In fig. 10, we depict a snapshot of the patients’ channels in LabVIEW control panel tool. ThinkSpeak, enables us to create channels that can accommodate 8 value fields each. The proposed system can support the recording of stress levels for 4 distinct persons, one per communication channel. We have created the stress levels A channel in which we count oxygen and heart rate. The IoT platform update mechanism uses API Requests to record data extracted during the process of creating a channel.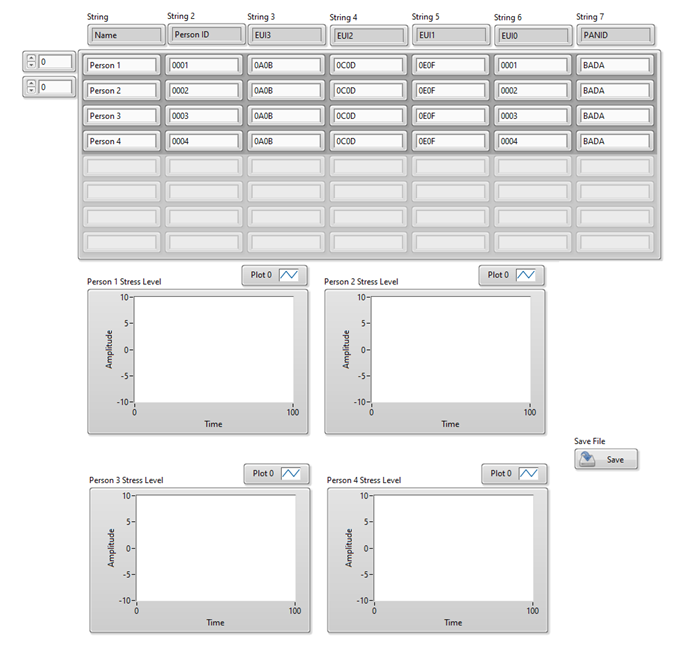 | Figure 10. Snapshot of LabVIEW control panel software tool |
In fig. 11, we depict a command snapshot regarding the connection of LabVIEW data collection environment with Thing Speak IoT platform. To this end, through specific API connections [7] [18], biosignals reach Thing Speak platform.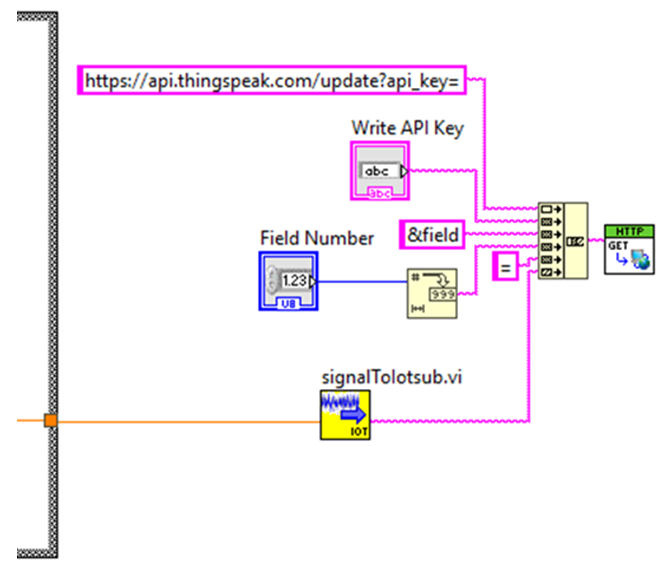 | Figure 11. API requests for LabVIEW stream connection |
For each patient’s, the data samples arriving at the coordinator, is recorded in the central control system and fed into the IoT platform, each measured data per channel. Each communication channel can support up to four different patients. Each patients’ finger device has a unique address within the wireless network. Therefore, it seems like assigning a specific unique ID number to each patient for monitoring purposes. In this way, it is possible the IoT platform user to distinguish which channel field corresponds to which monitored patient. In the following fig. 12, we depict a snapshot of the stress signals as acquired by our testbed system for 4 persons.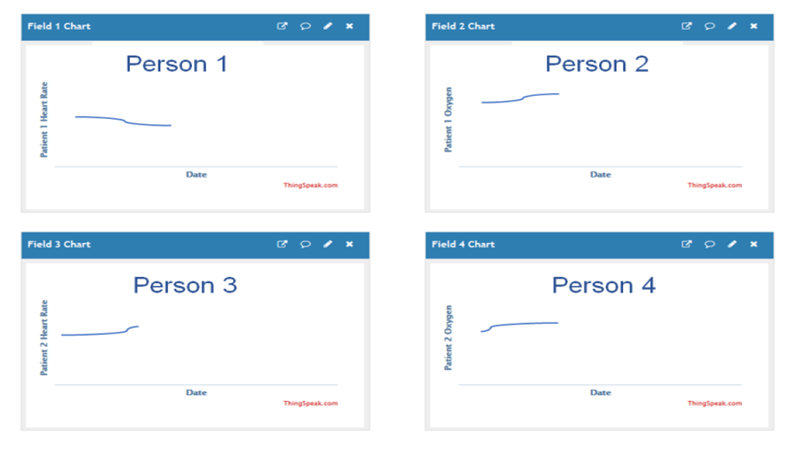 | Figure 12. Think Speak user interface for monitoring stress signals |
3.4. System Usability and Advantages
Our proposed system uses low – power electronic components, which allow the circuitry to operate with a single AAA battery or with any battery with a voltage range from 0.8V up to 3V. In case of idle state, the microcontroller sets the most energy - hungry internal components, such as amplification and filtering circuits, in a low – power state. According to our proposed lightweight protocol version of ZigBee, each node transits to low power consumption state and activates its transceiver only at regular intervals or when new data needs to be transmitted. At idle state, each node consumes approximately less than 50μΑ. The stack of the proposed protocol takes advantage of the built – in PHY and MAC layers of IEEE 802.15.4 to significantly reduce the firmware code that will be loaded on the controller unit. The firmware programming is mainly based on the transmitter’s driver commands and a state machine related to sending and receiving packets, according to the rules imposed by the protocol. As a result, the firmware takes up a small amount of memory in the microcontroller unit, allowing 8-bit microcontrollers to be selected with a small memory capacity, significantly reducing construction costs.The processing power requirements of our system, which includes biosignal measurement nodes and the coordinator, are in total low, since each node is used only to take measurements and sends them to the coordinator in a one hop fashion. Additionally, the coordinator acts as a broker between the nodes and the control software. To this end, except from the processes of node associations and node monitoring, in terms of network connections, does nothing else. Our system’s capacity in terms of node connections could reach the theoretical upper limit, as specified by the IEEE 802.15.4, which is 65.535 nodes. This enable the potential to measure a vast number of biosignals, probably inside or outside medical facilities. As far as LabVIEW control software is concerned, it is easily modifiable, if necessary, to meet user needs via serial commands, which pass towards the coordinator. Following, according to our software design, we provide the developer with simple serial commands, containing the address of the node to reach and focus on a specific plant. In other words, the user of our software could intervene to a specific node, as long as the node’s address is within the coordinator’s association table. If so, the coordinator sends a message informing the user of the status of the node and prompts the user to wake the node up to perform a measurement. The data we collect can be stored to memory slots or a database or to be exported to spreadsheets for further analysis. We chose LabVIEW programming environment for control and data processing because of its rich processing tools for biosignals.Finally, our system is easily adjustable to several types of biosignals measurements, by simply tuning the amplification and filtering levels of each sensor node. By converting the circuit or bypassing the sensor output connection a the microcontrollers ADC converter unit, we can append several new sensors to each node, only by slightly modifying the firmware. The LabVIEW programming environment is recommended for aggregating, filter and visually presenting biosignals, due to its large set of functions for processing and storing datasets. We plan to extend our testbed into a mobile environment set, where the coordinator is a doctor and the patients wear earlobe pervasive sensors.
4. Conclusions
In this work, we design, test and propose a lightweight wireless sensor network for capturing and transmitting stress level biosignals to a central controller node. Our system focuses on medical application, estimating levels of stress and raise alerts in case of abnormal conditions. For the data processing and visual representation, we use LabVIEW software tool. In terms of networking communications, the sensor nodes connect with the network coordinator in a one – hop fashion, forming a star topology network. Each node uses a uniquely distinguishable address, which is a hexadecimal values and a MAC address. In this work we demonstrated a 4 sensor testbed. However, the design of the system and communication protocol, makes it more scalable. According to our systems design, deployment and functionality, there is a significant reduction in the length of the firmware code, to be loaded to the microcontroller’s unit, combined with the ability to select 8 – bit low memory and low power microcontrollers. This makes the system energy efficient and extends its lifetime. Finally, as a future work, we plan to extend our testbed’s functionality to support mobile network topologies, in which the coordinator is the doctor and the patients’ are the mobile nodes, wearing earlobe pervasive sensors.
References
| [1] | H. Thapliyal, V. Khalus, and C. Labrado, Stress Detection and Management: A Survey of Wearable Smart Health Devices, IEEE Consumer Electronics Magazine, vol. 6, no. 4, pp. 64–69, Oct 2017. |
| [2] | P. Sundaravadivel, E. Kougianos, S. P. Mohanty, M. K. Ganapathiraju, Everything You Wanted to Know about Smart Health Care: Evaluating the Different Technologies and Components of the Internet of Things for Better Health, IEEE Consumer Electronics Magazine, vol. 7, no. 1, pp. 18–28, Jan. 2018. |
| [3] | S. P. Mohanty, Everything You Wanted to Know about Internet of Things (IoT), IEEE Distinguished Lecture, IEEE CE Society, Nov. 2017. |
| [4] | L. Rachakonda, P. Sundaravadivel, S. Mohanty, E. Kougianos and M. Ganapathiraju, A Smart Sensor in the IoMT for Stress Level Detection, in IEEE Int. Symp. on Smart Electronic Systems (iSES), doi: 10.1109/iSES.2018.00039, Dec.2018. |
| [5] | K. Nakagawa, H. Kawamoto and Y. Sankai, Integrated Non-invasive Vital Signs Monitoring System for Detecting Stress, in 57th Annual Conf. on the Society of Instrument and Control Engineergs (SICE), doi: 10.23919/SICE.2018.8492614, Sept. 2018. |
| [6] | C. Setz, B. Arnrich, J Schumn, R. Marca, G. Troster and U. Ehlert, Discriminating Stress From Cognitive Load Using a Wearable EDA Device, in IEEE Trans. on Inf. Technology in Biomedicine, vol. 14, issue. 2, doi: 10.1109/TITB.2009.2036164, Mar. 2010. |
| [7] | P. Sundaravadivel, S. P. Mohanty, E. Kougianos, and U. Albalawi, “An Energy Efficient Sensor for Thyroid Monitoring through IoT,” in Proc. of the 17th International Conference on Thermal, Mechanical and Multi-Physics Simulation and Experiments in Microelectronics and Microsystems (EuroSimE), 2016, pp. 1–4. |
| [8] | J. Choi and R. Gutierrez-Osuna, “Using Heart Rate Monitors to Detect Mental Stress,” in Proceedings of Sixth International Workshop on Wearable and Implantable Body Sensor Networks, 2009, pp. 219–223. |
| [9] | B. M. G. Rosa and G. Z. Yang, “Smart Wireless Headphone for Cardiovascular and Stress Monitoring,” in Proceedings of IEEE 14th International Conference on Wearable and Implantable Body Sensor Networks (BSN), 2017, pp. 75–78. |
| [10] | Stress is killing you. [Online]. Available: http://www.stress.org/stress-is-killing-you/, Accessed on: Sep. 17, 2016. |
| [11] | K.H. Kim, S.W. Bang, and S.R. Kim, Emotion recognition system using short-term monitoring of physiological signals, Medical & Biological engineering & Computing J., vol. 42, pp. 419-427, 2004. |
| [12] | K. Takahashi, “Remarks on Emotion Recognition from Bio-Potential Signals”, in Proc. of the 2nd International Conference on Autonomous Robots and Agents, Palmerson North (New Zealand), December 2004. |
| [13] | J. Zhai, A.B. Barreto, C. Chin, and C. Li, Realization of Stress Detection using Psychophysiological Signals for Improvement of Human-Computer Interactions, in Proc. of the IEEE Southeast Conference, pp. 415-420, Aprill 2005. |
| [14] | Pulse Oximeter and Heart-Rate Sensor IC for Wearable Health. (2014). Retrieved from https://datasheets.maximintegrated.com/en/ds/MAX30100.pdf. |
| [15] | IEEE Std 802.15.4-2006, “Part 15.4: Wireless Medium Access Control (MAC) and Physical Layer (PHY) Specifi-cations for Low-Rate Wireless Personal Area Networks(LR-WPANs),” 2006. |
| [16] | IEEE Std 802.15.4a-2007, “Amendment to 802.15.4-2006: Wireless Medium Access Control (MAC) and Physical Layer (PHY) Specifications for Low-Rate Wire-less Personal Area Networks (LR-WPANs),” 2007. |
| [17] | CC2538 Powerful Wireless Microcontroller System-On-Chipfor 2.4-GHz IEEE 802.15.4, 6LoWPAN, and ZigBee® Applications. (2015, April). Retrieved from https://www.ti.com/product/CC2538. |
| [18] | ThinkSpeak IoT platform, available at: https://thingspeak.com/. |
| [19] | MAX30100, available at: https://www.alldatasheet.com/datasheet-pdf/pdf/879178/MAXIM/MAX30100.html. |
| [20] | NCP1402 Data Sheet, available at: http://suo.im/6subhB. |

 Abstract
 Reference
 Full-Text PDF
 Full-text HTML