-
Paper Information
- Paper Submission
-
Journal Information
- About This Journal
- Editorial Board
- Current Issue
- Archive
- Author Guidelines
- Contact Us
Journal of Wireless Networking and Communications
p-ISSN: 2167-7328 e-ISSN: 2167-7336
2017; 7(1): 9-20
doi:10.5923/j.jwnc.20170701.02

PL-UDMS: A Wireless Sensor Network System for Monitoring of Urban Drainage in Mauritius
 Abstract
 Reference
 Full-Text PDF
 Full-text HTML
Bujun Heerish1, Khedo Kavi1, Proag Virendra2
1Computer Science & Engineering, University of Mauritius, Reduit, Mauritius
2Civil Engineering, University of Mauritius, Reduit, Mauritius
Correspondence to: Bujun Heerish, Computer Science & Engineering, University of Mauritius, Reduit, Mauritius.
| Email: |  |
Copyright © 2017 Scientific & Academic Publishing. All Rights Reserved.
This work is licensed under the Creative Commons Attribution International License (CC BY).
http://creativecommons.org/licenses/by/4.0/

Mauritius has recently been experiencing drastic climatic changes. During high rainfall, the drainage system in the urban regions is not able to evacuate the incoming water. Wireless sensor network comprising of numerous interconnected wireless sensor nodes captures real-time data from the environment and transmit these data to a base station for analysis and actions. Using wireless sensor nodes, the level of water in the drains and difference in water-flow between two points in the drainage system can be captured and monitored. Events of urban drainage overflow and drainage obstruction can thus be predicted. In this paper a cluster-based wireless sensor network system for monitoring urban drainage is proposed. Real-time data collected from wireless sensor network are used by a prediction model to detect overflow and give alarms before occurrence of chaotic situations. The system also consists of a monitoring application allowing the visualization of the conditions of the drainage system. Results for three rainfall episodes are provided and discussed in this paper.
Keywords: Wireless sensor network, Cluster based, Real-time data, Water level monitoring, Obstruction detection
Cite this paper: Bujun Heerish, Khedo Kavi, Proag Virendra, PL-UDMS: A Wireless Sensor Network System for Monitoring of Urban Drainage in Mauritius, Journal of Wireless Networking and Communications, Vol. 7 No. 1, 2017, pp. 9-20. doi: 10.5923/j.jwnc.20170701.02.
Article Outline
1. Introduction
- Wireless sensors have the capacity to measure, compute and communicate environmental data to other systems where they can be interpreted into meaningful information [1]. Wireless sensor network consists of a series of sensor nodes. They collect data and send the latter to a base station where the gathered data are analysed, processed and stored. Nowadays, wireless sensors have on board sensing, processing, communication and storage capabilities which help them to collect, analyse, correlate and fuse their own gathered data [2]. Figure 1 illustrates how wireless sensor nodes are connected to base stations and how data are transmitted over the internet.
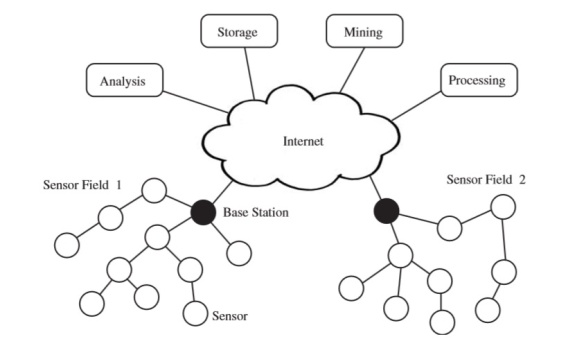 | Figure 1. Wireless Sensor Networks architecture |
2. Literature Review
- Wireless sensor networks are widely used to capture data from our external environments. These data help to monitor and predict environmental changes and take precautionary measure in case of forthcoming disasters like floods, tsunamis and earthquakes. The miniature size of wireless sensors enables to observe variations in pressure, light, vibration, inclination and sound at practically inaccessible places. With the advancement in microchips and battery storage capacities, wireless sensor nodes have the capability to communicate, process, and store a relatively large amount of information. Data gathered by nearby sensors within a cluster are sent to a cluster-head for aggregation. This activity decreases high volume of transmission over the network and also decreases the energy consumption of the sensor nodes. Wireless sensor nodes can communicate via local area networks or even through the internet. Several systems use the same technique for data monitoring of the physical environment. In this section, a literature of drainage water flow models and existing wireless sensor networks for drainage and flood monitoring is carried out.
2.1. Drainage Waterflow Models
- There are numerous waterflow models that are used for calculating the peak discharge. By determining the peak water discharge in a region, the drainage size and design will be made to match the need. The section below mainly discusses about the Rational Method and the Saint-Venant method, two popular waterflow models that are used in Mauritius.
2.1.1. The Rational Method
- The Rational method is used to calculate the total flow of water that can be collected in a catchment. The calculation for the average rainfall intensity, used in the Rational method, is determined based on historical data analysis of the rainfall intensity during the past years. The formula of the Rational method, for calculating the peak discharge is as follows:
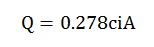 | Figure 2. Formula for calculating the peak discharge [5] |
2.1.2. The Saint Venant Equation
- The Saint-Venant equation is used to model the flow of water in an open canal in sewer pipes. The equation is based on physical principles of mass conservation of energy [6]. For calculation, the equation is simplified by decomposing the sewer network into several virtual and real tanks. The formula is as shown below.
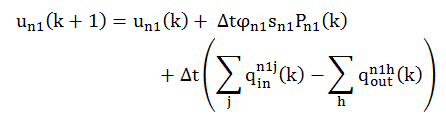 | Figure 3. Saint-Venant equation [6] |
2.2. Wireless Sensor Network Systems for Urban Drainage and Flood Monitoring
- There are numerous systems that have been designed to monitor the external environment using wireless sensor network. These systems are mainly used to monitor and detect overflow in urban drainages, pipelines and rivers. The identified systems are discussed in the sub-sections below.
2.2.1. Design and Optimisation of Monitoring Networks in Urban Drainage
- Henckens and Clemens [7] proposed a drainage monitoring system in the Beekbergen catchment in Netherlands. The main aim is to forecast unexpected flood. These situations are not foreseen due to the inefficient forecasting giving inaccurate results in the real time situations [7]. The solution is to calibrate a hydrodynamic model by gathering a high volume of real time data for the Beekbergen catchment (combined sewer system). The sewer system of Beekbergen is shown in Figure 4 below.
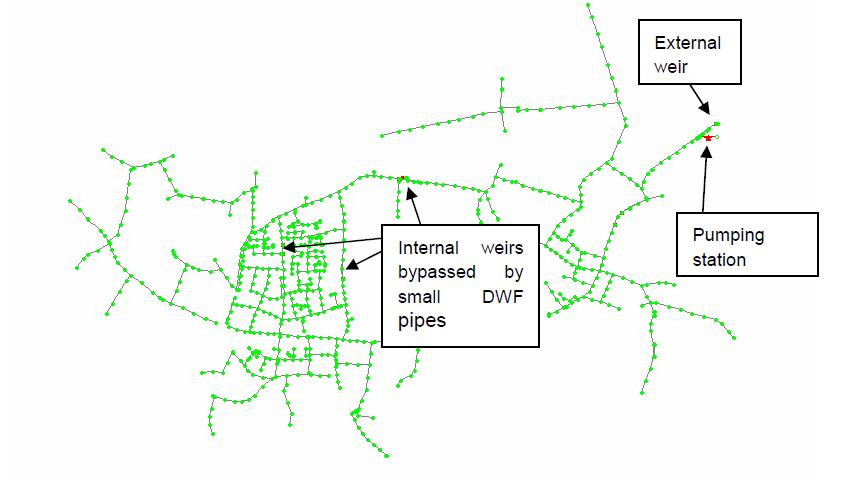 | Figure 4. Beekergen sewer system [7] |
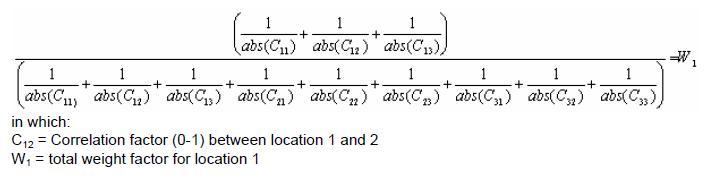 | Figure 5. Decorrelation method [7] |
2.2.2. A Framework Web-GIS for Urban Drainage Monitoring System
- Nowadays internet and Web-GIS (Geographical Information System) technology have been widely spread. The aim of the Web-GIS system proposed by Yang et al. [8] is to offer an infrastructure for an urban drainage network integrated system based on Web-GIS and GPRS (General Packet Radio Service) technology. J2EE-EJB technology was used to construct an enterprise level system that is platform independent, offers network support security and provides a runtime environment and remote transactions [8]. The system uses a three layered architecture to provide numerous functionalities. They are namely dynamic format of hydraulic model, urban drainage network optimization design and planning, visual information management, dynamic state analysis and real time monitoring of an urban drainage system. Figure 6 below shows the system architecture design of the three layered architecture.
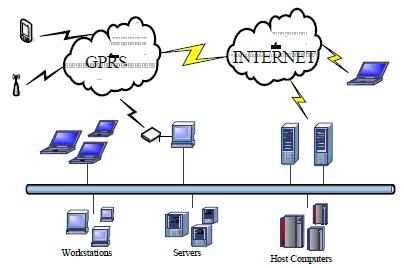 | Figure 6. System Architecture Design for a three layer system architecture [8] |
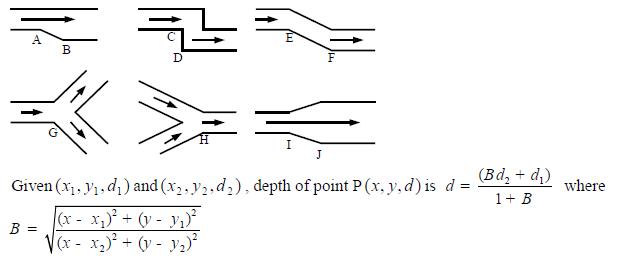 | Figure 7. Type of node and formula for depth of pipeline segment [8] |
2.2.3. Using Wireless Sensor Networks in the Sensor Web for Flood Monitoring in Brazil
- Flood causes significant damage to people and infrastructure. The city of São Paulo, situated in Brazil has lately been visited by numerous floods that caused loss of lives, infrastructural damages and propagated waterborne diseases. Degrossi et al., [9], proposed a geospatial software platform that helps to predict rise of water at any point in time. Interoperability was a functionality that they wanted to implement in the system. Hence they adopted the Sensor Web Enablement standard [10]. The system was built using open source code distributed under the GNU license (General public license), making it easily adaptable. PostgreSQL data management system and PostGIS geographical database were used for the data server.The aggregated data already present at the database are accessed via web service [9]. Some characteristics of the system built are robustness, interoperability and scalability. For the monitoring of flood in São Paulo, an application is built using the GeoExt API (Application Program Interface). The database already stores information retrieved from the wireless sensor network such as water gauge level, level of pollution and turbidity, and other related information from the sensors. It also contains data about the limitations of watersheds and the source and trajectory of the river. Once the data is recorded, it is accessed from the web service and populated on the API. A screenshot of the prototype interface is shown in Figure 8.
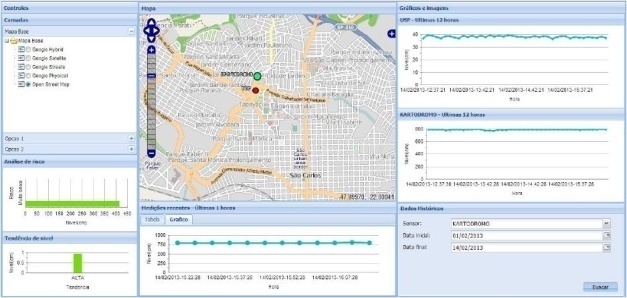 | Figure 8. Prototyping interface of the system [9] |
2.2.4. SWATS: Wireless Sensor Networks for Streamflood and Waterflood Pipeline Monitoring
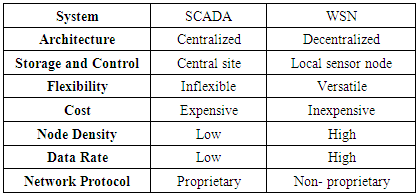
- The Supervisory Control And Data Acquisition (SCADA) system was previously being used for pipeline monitoring. Concerns of not satisfying the expected criteria, namely acceptable expenses, flexibility, interoperability and fast data result gave rise of finding another means for the monitoring of the oil fields by the United States. Wireless sensor network was considered to be a possible solution in regions of high temperatures and where dangerous chemicals are usually present. The SWATS system [11] was designed based on wireless sensor networks resulting in a low cost solution, giving results in short delay, and providing coverage with fine granularity. Furthermore with the new SWATS system, leakages, blockages, outside damages, and generator and splitigator malfunctioning can be detected by using data correlations. The SWATS system was deployed using the IEEE 802.11 mesh network standard with a long range and a high speed communication between the nodes (forming clusters) and the control room [11]. The proposed wireless network architecture is shown in Figure 9.
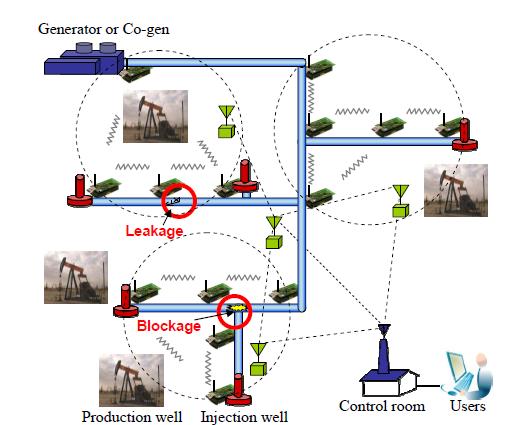 | Figure 9. Proposed SWATS architecture of steam distribution system and monitoring using WSN [11] |
|
3. Problem Analysis
- Mauritius is an island with a surface area of 1860 km2, situated in the Indian Ocean [12]. Mauritius is a developing country which has a well diversified economy. Port Louis, the capital of the island, is the pivot for all economic activities. With the climatic changes on the island, Port Louis has been experiencing regular high rate of rainfalls which have resulted in frequent flood situations.
3.1. Flash Flood 2013
- On 30th of March 2013, Port Louis experienced a major flood where there were massive infrastructural damages and loss of human lives [13]. The drainage system of Port Louis was not able to evacuate the incoming water which was due to a high rate of rainfall in that region. A total of 140.8 mm of rainfall was recorded within a duration of 4 hours. The increasing water level in the drains could not be observed due to lack of monitoring of the drainage system. In such situations, an early warning could have helped to take timely decisions to evacuate the inhabitants. Figure 10 shows the situation of Port Louis after the flash flood.
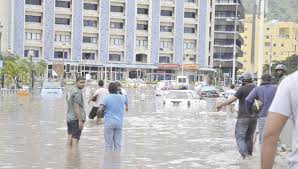 | Figure 10. Flash flood of 30th March 2013 |
3.2. Drainage System in Mauritius
- Drainage systems are used to evacuate excess water from precipitation which can cause flood and damage to buildings and other infrastructure in the region. The constructions of drains in Mauritius started long ago, during the early 1900s, but several drains (e.g. Le Pouce stream) dated from the French period in the 18th century [14]. The only few drainage and paved gutters at that time were not regularly maintained. Drainage systems in Mauritius are mainly in the form of pavement drainage and open outlets. Figure 11 gives an overview of the drainage system in Mauritius.
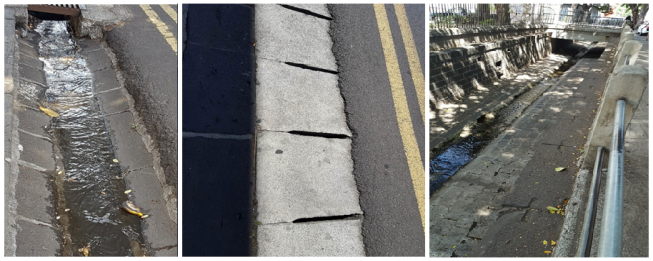 | Figure 11. Drainage system in Mauritius |
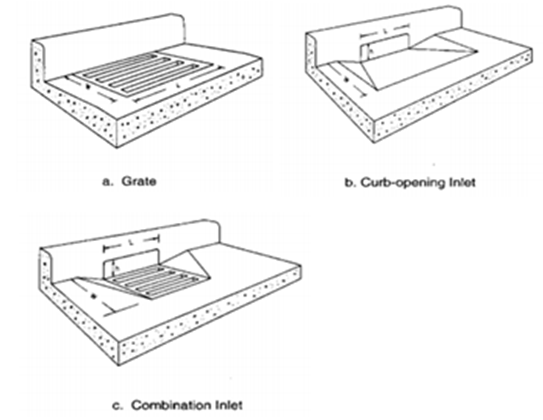 | Figure 12. Design of grate inlet, curb-opening inlet and combination inlet [15] |
4. Proposed WSN System for Urban Drainage Monitoring
- This section describes the design architecture of the proposed urban drainage monitoring system using wireless sensor network for the city of Port-Louis. Detailed implementation of the interaction between the sensors, the database, the front end system, and routing protocol used are discussed below.
4.1. Monitoring Area
- Port-Louis, the capital city of Mauritius, is found in the north-west part of the Mauritius Island and has an area of 42.7 km2 [16]. Port-Louis has an estimated population of 127,855 and consists of a harbour, a huge market, a high number of administrative and commercial buildings, making it the centre of economy with a heavy and congested traffic in its daily routine. The west side of Port-Louis is surrounded by the sea while the Port-Louis mountain range is on the east side, which protects the city from strong winds. The Port-Louis mountain range consists of a series of mountains with Le Pouce being the highest elevation of 812 m. The Figure below shows the region of Port-Louis highlighted in green and the topography of the capital.
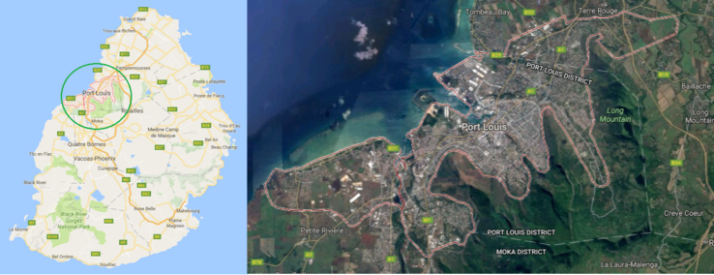 | Figure 13. Region of Port-Louis |
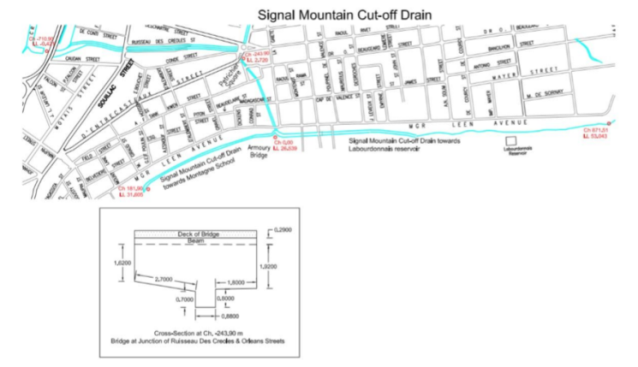 | Figure 14. Part of the drainage system of Port-Louis |
4.2. High Level Architecture of the Urban Drainage Monitoring System
- With the instant climate change occurring at specific locations, a real time system will enable the monitoring of urban drainage. Real time information such as water level and difference in water-flow inside the drains will be captured and sent within milliseconds to the base station. The gathered data will then be analysed for determining overflow situations or obstruction in the drains. Hence there is a need of an urban drainage monitoring system which consists of numerous sensor nodes that are dissipated in the urban drainage of Port-Louis. The sensor nodes are placed at strategic locations such that the detailed status of the urban drainage can be observed. Data captured by sensor nodes are sent to a base station. From there, the data is combined and sent to a server which is connected to the monitoring system. Computation of the gathered data is sent to the front end where the results are displayed. Figure 15 shows the component diagram of the proposed urban drainage monitoring system.
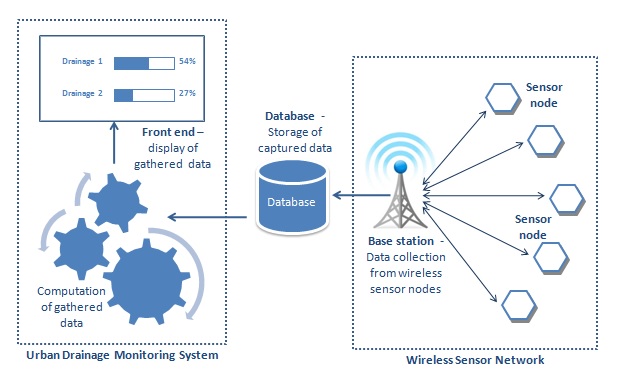 | Figure 15. Component diagram for urban drainage monitoring system Region of Port-Louis |
4.3. Topology Selection of the Urban Drainage System
- Drainage system in urban regions, such as in the city of Port-Louis, consists of multiple sections that are connected together. The area to be monitored is relatively large and the wireless sensor network lifespan is an important factor to consider in the proposed system. There are numerous topologies such as chain based topology, tree based topology and hybrid topology that can be implemented. The cluster topology is selected because of the following advantages:• Cluster based topology are scalable.• Even after loss of nodes, the network of the cluster topology can be reorganized.• Cluster based topology caters for load balancing.• Data aggregation helps to decrease the communication load between the sensor nodes.• Energy is conserved by efficient utilization of resources, hence also increasing the lifespan of the wireless sensor network.• Nodes can be added/ replaced and cluster can be reformed without switching off the whole system. Figure 16 shows how the sensor nodes will be transferring data to the server via the base station. The coloured circles represent the cluster head sensor node and the empty circles represent the normal nodes.
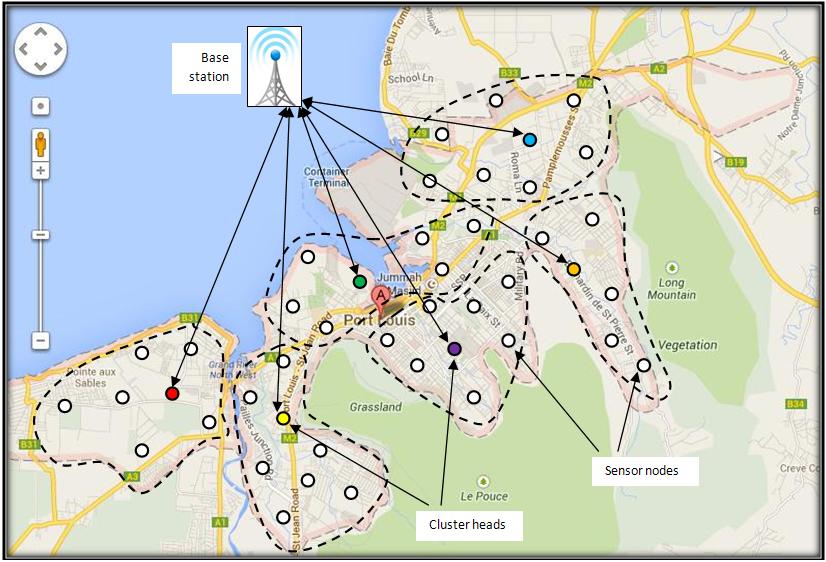 | Figure 16. Sensor nodes transferring data to server via base station |
4.4. Routing Protocols for the Urban Drainage Monitoring System
- There are numerous routing protocols that are compatible with the cluster based topology; namely single/multi hop protocols, LEACH (Low Energy Adaptive Cluster Hierarchy) protocol, HEED (Hybrid Energy Efficient Distributed) protocol and VGA (Virtual Grid Architecture) protocol. The LEACH protocol has been selected as it best fits the requirements of the proposed system. The latter has load balancing capabilities and yields high energy saving percentage thus increasing the lifespan of the wireless sensor network. To minimize energy consumption, it ensures that all nodes die, i.e. run out of energy, about the same time by extending the network lifetime and leaving very little energy left in the nodes when the network dies. It can also be configured so that nodes die at about the same time by rotating the role of the cluster head and selecting the cluster head based on residual energy.LEACH is broken into rounds with each round consisting of two phases: the setup phase and the steady state phase. The setup phase is when the nodes organise themselves into clusters [18]. A node decides to be a cluster head for that round independent of all other nodes in the network. The node will select a random number and if that number is less than the threshold value then the node will become a cluster head. The threshold value is based on the suggested percentage of cluster heads for that round (determined a priori), the number of times the node has been a cluster head. The cluster head will broadcast an advertisement message indicating it is a cluster head. A non cluster head node will join the cluster from which it received the strongest advertised signal from the cluster head. The non-cluster head node will send a join request to the cluster head and will then join that cluster. The steady phase is the normal data collection and routing. Clusters members send the data to its cluster head. The cluster head will fuse all the data received from its member nodes and then transmit the message to the base station.A random selection is made for the cluster head at the start of a round. The algorithm selects from the pool of nodes the one that have energy level greater than average [19]. Each sensor node i generates a random number in the range 0 < random < 1. The random number generated is compared to the predefined threshold T(i). If random < T(i), then the node becomes the cluster head, else it remains a cluster member. For the next round for data transmission, a different node is selected as the cluster head on a rotation basis [18]. The cluster head aggregates, compress and transmits the data to the base station. Due to the rotation in cluster head selection, the energy consumption is more or less similar for each node. When not in use, the non-cluster head nodes are switched to sleep mode. TDMA (Time Division Multiple Access) is used for scheduling in LEACH protocol, which can result to long delays when the sensor network is relatively large. The algorithm used for cluster head selection in LEACH is as follows:
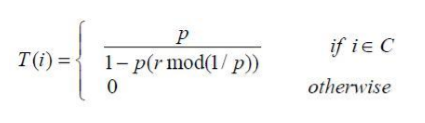 | Figure 17. LEACH algorithm for cluster head selection [19] |
 | Figure 18. L-LEACH algorithm for cluster head selection [19] |
4.5. Database Architecture of the Urban Drainage Monitoring System
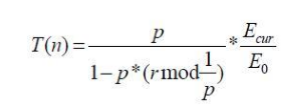
- A relational database is used for the storage of the gathered data. A table “DRAINAGE DIMENSIONS” stores the details of the drainage system, namely the width and height of the drainage at each section where the sensors are placed. It consists of 3 fields; RefPoint, Width and Height. The specific locations where the sensor nodes are placed are known as reference points (RefPoint). The table “WATER LEVEL AND WATERFLOW” stores the data captured by the sensor nodes such that the height of water in the drainage and water-flow at regular time intervals t at each reference point is known. This table also consists of 3 fields namely RefPoint, WaterLevel and WaterFlow. Overflow of drainage occurs mostly along the water carrier resulting in the overflow of a whole section. The third table “DRAINAGE REGION” categorizes all reference points in a specific region that are functionally linked such that during overflow, the whole section can be monitored. The table “DRAINAGE REGION” contains 2 fields namely Section and RefPoint. Given that a relational database is used, stored procedures are used for quick retrieval of data. Indexing and normalization are applied on the tables which improve the response time for querying the database and eliminate data redundancy. The database architecture is as shown below.
 | Figure 19. Database architecture |
4.6. Determination of Drainage Overflow
- Reference points are strategic locations where there is highest probability of overflow. Once the reference points are identified, the width and height of the drain at that specific location are recorded. Water level sensors are placed inside the drains and based on the rate of increase in the water level, overflow of the drains can be predicted. Moreover, sonar sensors are also placed outside the drains to detect water overflow. Water flow sensors are used to record the speed at which water is flowing at each reference point. The water-flow at each reference point can be calculated using the Manning’s equation [20]. The measure flow rate is compared to the calculated flow rate for the detection of obstruction in the drainage system. Moreover, the difference in water level at the reference point is calculated in order to determine the presence of an obstruction in a specific section of the drainage system. The formula for Manning’s equation is as follows:
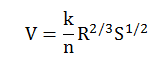 | Figure 20. Manning’s equation [20] |
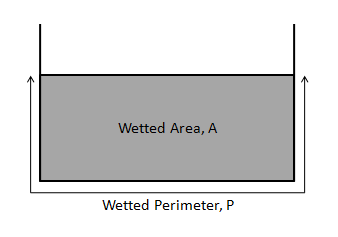 | Figure 21. Calculation of the hydraulic radius, R |
4.7. Implementation of the Drainage Monitoring System
- A monitoring application, namely PL-UDMS (Port-Louis Urban Drainage Monitoring System), is implemented in order to visualize the status of the drainage system in real-time. PL-UDMS displays the time period in hr, the rainfall intensity in mm and the water runoff in m3/s. The urban drainage monitoring application consists of a Main Menu tab, a Detailed Report tab and a Graphical Representation tab. Along with the display of real-time status of the drainage system of Port-Louis, the PL-UDMS application also allows the simulation of the drainage system for varying number of sensor nodes and varying rainfall intensity. The drainage overflow in the simulation is calculated using the formulae below. If peak discharge > capacity of drainage, then the drainage overflows. Formula for calculating the peak discharge:
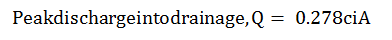 | Figure 22. Formula for peak discharge [5] |
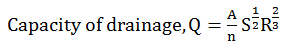 | Figure 23. Formula for calculating the drainage capacity [21] |
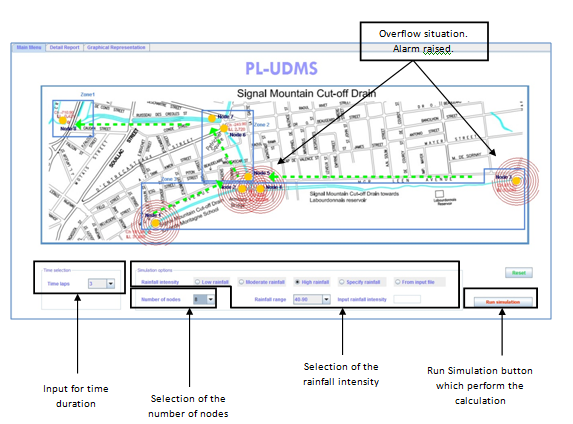 | Figure 24. Main Menu tab of PL-UDMS |
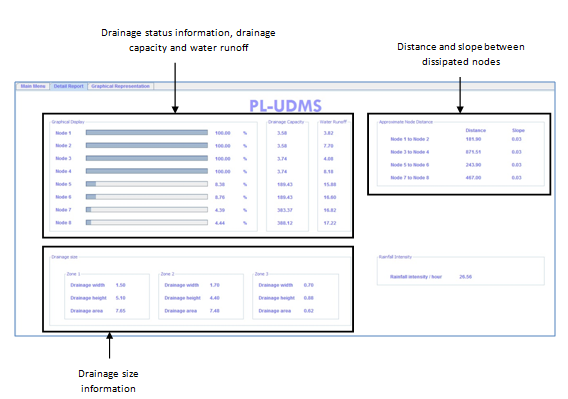 | Figure 25. Detailed Report tab of PL-UDMS |
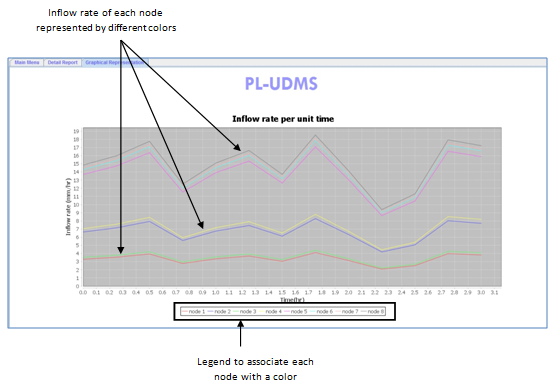 | Figure 26. Graphical Representation tab of PL-UDMS |
4.8. Workflow Diagram of the Urban Monitoring System
- Figure 27 illustrates the workflow diagram in the proposed drainage monitoring system. The water level and water flow is captured by each sensor node and transmitted to a server via a base station. The server stores all important data such as water level, water flow rate, drainage width, drainage height, distance between nodes and inclination of slope. These data will be fetched by the urban drainage monitoring application whenever the need for computation or for display of the real-time information on the screen. Meteorological data can also be added to the system to obtain realistic values of the precipitation rate in Port-Louis. The gathered data related to water level and water-flow in the drainage system is then analysed and an alarm is raised in case of drainage overflow or drainage obstruction detected.
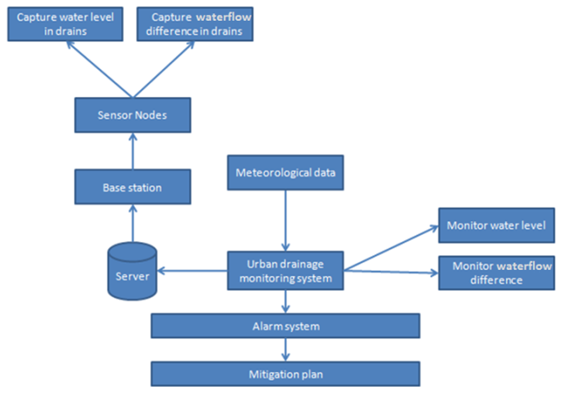 | Figure 27. Workflow diagram of the urban drainage monitoring system |
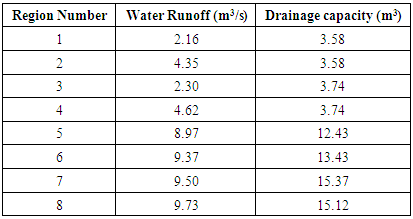
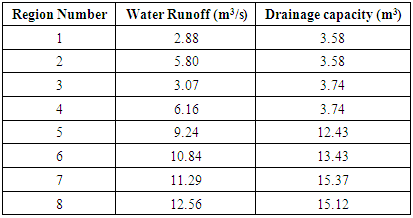
5. Results and Discussion
- The results of the drainage monitoring system, PL-UDMS, were observed for three rainfall episodes of 15 mm, 20 mm and 50 mm in the eight regions of Port-Louis. The result obtained for the first rainfall episode shows that with water runoff of 4.35 m3/s and 4.62 m3/s in regions 2 and 4 overflow respectively with an amount of rainfall of 15 mm for a time period 1 hr.Rainfall intensity of 15 mm for 1 hr.
|
|
|
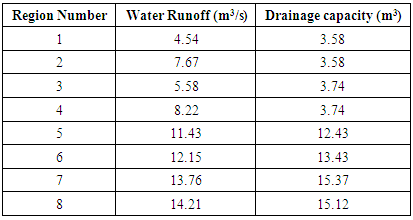
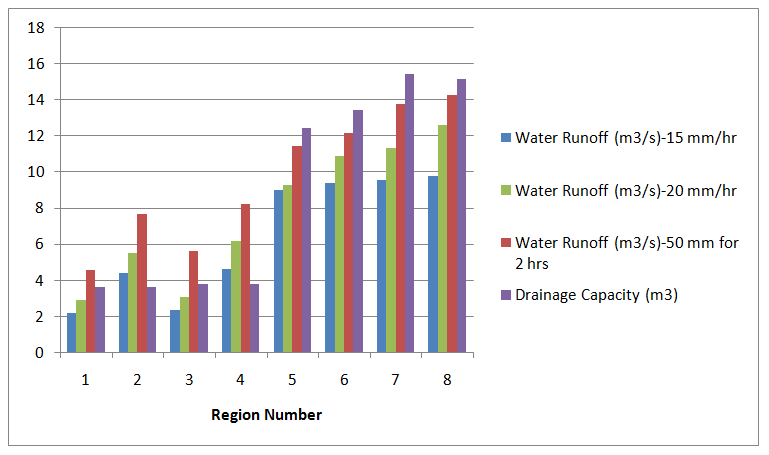 | Figure 28. Water Runoff for rainfall intensities of 15mm/hr, 20mm/hr, 50mm and Drainage Capacity for 8 regions in Port-Louis |
6. Conclusions
- Past situations of high rainfall at specific locations in Mauritius have led to overflow of urban regions’ drainage system, major infrastructural damages and loss of human lives. Wireless sensors becoming more powerful, reliable and affordable gives the possibility to monitor our environment to avoid catastrophic situations. Hence the proposed system is designed to detect real time cases of overflow and obstruction in urban drainage by placing sensor nodes at strategic locations inside the drains to monitor water level and water-flow. The proposed monitoring system allows early detection of obstruction in the drains and local authorities can deploy the concerned team to go and clear the water-flow passage before overflow occurs. Moreover, in case of water level rising to the drainage level and a prediction of continuous high rainfall, an alarm can be raised to evacuate the inhabitants. The paper discusses about the architecture, cluster formation, routing algorithm and topology required for the implementation and deployment of a wireless sensor urban drainage monitoring system.The urban drainage monitoring system (PL-UDMS) can be used to validate the designs of proposed urban drainage systems. The design with related measurements can be fed into the system to output the runoff in the drainage, thus making the application flexible. Rainfall intensity and time period can be varied to assess drainage systems and determine overflow. The real time drainage monitoring system deployed in Port-Louis can be extended to monitor other highly vulnerable cities in Mauritius such as Ebene and Curepipe where there are frequent occurrences of high precipitation.