Nosiri O. C., Ononiwu G. C., Ekwueme E. U., Akande A. O.
Electrical Electronic Engineering, Federal University of Technology, Owerri, Nigeria
Correspondence to: Nosiri O. C., Electrical Electronic Engineering, Federal University of Technology, Owerri, Nigeria.
| Email: |  |
Copyright © 2015 Scientific & Academic Publishing. All Rights Reserved.
Abstract
Infrastructure sharing approach has been adopted by wireless communication service providers as a panacea to reduce the huge cost involved in building new cell sites. The paper was designed at providing adequate solution to mitigate the transmitter noise effect involving downlink frequency of CDMA-2000 in the frequency range (1960-1990MHz) and uplink WCDMA in the frequency range (1920-1980MHz) in a co-located network. The paper further introduced the application of a digital BBPF as a technique to attenuate the significant effects of the transmitter noise. BBPF technique was considered more suitable among the Infinite Impulse Response (IIR) filters such as Chebyshev I and II, Elliptic and Bessel filters due to its attributes to least amount of phase distortion. Practical measurements conducted in two difference scenarios demonstrated the significant effects of the downlink frequency of CDMA2000 on the uplink frequency of the WCDMA network. A 52dB rejection at 5MHz guard band offset from the low side edge of the pass band was obtained as the undesired signal magnitude required to be attenuated. Conversely, an NCP criterion was introduced to evaluate the various performance characteristics at 52dB which gave rise to amplitude imbalance of 0.03dB, phase error of 0.140 and time delay mismatch of 0.07ns respectively. The values obtained in the study showed that the magnitude specification at 52dB rejection can to a larger extent attenuate the sideband noise components present in the WCDMA receiver front end.
Keywords:
Transmitter noise, WCDMA, CDMA2000, BBPF, NCP
Cite this paper: Nosiri O. C., Ononiwu G. C., Ekwueme E. U., Akande A. O., BBPF Technique for Transmitter Noise Reduction in a Site-Shared Wireless Network and Its Performance Evaluation Using NCP, Journal of Wireless Networking and Communications, Vol. 5 No. 2, 2015, pp. 49-59. doi: 10.5923/j.jwnc.20150502.01.
1. Introduction
With the advancement in wireless communication technology and the rapid increase in the demand for mobile systems has necessitated network operators to build more cell sites to provide coverage to some geographic regions where there are no wireless networks, to cover areas where existing signals are weak especially in the rural areas and to support a larger number of customers to meet the higher speed requirements of emerging technologies [1]. The need to meet the requirements has led to the proliferation of new cell towers which are capital intensive. The solution to the obvious challenge was the introduction of infrastructure sharing strategy by the International Telecommunication Union (ITU), where all the wireless network regulatory bodies globally are advised to adopt the reform. This was driven by the need to [2, 3].● Reduce the incessant proliferation of telecommunication towers● Share more networks on the same tower as a means to optimize savings and efficient utilization of the available resources ● Promote fair competition through equal access granted to the installations and facilities of operators on mutually agreed terms.● Stimulate easy migration to new technologies and the deployment of mobile broadband. ● Improve the market penetration and profit margins for telecom operators in the emerging marketsThe initiative was primarily focused to generate economic growth with improved network quality and help developing and developed countries to meet the objectives of the World Summit on the Information Society and the Millennium Development Goals established (ISMDG) by the United Nations [4]. Cell site sharing reform was introduced in Nigeria by the Nigerian Communication Commission (NCC). Sequel to the benefits and developments, operators such as MTN, Etisalat, Globalcom, Visaphone and Airtel seeking to expand their network services by building new cell sites are regulated and managed by the NCC licensed service vendors such as the IHS Plc, Swap Technologies, MTI and Helios Towers [5, 6].a) Active infrastructure sharing (such as spectrum, switches, antennae, transceivers and microwave equipment). b) Passive infrastructure sharing (such as towers, BTS shelters, power supply, generators, batteries and air-conditioners) and c) Operators Backhaul sharing (core network elements such as switching centers, GPRS service nodes, transmission equipment and all links connecting elements of the core network).Currently, the most commonly shared infrastructure among operators is passive infrastructure, because it is easier to contract its set-up and maintenance. Two co-located network operators investigated in the study are MTN (WCDMA) and Visaphone (CDMA2000). The frequency spectrum allocation used by Nigerian network operators for WCDMA and CDMA2000 are shown in Table 1. A vital consideration when analyzing a co-located network is to establish if the frequencies of the networks are adjacent to each other, overlap or have close ranges. | Table 1. Frequency spectrum for CDMA-2000 AND WCDMA [8] |
| | Wireless access technology | Mobile station transmitter (MHz) (Uplink) | Base station Transmitter (MHz) (downlink) | Duplex separation (MHz) | | CDMA 2000 | 1850-1910 | 1960-1990 | 80 | | WCDMA | 1920-1980 | 2110-2170 | 190 |
|
|
The frequency band allocation for CDMA 2000 downlink as shown in Table 1 is between 1960-1990MHz and that of WCDMA uplink is between 1920-1980MHz. This showed that the CDMA2000 transmitter (Tx) frequency band overlaps with the WCDMA receiver (Rx) frequency band by 20MHz, therefore, the two networks will interfere in a co-located setting. On the other hand there is wide frequency band isolation between WCDMA transmitting frequency and CDMA2000 receiving frequency; hence, there is no possibility of the two systems interfering. The paper predominantly examined the effects of the transmitter noise radiation from the downlink frequency of CDMA2000 network on the uplink frequency of WCDMA receiver system in a co-located platform and proffered industrial solution to mitigate the noise through the deployment of Butterworth Band Pass Filter (BBPF) technique and also evaluated the magnitude design specification performance using Noise Cancellation Performance (NCP) criteria.
2. Literature Review
Author of [9] characterized transmitter and receiver performance based on lab tests conducted on commercial equipment for both UMTS 900 and GSM 900MHz terminals and base stations. The impact of GSM Mobile Stations (MS) and UMTS node B and user end with GSM BTS on receiver performance were assessed. The result obtained showed that the limiting factor was the interference caused by the GSM MS to the UMTS Node B and that as little as 4.2MHz of GSM spectrum can be cleared and allocated to the UMTS carrier with satisfactory system performance. The paper actually considered the major steps required to address the issue of transmitter noise interference but failed to analyze the various levels of percentage capacity degradation and noise rise as the interfering power increases. This is significant because it identified percentage capacity loss relative to the rise in interfering power. Another author of [10] developed an interference reduction mechanism based on physical optimization of antenna system that could be understood as a physical symmetry rotation in the space of parameters such as tilt and azimuth control system. The method acts only on some parameters of the system such as tilt and Azimuth. This gave a solution to independently reduce the interference effects on the distance between the base stations. Only physical optimization of antenna isolation is not adequate for proper attenuation of transmitter noise. Additional mitigation techniques are necessary for optimal performance. The authors of [11] investigated the effects of adjacent channel interference radiated by CDMA2000 on the WCDMA system uplink and downlink scheme in Indonesia. Several scenarios and calculation models to evaluate the impact on the uplink and downlink scheme were deployed. Their work emphasized on the computations and simulation performance in one cell scenario, where one WCDMA base station, referred to 3G Node B, serving greater number of WCDMA mobile stations (Ms). Two calculations were made on the uplink by varying the distance, guard band frequency and number of CDMA 2000 MS. It was designed by setting CDMA2000 MS as source of interfere. The first calculation was to obtain the minimum allowed received power at WCDMA BS while the second calculation provided the capacity degradation. In the downlink scenario, measurements were conducted to obtain the capacity degradation of WCDMA MS due to the presence of CDMA 2000 BS. Simulation analysis was also developed in one cell scenario where one WCDMA BS served numbers of its user’s. The WCDMA downlink simulation was actualized by distributing the number of WCDMA MS randomly in one cell, defining the position of one CDMA 2000 BS and its distance to the WCDMA BS and calculating the pathloss value for each WCDMA MS towards WCDMA BS and CDMA2000 BS. Others include: calculating the total transmission power of WCDMA BS, calculating the allocated transmission power for every WCDMA MS before the presence of the CDMA2000 BS and calculating the interference power generated by CDMA2000 BS for each pathloss value and the Signal to Interference Ratio (SIR) value for every WCDMA MS after the presence of CDMA 2000 BS.The work of [11], demonstrated the co-existence performance effect of CDMA2000 and WCDMA network. It emphasized on the adjacent channel interference of CDMA2000 MS on the WCDMA BS and CDMA BS on WCDMA MS. The authors were able to establish the significant reduction effects on the SIR and capacity loss of the WCDMA network due to the interference from CDMA 2000 BS which reduces the number of user equipment. The authors developed good analysis but principally accentuated on the significant effects of interference on the networks of interest. On the other hand, no further work or proposal was put in place on the need towards developing adequate mitigation technique (s) to reduce the interference issue, rather they considered increasing the distance and guard band frequencies which may have significant effect especially on the coverage radius and usage bandwidth. The authors of [12] addressed the key characteristics of interference in wireless networks and the effect of interference from Code Division Multiple Access (CDMA 2000) base station on the Wideband-Code Division Multiple Access (WCDMA) network. The analysis of the coexistence CDMA2000 with WCDMA operating in the same geographic area was established using deterministic computations by considering a worst-case scenario. The authors also considered that a 5MHz protection band between PCS and UMTS band was necessary. They suggested the application of filter of realistic complexity and cost to be installed at the CDMA BS transmitter path with 60 dB attenuation and the required antenna-to-antenna isolation to be 58 dB. They also recommended that vertical separation of antennas could lead to lesser values for antenna gains and reduces the burden on the required isolation. The authors failed to evaluate the level of interference caused by the CDMA 2000 transmitter on the WCDMA receiver front end and the level of the receiver sensitivity degradation with the corresponding noise rise. On the other hand, no mitigation technique was developed. To obtain a good result in such coexistence scenario, it is strongly recommended to characterize the environment; this will give a better evaluation performance since the environment is a major consideration factor for interference analysis.
3. Methodology
The communication channel considered in this study was the Radio Frequency (RF) path present from the transmit power amplifier to the receive antenna of the co-located networks. The article proposed the application of BBPF as a mitigation technique. The application of BBPF technique requires a priori knowledge of both the signal and noise characteristics. The method was based on knowing the interference properties and knowing the parameters of the radio devices. The interference leakage of the CDMA2000 Tx signal power on WCDMA Rx signal was investigated. The approach was considered using two scenarios; the test network was set up in the eastern part of the country. The first scenario involved an unco-located WCDMA network while the second scenario involved a co-located network comprising of CDMA 2000 and WCDMA. The technique constituted the applications of empirical analysis.Scenario one involved the measurements of the reference received signal strength and the evaluation of the system noise floor level, system capacity and the carrier to interference ratio for the unco-located networks while scenario two considered the measurements of the received signal power, Effective Radiated Power (ERP) and the mathematical evaluation of the interfering signal power. Others include calculating the noise floor level, Carrier to Interference (C/I) ratio, system capacity and percentage C/I ratio degradation respectively for the co-located networks. The measurements were conducted in two seasonal periods: dry and rainy season, to obtain the best possible average received signal power and effective radiated power for the system design. A Huawei software M2000 Service Maintenance System CBSS installed in a laptop was the software used to conduct the measurements. The software provided the window where the sites to be measured were selected within the sector and the carrier. The M2000 software provided a centralized network management and an integrated topology window through which users can create and manage the topology view of the entire network. The topology view displayed the networking status, geographical locations of devices, link status between devices, and connection status between devices and the M2000.
3.1. Mathematical Procedure
The model used to obtain the Noise Figure (NF) is given in equation (1) as [13]. 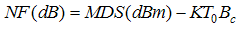 | (1) |
Where, MDS is the Minimum Detectable Signal (-102dBm) for WCDMA network [13]. is the channel bandwidth for the WCDMA given as 5MHz [8]
 is the Boltzmann’s constant
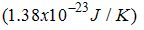
 is the ambient temperature in Kelvin
3.2. Computation Model for Unco-located Network
The Noise Floor (NFloor) level is stated in equation (2) as [14].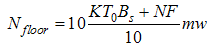 | (2) |
where  is the signal bandwidth of WCDMA is 3.84MHz [8]. The minimum demodulation C/I ratio was obtained using equation (3) [14].
 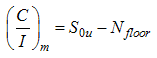 | (3) |
Where,  is the average received signal strength.
3.3. Computation Model for Unco-located Network
The difference in the received signal level for co-located and unco-located networks gives the degraded received signal power denoted by eta symbol  . If the received signal strength is degraded by η, then the interference plus noise power
  is given by equation (4) [14].
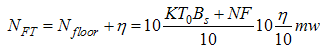 | (4) |
The interfering power at the receiver input, represented by a gamma symbol  in dBm is computed using equation (5) [14].
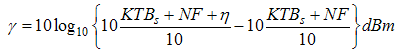 | (5) |
The minimum demodulation carrier-to-interference ratio (dB) is given by equation (6) [14].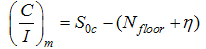 | (6) |
Where  is the average received signal strength for co-located network.
4. Result and Discussion
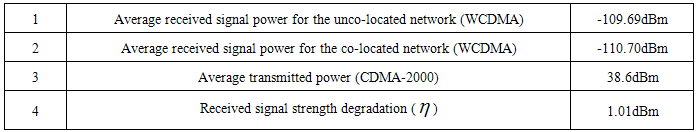
Tables 2 and 3 showed the detailed summary of the average measured data and computed results and Table 4 showed the average ranges of the generated values.Table 2. Summary of the Average Measured Data
 |
| |
|
Table 3. Summary of the Evaluated Results
 |
| |
|
Table 4. Average Ranges of the Generated Values
 |
| |
|
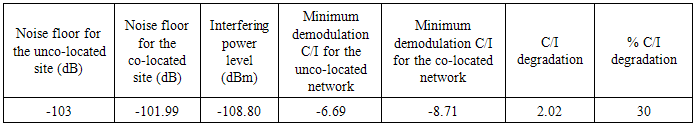
From Table 4, the received signal strength degradation was considered in the range of 0.01 to 3.07 dB, using 0.09 as the increment. The first and the second column showed the range of degradation in the received signal strength and the corresponding rise in total noise level after the system was interfered. The third column was obtained using equation (5), while the fourth column shows the decrease in interfering level compared to the original noise level of the WCDMA. The original noise level was obtained as -103dBm using equation (2). The fifth and sixth columns were obtained using equations (1) and (6) respectively. On the other hand, column four, row one and row two showed that the noise floor level of the system was 26.37dB and 16.32dB higher than the interfering power level. This explained that the noise floor levels are within an acceptable range. If the interfering noise level is equivalent to the original noise level as shown in row thirty-six, column three and column four, where the interfering noise level was -103.02dB and the original noise level was -103dB, the entire desired received signal at that point will be completely corrupted. Hence, the received signal strength at that instance was degraded by 3dB, given rise to 88.3% degradation of the carrier to interference ratio. Therefore, it is always important to ensure that the noise floor level of the original signal is 3dB above the interference noise level to maintain victim’s percentage ratio [8]. The condition of such illustrated scenario could be improved by adding 3dB to the original noise floor level. Columns six and eight showed the minimum demodulation and percentage degradation of carrier to interference ratio when the received signal strength degraded by a value with the corresponding noise rise of the same value. The C/I ratio degradation in column seven was obtained by the difference in C/I ratio for unco-located and co-located networks. The Three Generation Partnership Project (3GPP) specified a tolerable level of interference from the offending transmitter to the victim receiver as -110 dBm/3.84 MHz [15]. A spurious signal would be 7dB below the original noise floor value and its presence would cause a received signal strength degradation of 0.8 dB. Referring to the results obtained in table 4, the interfering power level of the CDMA 2000 transmitter to the WCDMA receiver obtained as -108.80dBm/3.84MHz was beyond the specified tolerable level by the 3GPP. The stated condition necessitated the development of the mitigation system using a BBPF. Figure 1, illustrated the detailed steps to obtained the desired filter magnitude.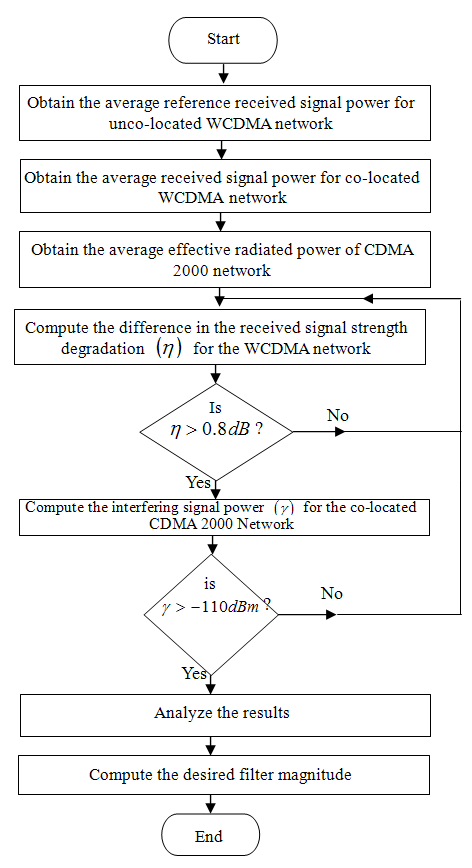 | Figure 1. Steps to Obtain the Desired Filter Magnitude |
4.1. BBPF Design Procedure
The limits of spurious emission level by the Three Generation Partnership Project Two (3GPP2) for CDMA far offset from carrier is given as -13dBm/1MHz  [16]. In order to guarantee that the affected receiver’s performance will not degrade, the isolation between the interfering transmitter and affected receiver should be:
 | (7) |
The total isolation required to maintain optimum received signal performance in the co-located scenario is 102dB. The standard antenna-to-antenna isolation specification (dB) by the NCC for personal communication system (PCS), digital communication systems (DCS) and universal mobile communication system (UMTS) in a co-located site is 50dB [8]. Therefore a 52dB rejection at 5MHz guard band was obtained as the required specifications for the BBPF offset from the low side edge of the pass band. A guard band of 5MHz pass band was considered to offer a faster roll-off space for the BBPF. Figure 2 illustrated the guard band specification.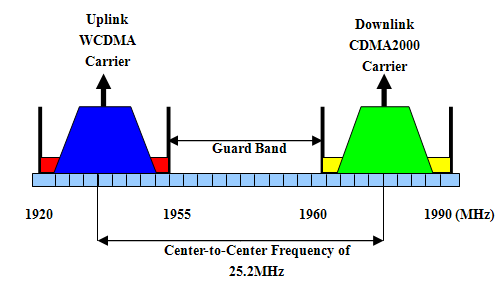 | Figure 2. The Guard Band specification |
4.2. BBPF Design Specifications
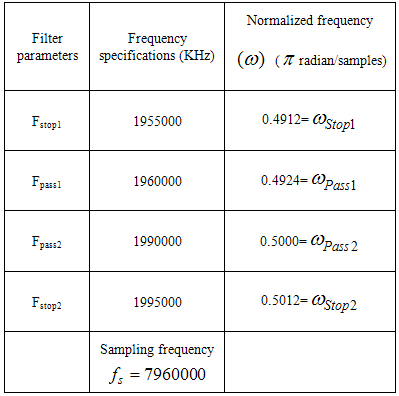
The BBPF was primarily considered among other Infinite Impulse Response (IIR) filters because of its attributes to the least amount of phase distortion. Other features include the transfer function of the filter offers maximally-flat response at the pass band and stop band, signifying that its frequency response decreases monotonically, exhibiting no ripples at the pass band and stop band frequencies. This unique characteristic performance shows that the phase linearity of Butterworth filter is better than other IIR filters. Equation 8 [17], was used to convert the frequency(Hz) to normalized frequency  .
. | (8) |
Where  is the absolute frequency in Hertz or cycles/second,
  the sampling frequency in samples/second and
  is the normalized frequency in
  radian/sample. Figure 3 illustrated the flowchart implementation of the BBPF and Tables 5 and 6 showed the frequency and magnitude specifications for the BBPF. The graphs of magnitude response, phase response, group delay performance, impulse response and pole/zero plots are illustrated in Figures 4-9.
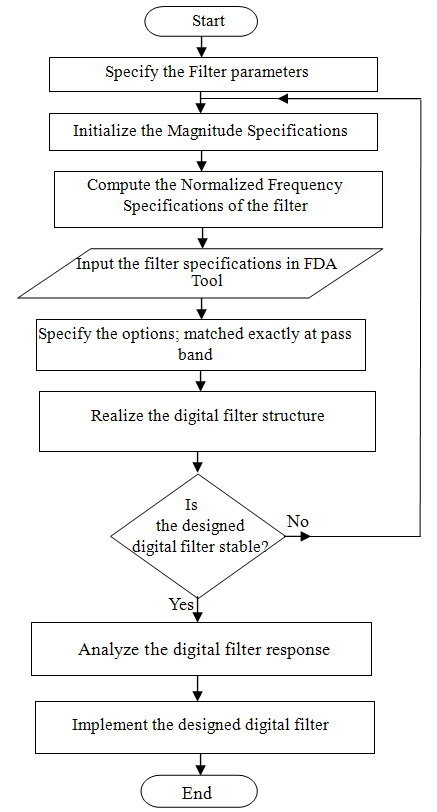 | Figure 3. Flowchart Implementation of the BBPF |
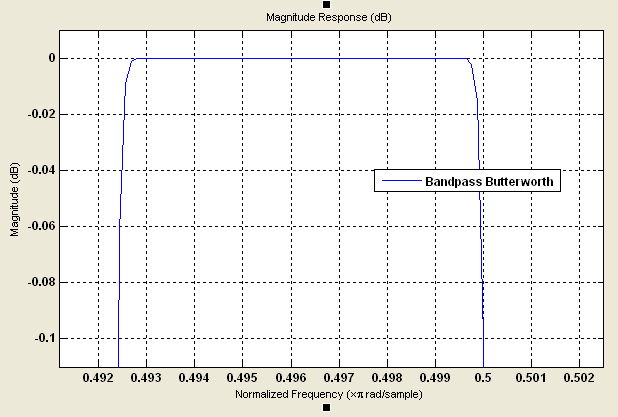 | Figure 4. The Magnitude Response |
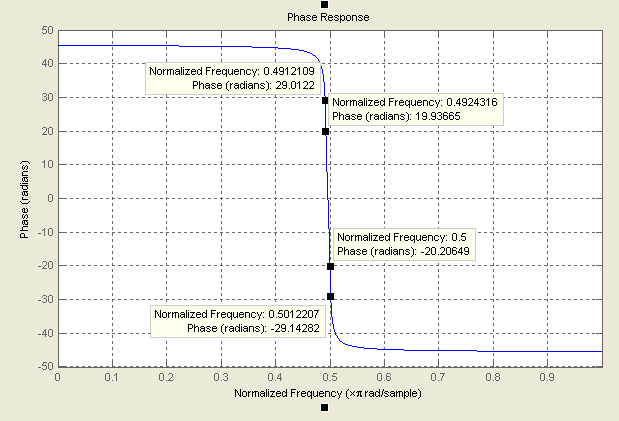 | Figure 5. The Phase Response |
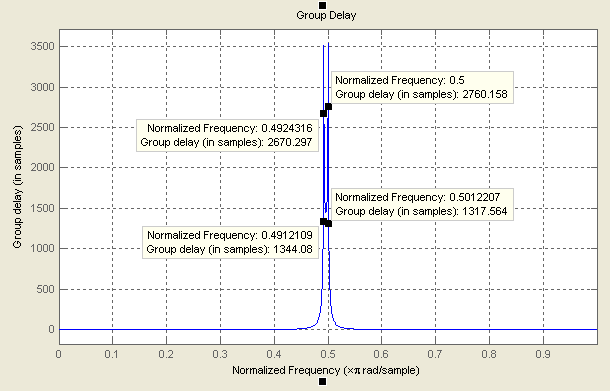 | Figure 6. Group delay response |
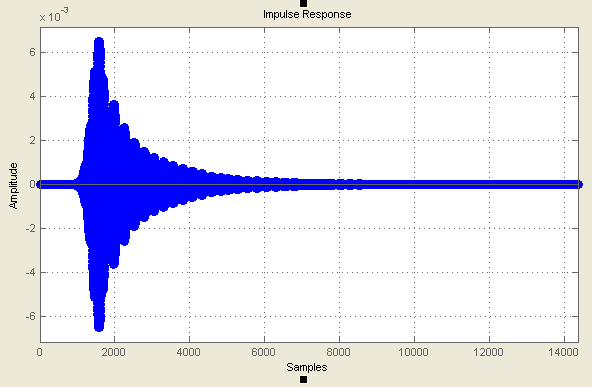 | Figure 7. The Impulse Response |
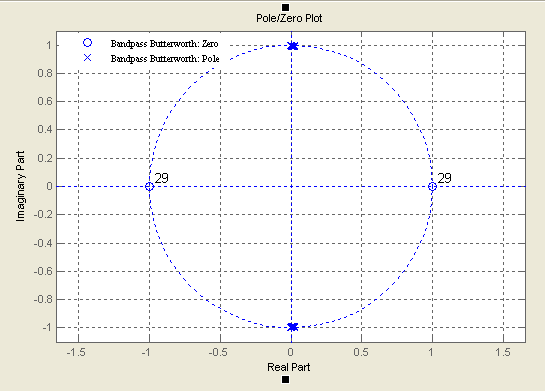 | Figure 8. The Pole and Zero Plot |
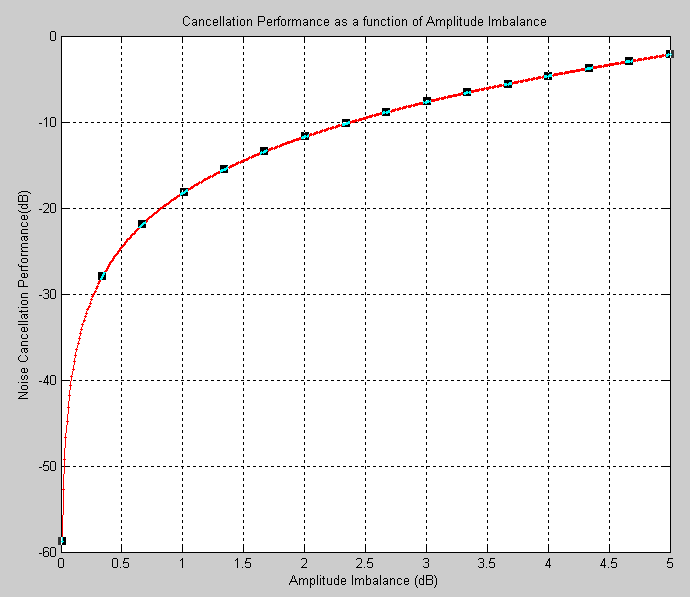 | Figure 9. Amplitude imbalance Vs Noise Cancellation Performance(dB) |
Table 5. Frequency and Normalized Frequency Specifications for the BBPF
 |
| |
|
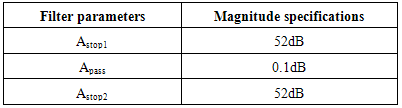
Table 6. Magnitude Specifications for the BBPF
 |
| |
|
where;Fpass1: Frequency at the edge of the start of the pass band. Specified in normalized frequency units. Fpass2 : Frequency at the edge of the end of the pass band. Specified in normalized frequency units. Fstop1 : Frequency at the edge of the start of the first stop band, specified in normalized frequency units. Fstop2 : Frequency at the edge of the start of the second stop band, specified in normalized frequency.Astop1: Attenuation in the first stop band in dB.APass: Amount of ripple allowed in the pass band, known as the single pass band gain parameter.Astop2: Attenuation in the second stop band in dB.
4.3. Performance Evaluation Decisive Factors for the BBPF Technique
The system performance of the BBPF technique was evaluated using Noise Cancellation Performance (NCP) criterion. This is important to assess the performance of the designed system. The NCP is a measure of the cancellation levels by which the noise signal power level in a certain bandwidth is reduced [18]. It is mathematically defined as the power ratio of the residual error signal to the primary signal at the point of cancellation expressed in dB as shown in equation (9) [18].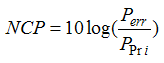 | (9) |
where  is the error signal in terms of average power level and
  is the primary signals in terms of average power levels. Equations 10, 11, and 12 are used to plot the graph of Amplitude Imbalance versus Noise Cancellation Performance level, the graph of phase error against different levels of Noise Cancellation Performance and the graph of delay mismatch against Noise Cancellation Performance levels respectively, as shown in Figures 9, 10 and 11. The cancellation performances are used to describe various levels achievable relative to the characteristic performances of the amplitude imbalance, phase error and delay mismatch.
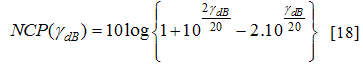 | (10) |
 | (11) |
 | (12) |
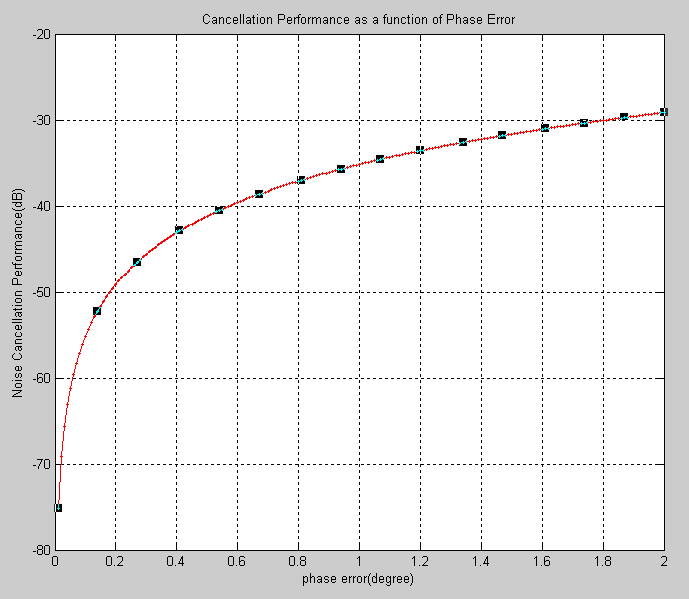 | Figure 10. Phase Error(degrees) vs Noise Cancellation Performance(dB) |
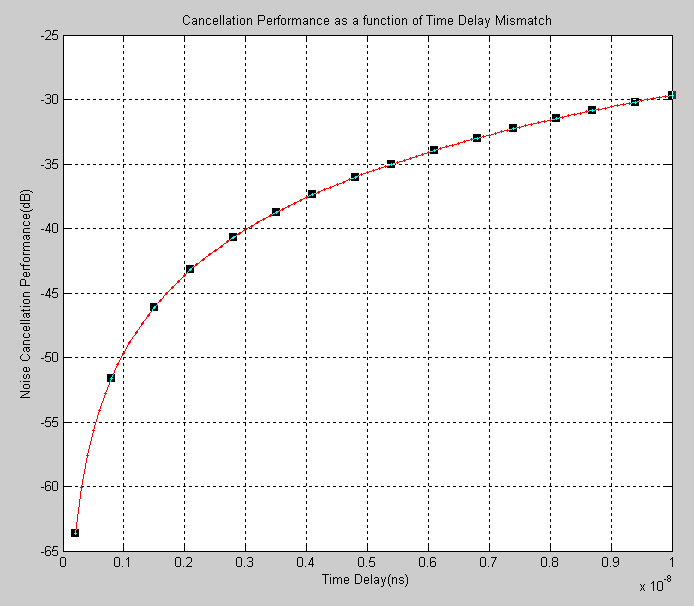 | Figure 11. Time delay Mismatch (ns) vs Noise Cancellation Performance (dB) |
It is observed that to achieve a 52dB cancellation in Figures 9, 10 and 11, the amplitude imbalance was below 0.03dB, the phase error was less than 0.140. and the delay mismatch did not exceed 0.07ns. Therefore, the minimum requirements necessary to obtain a 52dB noise cancellation performance are;  <0.03dB,
  < 0.140 and
  < 0.07ns. The values obtained showed that the magnitude specification obtained for the BBPF design could substantially attenuate the transmitter noise components present in the WCDMA receiver with minimal leakages considering the non-ideal characteristic of a fixed filter.
5. Conclusions
The paper was designed at providing adequate solution to mitigate the transmitter noise effect involving downlink frequency of CDMA-2000 in the frequency range (1960-1990MHz) and uplink WCDMA in the frequency range (1920-1980MHz) in a co-located network. Empirical analyses were conducted in two different scenarios to evaluate the degree of interference power effects on the victim receiver. The effects of the interfering noise power on the received signal strength performance and its degradation effects on the Carrier to Interference ratio were clearly characterized using empirical analysis. The interfering power was evaluated as -108.80dBm, which gave rise to 1.01dBm received signal strength degradation and 1.01dBm rise in total system noise floor, about 30% degradation in C/I ratio. A 52dB rejection band pass filter at 5MHz guard band offset from the low side edge of the pass band was obtained. The application of BBPF was used to attenuate the significant effects of the transmitter noise. Conversely, an NCP criterion was introduced to evaluate the various performance characteristics at 52dB. This gave rise to amplitude imbalance of less than 0.03dB, phase error below 0.140 and time delay mismatch below 0.07ns respectively. The three values obtained in the research findings showed that the magnitude specification of the 52dB rejection obtained for the BBPF design can to a larger extent attenuate the sideband noise components present in the WCDMA receiver front end.
References
| [1] | P. Stox “Wireless co-location on towers and alternate structure” satellite broadcast TV, linksystem.uk.com.April, 2010. |
| [2] | Guidelines on Collocation and Infrastructure Sharing Issued by the Nigerian Communications Commis sion, pp 1-2, 2010. |
| [3] | S. Opara, I. Iteun, “Option for Telecoms operators during recession”. A published article pp1-2, June, 2009. |
| [4] | Camila B.L. ITU’s eighth Global Symposium for Regulators (GSR) ITU news magazine www.itu.int/gsro8. |
| [5] | F.E. Idachaba, “Telecommunication Cost Reduction in Nigeria through Infrastructure Sharing between Operators”. Pacific Journal of Science and Technology. 11(1):272-276, 2010. |
| [6] | Nigeria Communications Week “Managed services in Nige ria “, March 11, 2012. |
| [7] | Bala-Gbogbo E. “Telecom Industry Operators Opt for Infra structure Sharing”, 2009. |
| [8] | Chen Xinting, “Analysis of co-site interference between different mobile communication system”, wireless technical support department, Huawei technologies Co. Ltd, pg 9, 2008. |
| [9] | Vieri, V., Mustafa, S., and Jiang, J., “Frequency Coordination between UMTS and GSM systems at 900MHz” Qualcomm Incorporated, 5775 morehous Drive, San Diego, CA 92121, 2008. |
| [10] | Jraifi, A., Laamara, R.A., Belhaj, A., and Saidi, E.H., “A proposal solution for interference inter-operators” Progress in Electromagnetic Research C, Vol 12, 15-25, 2010. |
| [11] | Muhammad S., Edward R. H., Dadana G. “The interference on WCDMA system in 3G coexistence network”, the 17th Annual IEEE International Symbosium on personal, indoor and mobile radio communication PIMRC 2006. |
| [12] | Hammed A. and Ali Oudah “Interference in Wireless Net works: causes, analysis and practical mitigation techniques” Published by Canadian Centre of Science and Education, Modern Applied Science Vol. 8, No. 5; 2014. |
| [13] | Chenung, Tze Chiu, “Radio Performance”, Chapter 4 Vir ginia Tech: ETD 122298 pp 96-99, 2009. |
| [14] | Montegrotto T. “Practical Mechanism to Improve the Compatibility between GSM-R and Public Mobile Networks and Guidance on Practical Co-ordination”, ECC Report 162, p.40 May, 2011. |
| [15] | Sander, J. W., “Spurious Emission Measurement on 3GPP Base station transmitters” Rohde and Schwarz. pp 2-6, 2002. |
| [16] | Trino G., Chen L., “interference analysis between co-located networks in Nigeria”, RF design Manager from Star comms 2nd version, 2007. |
| [17] | Losada R.A., “Digital Filters with MATLAB”, The Mathworks Inc. p 4, 2008. |
| [18] | Alain R., “Feedforward Interference Cancellation System applied to the 800MHz CDMA cellular band. A master thesis in electrical engineering Ottawa-Carleton institute of Electrical Engineering, may, 2003, pp. 20-39. |
 Abstract
 Reference
 Full-Text PDF
 Full-text HTML