-
Paper Information
- Paper Submission
-
Journal Information
- About This Journal
- Editorial Board
- Current Issue
- Archive
- Author Guidelines
- Contact Us
Journal of Wireless Networking and Communications
p-ISSN: 2167-7328 e-ISSN: 2167-7336
2013; 3(3): 39-49
doi:10.5923/j.jwnc.20130303.03
Systems Adaptation for Satellite Signal under Dust, Sand and Gaseous Attenuations
 Abstract
 Reference
 Full-Text PDF
 Full-text HTML
Kamal Harb , Omair Butt , Samir Abdul-Jauwad , Abdulaziz M. Al-Yami
Electrical Engineering Department, KFUPM University, Dhahran 31261, Saudi Arabia
Correspondence to: Kamal Harb , Electrical Engineering Department, KFUPM University, Dhahran 31261, Saudi Arabia.
| Email: |  |
Copyright © 2012 Scientific & Academic Publishing. All Rights Reserved.
Sand, dust, gaseous and other atmospheric properties have a distorting effect on signal fidelityof Ku and Ka bands. Such distributions result in signal transmission error commensuration with different weather attenuations. These attenuations severely affect quality of service (QoS) as well as service level agreement (SLA). The main focus of this paper is to propose a new model for atmospheric impairments affecting satellite communication networks that operate at high frequencies. These operations are heavily dependent on the propagation characteristics in desert areas, due to the often occurring of dust and sand storms as well as gaseous attenuations. Furthermore, gaseous attenuation (GA) can be estimated by using predicted signal-weather correlated database in collaboration with ITU‒R propagation models combinedwith interpolation methods, gateway, and ground terminal characteristics. A three dimensional relationship is then proposed for these attenuations with visibility, dust particular size, frequency, and propagation angle to provide decision and control system (DACS) with an enhanced view of satellite performance. This system is controlled by a skilful atmospheric aware model (SAAM) that can enable mitigation planning by adaptively selecting satellite parameters to improve network performance and monitor receiving signal to maintain the predefined threshold level under different weather conditions. Simulation results are presented to show the effectiveness of the proposed scheme.
Keywords: Decision and Control System, Dust and Sand Storms, Gaseous Attenuation, International Telecommunication Union Radio Communications, Quality of Service, Satellite Networks, Signal to Noise Ratio, Skilful Atmospheric Aware Model, Visibility
Cite this paper: Kamal Harb , Omair Butt , Samir Abdul-Jauwad , Abdulaziz M. Al-Yami , Systems Adaptation for Satellite Signal under Dust, Sand and Gaseous Attenuations, Journal of Wireless Networking and Communications, Vol. 3 No. 3, 2013, pp. 39-49. doi: 10.5923/j.jwnc.20130303.03.
Article Outline
1. Introduction
- The rapid growth of wireless and satellite networks for communication on Ku and Ka bands have been widely employed. However, propagation impairments due to atmospheric attenuations can cause uncontrolled variations in signal level, phase, polarization, and angle of arrival. This will result in excessive digital transmission errors. These propagation impairments differ from one location to another on earth and are presented by dust, sand and gaseous attenuations in areas like Saudi Arabia. These attenuations become particularly severe at frequencies higher than 10 GHz, especially for very small aperture terminal (VSAT) [1]-[3].Dust and sand attenuations (DASA) are considered a dominant impairment for satellite signals in the desert area. Fig. 1 shows an extreme sand and dust storm form-ation[4]. Thus quality of service (QoS) in satellite networks are severely affected while facing these kinds of atmospheric conditions.Knowing the atmospheric characteristics are important factors for system reliability and QoS provisioning in satellite networks. International Telecommunication Union Radio Communications (ITU‒R) maintains a database for atmospheric characteristics around the world that is used to estimate weather attenuations and other parameters. This attenuation is based on the concept of deriving the effective length of path through different weather conditions. The effective path in this paper takes into account the spatial non-uniformity of dust, sand, gaseous, and other atmospheric conditions, both horizontally and vertically[5],[6].
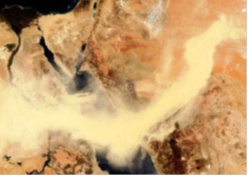 | Figure 1. Sand and dust storms formation in WesternRegion |
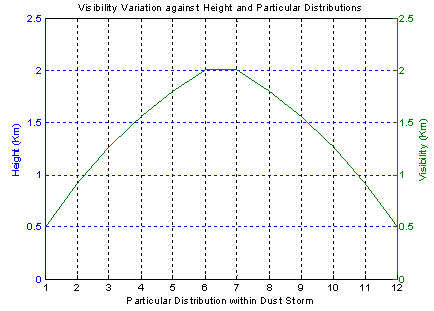 | Figure 2. Visibility variation of dust storm according to different height |
2. Atmospheric Attenuations Impact on Satellite Communications
- This section introduces dust, sand, and gaseous attenuations and their impact on satellite communications.
2.1. Dust and Sand Storms Presentation
- Dust and sand storms are very common meteorological phenomenon being observed in desert and dry areas such as Saudi Arabia, Arizona, Sudan, Iraq, Libya, etc. Usually, these storms arise due to strong winds causing the dust particles to get suspended in the atmosphere. These storms have varying maximum altitude depending upon specific regional characteristics and wind blow speeds.Severity of dust storms depends upon the visibility, or in other words the intensity of dust storms increases as the visibility decreases. Dust storms can attain altitudes of 5 km or more in the atmosphere[19]. An approach to model these storms and methods to get enhanced attenuation measurements is presented in this paper based on the knowledge of two dimensional (side and top view) models of dust storms as discussed in[20]-[22].
2.1.1. Concept of Dust Storm Layers
- The intensity of dust storm is not uniformly distributed and it varies both horizontally and vertically with the highest in the middle and lowering around the horizontal start, end and vertical edges. It contains several layers while moving from the base, in vertical direction, to the top. These layers represent different levels of visibility based on non-uniform particle size and intensity distributions within the DASA as shown in Fig. 2. This figure displays the dust storm for different height layers and visibilities. Thus, the visibility increases to its maximum at the highest level of dust storm. The results were acquired for up to 2 km in dust storms’ altitude along with different estimated visibilities. Such as, for 1.8 km of visibility, the height will be equal to 1.2 km. The physical representation of dust storm according to visibility variations with different levels shall lead to an improved estimation of weather attenuation. The results are of significant achievement.Therefore, the particle size distribution is similar to an exponentially decaying function, where the base layer contains heavier and denser particles leading to more attenuation. However, by moving in lateral direction, the size and density of the particles shall reduce, which constitute lesser attenuation. Note that, the line at the center of the figure divides the dust storm into two similar phases. Therefore, accurate estimation of dust storm height leads to better estimation of the channel attenuation which in turn, saves extra transmission power and improves QoS. These storms present the major cause of attenuation on satellite communication channels. DASA analysis and results will be presented in section 3.1.Thus, wireless channels are susceptible to several impairments simultaneously, including several weather anomalies. The following section covers gaseous presentation.
2.2. Gaseous Presentation
- As signal passes through the troposphere, they undergo interactions with the gas molecules that are present in the atmosphere. The atmosphere composition being at sea level includes:Nitrogen (N2) = 78%, oxygen (O2) = 21%, and the remaining of around 1% are represented by argon (Ar), carbon dioxide (CO2) which varies with location, neon, helium, krypton and water vapour (H2O) which varies in concentration from 0 to 2%, with trace quantities of: methane (CH4), sulphur dioxide (SO2), ozone (O3), nitrogen oxide (NO), and nitrogen dioxide (NO2)[26],[27].Each of these gas molecules interact with the propagated signal. The interactions may or may not cause loss of energy and hence attenuation. Losses are especially high near theresonances of the molecules as presented in the followingsections. Such as, when an asymmetric molecule (e.g., H2O) is placed in an electric field, it will try to align itself to minimum potential with respect to the electric field. Some of the important factors to remember are that absorption depends mainly on:i. The resonant frequency of gas moleculesii. The concentration of that gas in the atmosphereiii. The path length.Besides that, the atmospheric pressure is important. The resonance modes of the molecules are discrete. Since the molecules are constantly in collision with each other and moving at random, the resonance lines become broadened. Notice that, below 10 GHz, gaseous attenuation (GA) can beignored for most purposes.The important resonances for gaseous absorption up to 300GHz are those from atmospheric oxygen and water vapour.The quantities and effects of resonant gases (CO, NO, NO2, N2O, SO2,O3) are negligible compared to water vapour at typical microwave link frequencies.Oxygen has strong bands of resonances around 57 ‒ 60 GHz and 119 GHz. At sea level, the losses can mount up to 15 dB/km at between 57 GHz and 63 GHz. Satellite network designers should be aware of transmission signal with carrier frequencies around 22 GHz, 183 GHz, and 324 GHz because water vapour has resonance which increases the gaseous attenuation effect to the maximum. The attenuation changes with the amount of water vapour in the atmosphere. GA analysis and results will be discussed in section 3.2[3], [26]-[27].
3. QoS in Weather Impacted Satellite Networks
- Weather conditions have little to no effect upon low operational frequencies. However, QoS of a satellite network is hardly affected by atmospheric attenuations at reasonably high transmission frequency. This section proposes a new method for calculating dust and sand attenuations based on different layers that contain various visibility and dust storm particular size distributions. The gaseous attenuation model is achieved by implementing an updated adaptive software that uses ITU‒R data for this attenuation combined with bi-linear interpolation[29] at any location on earth, for a wide range of satellite parameters as per[1]-[3],[23].
3.1. Analysis and Simulation for Dust and Sand Attenuations in 3‒D
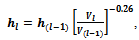
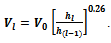
- The proposed dust storm formation will be chopped off into multiple layers based on the concept of doubling visibility from the starting point of each layer[23]. To achieve more precision, the visibility window should be narrower, but this precision might affect the computational cost while consuming additional layers. Expression (1) can be used in a recursive manner to obtain the visibility based layers in dust storm:
 | (1) |
 | (2) |
 | (3) |
3.1.1. Non-Uniform Dust Distribution
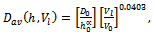
- Dust particle size distribution assessment is very important for predicting effects of dust storms. Each dust storm may have totally uncorrelated dust distributions. Moreover, this distribution is also dependent on height. As the height decreases, the particles average diameter increases because the heavier dust particles have greater fall velocities as compared to the particles with smaller sizes that remain suspended in the air for longer intervals of time. For all the samples, the relation between average diameter Dav (μm) and height h (m) can be represented by[20]:
 | (4) |
 | (5) |
 | (6) |
3.1.2. Dust Attenuation Modeling
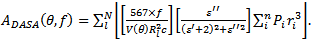
- Each layer constitutes its specific point of attenuation at the microwave signal depending on the measureof visibility as well as the equivalent dust particle radii. These individual layered attenuations are then summed up to reach the end of dust storm which can be discovered by attaining certain lower bound ofvisibility when compared to visibility in free space[9],[17],[22],[23]. The point attenuation is presented as follows:
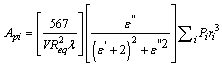 | (7) |
 represents the summation for different probabilities of particle sizes multiplied by the cubicof the dust particle size. The outcome of (7) is shown in Fig. 3. Also, listing values of dielectric constants at various frequencies is measured by[15],[23],[31].
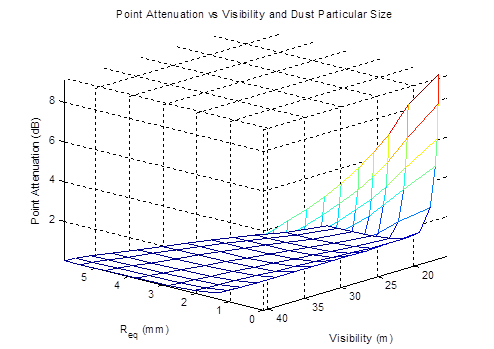 | Figure 3. Point attenuation with particles radius and visibility |
 | (8) |
3.2. Analysis and Simulation for Gaseous Attenuation (GA)
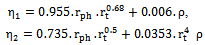
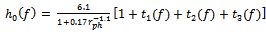
- In this section, analytical solution for GA is presented. Thus, predicting GA requires a model that allowsus to represent the specific attenuation mathematically. It can be calculated by summing the effects of all ofthe significant resonance lines given in[26]as:1- Specific Attenuation:A− For dry air, the attenuation γ0(f) (dB/km) for the frequency (f ≤ 54 GHz) is:
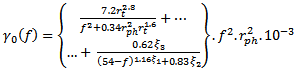 | (9) |
 | (10) |
 | (11) |
 | (12) |
 | (13) |
 | (14) |
 | (15) |
 | (16) |
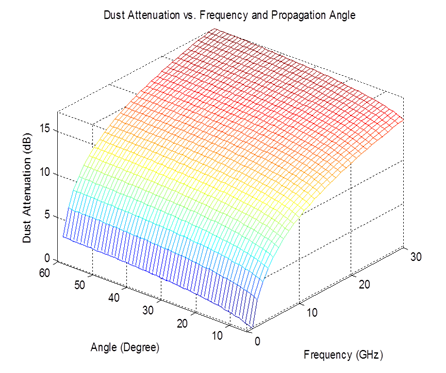 | Figure 4. Dust attenuation with frequency and propagation angle |
 | (17) |
 | (18) |
 | (19) |
 | (20) |
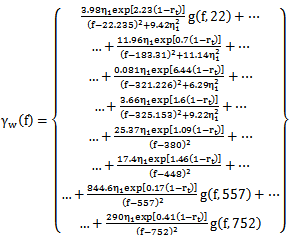
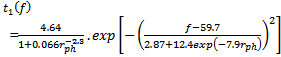
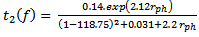
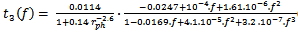
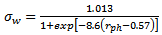
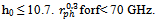 B- For water vapor, the equivalent height for f ≤ 350 GHz is:
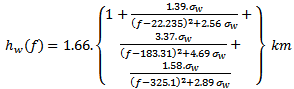 | (21) |
 | (22) |
 where
where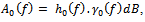 ,and
,and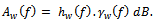 | (23) |
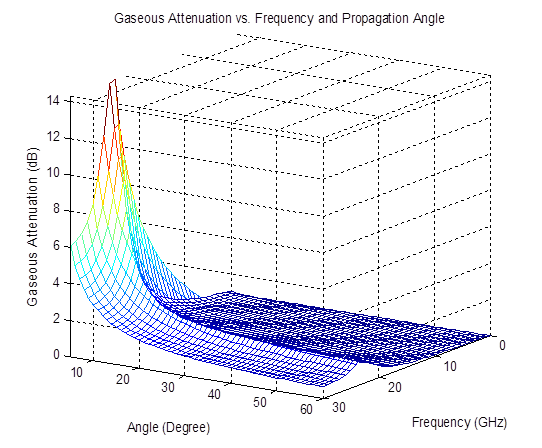 | Figure 5. Gaseous attenuation at KFUPM, Dhahran, Saudi Arabia |
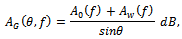
3.3. Analysis and Simulation for Atmospheric Attenuations
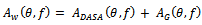
- The aim of this section is to estimate different atmospheric attenuations such as sand, dust, and gaseoususing predicted signal-weather correlated database in collaboration with ITU‒R propagation modelscombined with interpolation methods, gateway, and ground terminal characteristics.A three dimensionalrelationship for these attenuations with respect to propagation angle and frequency is presented in Fig. 6[1]-[3],[5]. These attenuations, for systems operating at frequencies above 10 GHz‒ especially thoseoperating with low propagation angles and/or margins, must be considered along with the effect of multiplesources of simultaneous occurring[32].This method provides a useful general tool for scaling atmospheric attenuations according to these parameters. Also,it helps to provide designers with a perceptible view of approximated different attenuationvalues that can be computed at any desired location, for different propagation angles, for any probability ofprecipitation, and for any specific uplink or downlink frequency.
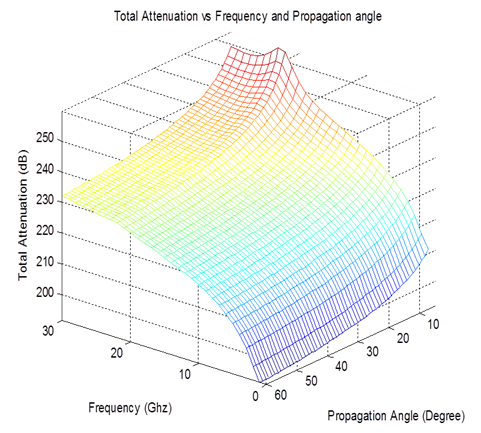 | Figure 6. Atmospheric attenuations at KFUPM Station, Dhahran, Saudi Arabia |
 | (24) |
4. Skilful Atmospheric Aware Model (SAAM) for Satellite Systems
- This section describes different computational techniques to provide decision and control system(DACS) with an enhanced view formodeling satellite propagation environments, and procedures for improving accuracy for the atmosphericattenuations with SNR calculations using different methods.
4.1. Role of Skilful Atmospheric Aware Model (SAAM)
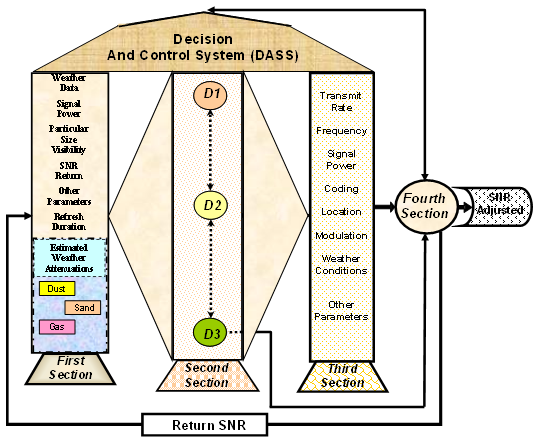
- A SAAM has to perceive its environment, to act rationally toward its assigned tasks, and to interact withother agents. The assigned tasks for this system are used to improve SNR according to weather’s variation.These capabilities arecovered by topics such as power, visibility, dust storm intensity, modulation, coding,and data rate, etc. The system relies on satellite parameter variations, training knowledge, various problemssolving, and search engines.By implementing the core skillful optimization model as shown in Fig.7, designers are able to predict individual components of satellite networks in a cohesive manner for an enhanced DACS which will be explained in section 4.3.
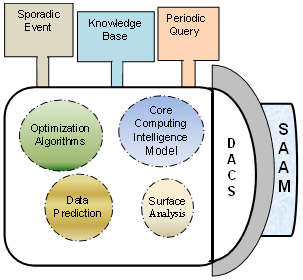 | Figure 7. Network optimization decision and control system (DACS) |
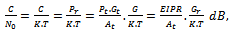
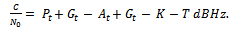
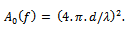
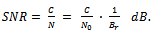
4.2. Signal to Noise Ratio (SNR) Calculation
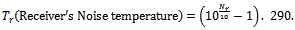
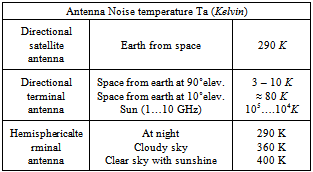
- By definition, SNR is a measure of signal strength for satellite signal relative to attenuations and backgroundnoise. A better estimation for SNR values calculated under different weather attenuations are proposed asfollows:Thermal noise power spectral density is:
 | (25) |
 | (26) |
|
 | (27) |
 | (28) |
 | (29) |
 | (30) |
 | (31) |
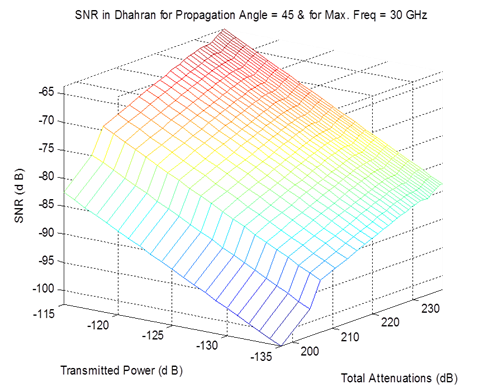
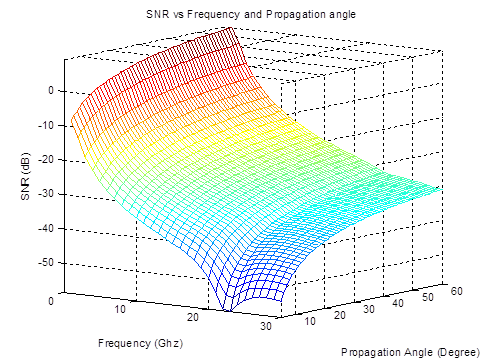 | Figure 8. SNR vs. frequency and angle at KFUPM Station, Dhahran, Saudi Arabia |
 | Figure 9. Output SNR at KFUPM, Dhahran station, Saudi Arabia |
4.3. Decision and Control System (DACS)
- The derived parameter values, being fed through SAAM toimprove estimated SNR, will enable the DACSto maintain QoS and SLAs by controlling satellite signal power, frequency, modulation, coding, and datarate under unpredictable weather conditions.The proposed method builds up a flexible SAAM based on core computing of the adaptive model that would be controlled by the predicted weather database.Such system will proficiently searchfor different combinations of controlled input variables such as transmit power level, modulation schemes,channel coding rates, etc. to minimize estimated attenuation effect and maximize channel robustnessand efficiency while improving SNR as shown in Fig. 10. SLA improves QoS by providing enhancedresults for weather attenuations in lieu of a wide range of frequencies, visibilities, dust particular size,and propagation angles combined together. This periodically- computed attenuation will keep updating ourknowledge input to the SAAM through the gate of DACS blocks.Real-time channel measurements such as SNR and BER can also serve as feedback tuning control toour DACS by adaptively modifying the input control variables for clear channel optimization.
4.4. Signal to Noise Ratio (SNR) Adjustment
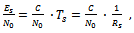
- Several factors can play an immense role in improving SNR and maximizingsystem throughput and availability of the link. In this section, a newproposed SAAM is introduced, asshown in Fig. 10, to overcome different weather conditions. Thus, by controlling the above mentionedfactors that supply SAAM, a path is given to allow an efficient mechanism to better estimate satellite’snetworking parameters such as link and queuing characteristics. These derived parameters would enable SAAM to maintain SNR by adaptively adjusting signal power, transmission rate, coding, and modulationunder unpredictable weather conditions.By definition, Es(symbol energy) = C .Ts = C / Rs, where transmission rate Rs(symbol/sec) isinversely equivalent to symbol duration Ts and energy-to-noise power density per symbol as:
 | (32) |
 | (33) |
 | Figure 10. Skilful atmospheric aware model (SAAM) for satellite systems |
5. Simulation Results and Discussions
- The predicted atmospheric attenuations were estimated, in the previous sections, at any location on earth fordifferent operational frequency values, and for a wide range of propagation angles. These schemes provideappropriate results up to high frequency of operations as shown in Figs. 4 and 5. Moreover, these resultsare key factors in implementing an accurate skillful engine that would act to improve end-to-end wirelesscommunications for different weather conditions.This simulation pilots an enhanced back propagation - learning algorithm that is used to iteratively tunethe skillful controller technique with returned SNR values for activating the weighted modulation/codepointto its optimal value, depending on actual or predicted weather conditions, configuration settings and toleranceor safety margins for SLAs commitment as shown in Fig. 10.
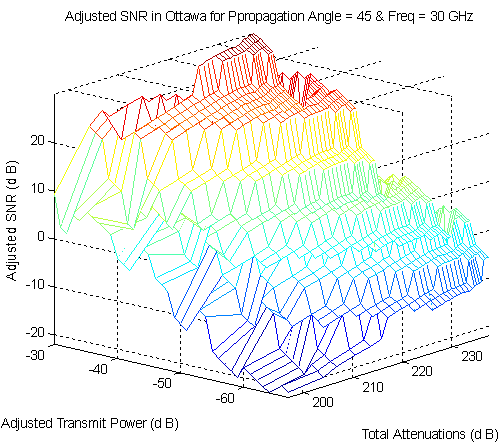 | Figure 11. Output Adjusted SNR at KFUPM, Dhahran station, Saudi Arabia |
6. Conclusions
- Sand, dust, gaseous, and other atmospheric properties can have a distorting effect on the QoS in satellitenetworks. Predicting channel attenuation due to atmospheric conditions can enable mitigation planning byadaptively selecting appropriate propagation parameters such as modulation and coding etc. This paperpresented a method to estimate dust, sand, and gaseous attenuations using the signal-weather database from ITU‒R propagation models combined with bi-linear interpolation, gateway, and ground terminal characteristics.A three dimensional relationship was presented for these attenuations with both frequency andpropagation angle to provide DACS with a mechanism to have an accurate view of satellite’s parameters.The proposed SAAM can provide designers with a perceptible view of approximated atmosphericattenuation values by giving them the flexibility at any location to apply various combinations of modulation, coding, transmission power, and transmission rate, for all propagation angles, and for any frequency, inorder to maximize satellite system’s throughput and QoS for variant weather conditions. Simulation resultswere presented to show the effectiveness of the proposed methods.
ACKNOWLEDGEMENTS
- The authors thanks the EE department at KFUPM University for providing us with the full support needed for installingthe satellite system equipment in order to produce the data, and for the financial support of this project.
Notes
- 1. “This work is supported by the Deanship of Scientific Research (DSR) at King Fahd University of Petroleum & Minerals (KFUPM) through project No. FT121013”.