-
Paper Information
- Next Paper
- Paper Submission
-
Journal Information
- About This Journal
- Editorial Board
- Current Issue
- Archive
- Author Guidelines
- Contact Us
Journal of Wireless Networking and Communications
p-ISSN: 2167-7328 e-ISSN: 2167-7336
2012; 2(6): 158-167
doi: 10.5923/j.jwnc.20120206.01
Underground Wireless Sensor Network Communication Using Electromagnetic Waves Resonates at 2.5 GHz
 Abstract
 Reference
 Full-Text PDF
 Full-Text HTML
Abdelrahman Elleithy, Gonshin Liu, Ali Elrashidi
Department of Computer Science and Engineering, University of Bridgeport, Bridgeport, CT 06604, USA
Correspondence to: Abdelrahman Elleithy, Department of Computer Science and Engineering, University of Bridgeport, Bridgeport, CT 06604, USA.
| Email: |  |
Copyright © 2012 Scientific & Academic Publishing. All Rights Reserved.
A comprehensive study of electromagnetic waves underground propagation for a wireless sensor network is introduced in this paper. A mathematical model for path loss due to attenuation of electromagnetic waves propagating in different types of soil is given. Reflection from the air-soil interface as a function of distance between sensors and soil depth is also introduced. Three different types of soil, sandy, loamy and magnetite soil are studied. A high gain antenna is required to overcome the high value of path loss. A printed microstrip circular antenna is very common antenna used for underground wireless communication applications. A high gain microstrip circular antenna is designed and simulated using FEKO software. The antenna performance parameters studied in this paper are return loss, voltage standing wave ratio, input impedance and gain.
Keywords: Wireless Sensor Network, Electromagnetic Waves, Reflection, Microstrip Circular Antenna, FEKO Software, Voltage Standing Wave Ratio (VSWR), Input Impedance, Retutn Loss (S11) , Antenna Gain
Cite this paper: Abdelrahman Elleithy, Gonshin Liu, Ali Elrashidi, "Underground Wireless Sensor Network Communication Using Electromagnetic Waves Resonates at 2.5 GHz", Journal of Wireless Networking and Communications, Vol. 2 No. 6, 2012, pp. 158-167. doi: 10.5923/j.jwnc.20120206.01.
Article Outline
1. Introduction
- A wireless sensor network (WSN) consists of sensors used to monitor physical or environmental phenomena such as humidity, temperature, sound, vibration, pressure or motion and cooperatively pass the data through the network of sensors to a main location[1]. As wireless network sensors become smaller in dimension and cheaper, researchers are deploying them in environments that are unconventional for electromagnetic signaling[2]. One of those applications for wireless sensor network is underground wireless communication to monitor soil properties and then transmit the collected data to a node on the surface[3]-[8]. Wireless underground sensor network has a lot of applications including: environmental monitoring, infrastructure monitoring, location determination and border patrol and security monitoring[9, 10]. Wireless communication using electromagnetic signals suffers from high attenuation in soil, due to the absorption of the signal. So, the underground wireless communication can be characterized by high signal loss due to absorption and multi-path losses caused by soil molecules such as reflection and refraction[11]. The main advantages of using electromagnetic waves instead of sound are: first, electromagnetic waves reduce the latency due to faster propagation. Second, electromagnetic waves give a high data rate due to high frequency of the wave[12]. In this paper we discuss the propagation of electromagnetic waves in sandy soil, loamy soil and magnetite soil and study the effect of changing distance between the sensors and change the operating frequency, 2.5 GHz range[13]. The designed microstrip circular antenna with a high gain to overcome the path loss due to attenuation in the soil is also introduced in this paper.
2. Related Work
- There has been some work focusing on electromagnetic waves propagation through soil and water. N. Channmwe at al. introduced the empirical attenuation and relative permittivity values for different materials including soil at 300-700 MHz frequency range[14]. Reflection and refraction from the underground-air interface are also introduced in this paper. The path loss due to material absorption in underground propagation is presented by N. Peplinski. Path loss as a function of volumetric water content 5%, 10%, 15%, 20% and 25% for a frequency range 1.3-3 GHz is introduced in this paper[15].A bit error rate and path loss as a function in frequency and sensor depth for different volumetric water content are introduced by I. Akyildiz at el.[16]. There are several challenges in the design of wireless underground communication network such as network topology, reliability, localization and network architecture design.The communication through soil is represented as an electromagnetic wave transfer through the transmission line by T. Weldon and A. Rathore[17]. The operating frequency range is 1-2 GHz. In[18], the authors show that the soil composition has significant effects on the ground penetrating radar.
3. Effect of Soil Properties on Underground Communication
- The soil properties have a great effect on the underground communication using electromagnetic waves. Dielectric constant is most important parameter that affects the propagation in underground communication. Water content, density, particle size and temperature are also affecting the communication.
3.1. Water Content
- Signal loss through a given type of soil is depending on water concentration in soil. Increasing the water content of a soil makes the channel more power loss. As water content raise from dry the 13% volumetric, the losses per meter increased by 137 dB at 1 GHz frequency[17].
3.2. Density
- The path loss increases as the soil density is increasing. Also, the signal attenuation increases with increasing the soil density.
3.3. Particle Size
- There are three different types of soils according to particle size. Three major components are given in[18] as sand, silt and clay. Sandy soil is the smallest particle in size and gives a lower losses and clay soil gives the highest losses for its large particle size[19].
3.4. Temperature
- Dielectric properties are function of temperature, so the increasing in temperature leads to increase the signal attenuation in underground communication.
4. Antenna Background
- Underground communication needs a very efficient antenna for wireless sensor network communication. This antenna must meet a number of requirements for underground communication to overcome the high value of path loss due. This kind of antenna must has a high gain, above 10 dB, and should be small in dimension so that it can be fitted on the sensor surfaces. The most common antenna used for underground communication using electromagnetic signals is circular microstrip antenna[2].
4.1. Background
- A circular microstrip antenna is a popular for frequency range for Ultra High Frequency (UHF), from 300 MHz to 3 GHz, up to the millimeter wave range, from 30 GHz to 300 GHz, and has also found application in arrays. The circular antenna performance is not sensitive to small parameter variations, improving robustness to manufacturing tolerances. While the circular microstrip antenna provides reasonable wide-band performance, this is not a high performance antenna[20, 21].
4.2. Physical Description
- The circular microstrip antenna is easy to construct and can be very robust, but can become restrictively large at low frequencies. This antenna is an electrically large antenna with a one wavelength circumference. The gain is stable over a substantial band; however, the input impedance shows a large variation[22, 23].
5. Underground Signal Propagation
- The signal propagation in soil depends on the path loss in soil. Received power as a function of transmitted signal, path loss and antenna gain at the receiver end is given from Friis equation as shown in Equation 1[24].
 | (1) |
 | (2) |
 is the path loss in air and given by:
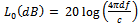 | (3) |
 is the path loss due to changing in medium and given by[26]:
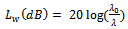 | (4) |
 | (5) |
 and
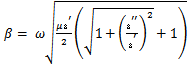
and  are the real and imaginary parts of the complex dielectric constant given by
  .
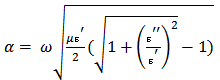
. is the path loss due to attenuation in medium and given by:
 | (6) |
 | (7) |
6. Reflection from Ground Interfaces
- The reflection from the surface and bottom depends on reflection coefficient at the interface between soil and air. The reflection coefficient is given by Equation 8[27].
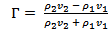 | (8) |
 | (9) |
 | (10) |
 and
and  are the amplitude and phase of the reflection coefficient respectively and Δ(r) is the difference between r and d.where r can be calculated as follow:
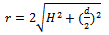 | (11) |
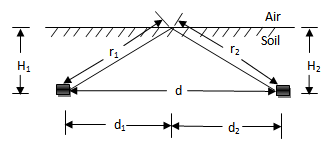 | Figure 1. Two-path channel model |
7. Results
- The effect of frequency on the path loss for different values of distance between sensors using different soil types is illustrated in the following sections. Nine different soil types are shown in Table 1 according to the water concentration in soil.
7.1. Path Loss Calculation
- The total path loss due to communication between sensors without reflection loss is shown in the next sections.
7.1.1. Sandy Soil
- The sandy soil is the normal pure soil. The Particle density, which is the weight per unit volume of the solid portion of soil, of normal soils is 2.65 g/cm3. The Bulk density, the oven dry weight of a unit volume of soil inclusive of pore spaces, of a soil is always smaller than its particle density and is about 1.6 g/cm3 and the pore space is 40%[28].The sandy soils with three different concentration of water are studied in this section. The path loss for the dry sand soil with relative permittivity ɛ`=2.55 and tangent loss is tan(δ)=0.0062, sandy soil 3.88% water with ɛ`=4.4 and tan(δ)=0.046 and sandy soil 18.8% water with ɛ`=20 and tan(δ)=0.13 at 2.5 GHz are given.
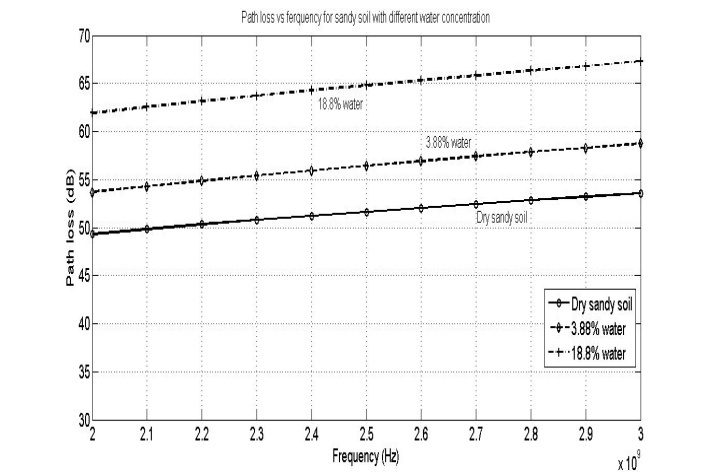 | Figure 2. Path loss (dB) as a function of frequency (GHz) for sandy soil at different water concentration at distance 1 m |
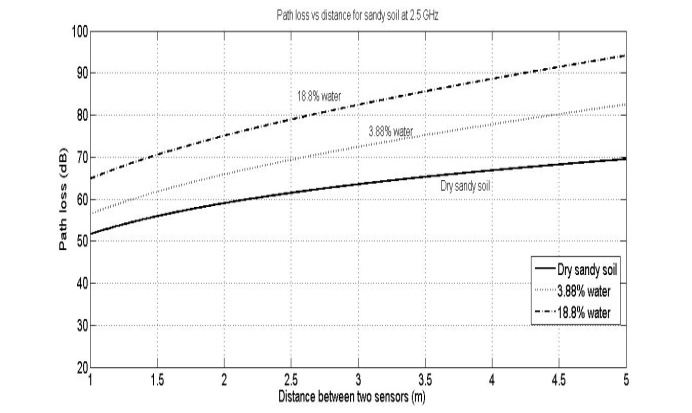 | Figure 3. Path loss (dB) as a function of distance between two sensors (m) at frequency 2.5 GHz for sandy soil at different water concentration |
 | Figure 4. Path loss (dB) as a function of frequency (GHz) for loamy soil at different water concentration at distance 1 m |
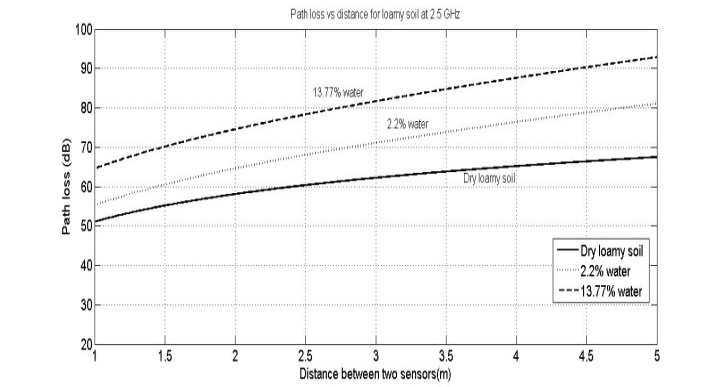 | Figure 5. Path loss (dB) as a function of distance between two sensors (m) at frequency 2.5 GHz for loamy soil at different water concentration |
7.1.2. Loamy Soil
- The Bulk density of the Loamy soil is 1.4 g/cm3 and the pore space is 47% which means the Loamy soil become finer in texture[29].The loamy soils with three different concentrations of water are introduced in this section. The path loss for the dry loamy soil with relative permittivity ɛ`=2.44 and tangent loss is tan(δ)=0.0011, loamy soil 2.2% water with ɛ`=3.5 and tan(δ)=0.04 and loamy soil 13.77% water with ɛ`=20 and tan(δ)=0.12 at 2.5 GHz are introduced.The frequency as a function on the path loss for different water concentration for loamy soil at distance 1 m separation between sensors is illustrated in Figure 4. Increasing water concentration leads to increasing path loss. In Figure 5, the effect of distance on a path loss is illustrated at frequencies 2.5 GHz for loamy soil.
7.1.3. Magnetite Soil
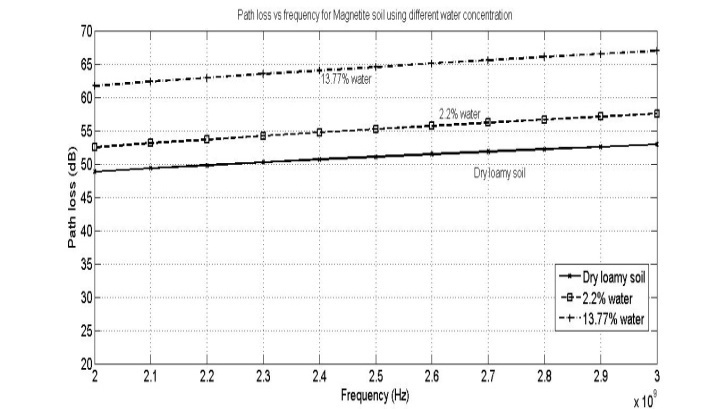
- A sandy soil with a large amount of heavy minerals such as magnetite is called a magnetite soil. The particle density is getting higher for magnetite soil[30]. The magnetite soil is a pure soil contains iron oxide particles[31]. The magnetite soils with three different concentration of water are introduced in this section. The path loss for the dry magnetite soil with relative permittivity ɛ`=1.05 and tangent loss is tan(δ)=0.029, magnetite soil 4.8% water with ɛ`=8.3 and tan(δ)=0.22 and magnetite soil 11% water with ɛ`=30 and tan(δ)=0.32 at 2.5 GHz are introduced.The frequency as a function on the path loss for different water concentration for magnetite soil at distance 1 m separation between sensors is illustrated in Figure 6. Increasing water concentration leads to increasing path loss. In Figure 7, the effect of distance on a path loss is illustrated at frequencies 2.5 GHz for magnetite soil.
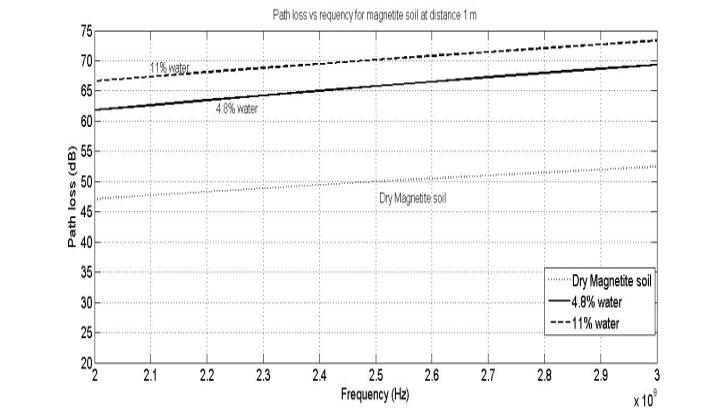 | Figure 6. Path loss (dB) as a function of frequency (GHz) for magnetite soil at different water concentration at distance 1 m |
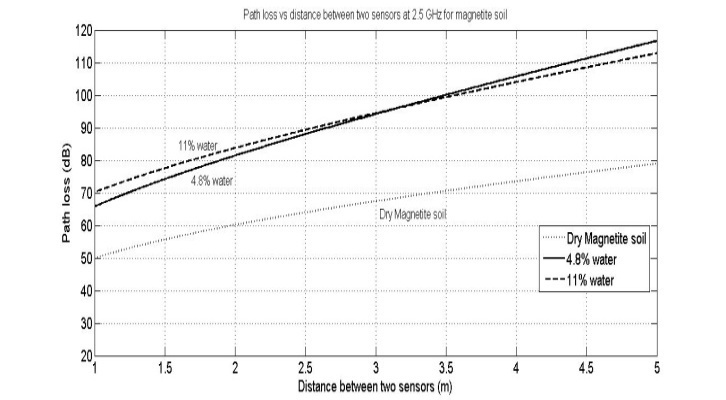 | Figure 7. Path loss (dB) as a function of distance between two sensors (m) at frequency 2.5 GHz for magnetite soil at different water concentration |
7.2. Reflection Calculation
- An extra loss due to reflection is obtained. The reflection from soil air interface is studied in this section. Some approximations are assumed here to simplify the simulation as in Figure 1 as follows: • The sensors are in the middle of the sand height, H1= H2=H.• All multipath are equal, r1= r2=r.• Distances d1= d2 = d.The path loss due to reflection from soil surface interface is calculated as a function of sensor depth H at distance between sensors 1 m and 2.5 GHz frequency for three different soils. As shown in Figure 8, the effect of water concentration on the reflection loss is very high for the dry soil. As the water concentration and sensor depth increased, the path loss decreased to be negligible at depth 5 m. The same conclusion is obtained in Figure 9. Path loss due to reflection as a function of depth at 2.5 GHz and distance 1 m is illustrated in Figure 9 for loamy soil. Reflection for magnetite soil at different water concentration after 3 m depth is almost vanishing as shown in Figure 10.
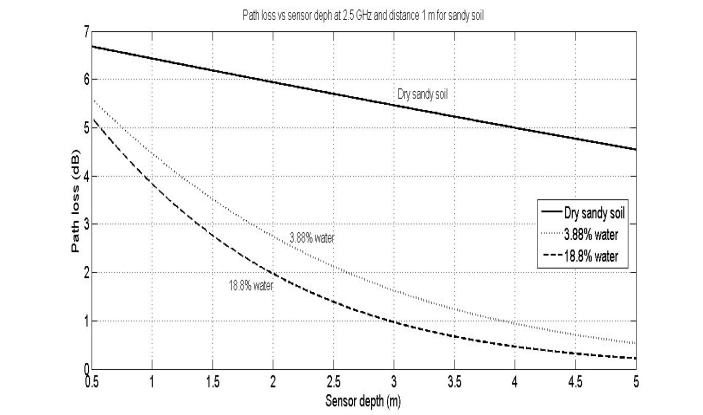 | Figure 8. Path loss (dB) as a function of sensor depth (m) at frequency 2.5 GHz and distance between two sensors 1 m for sandy soil at different water concentration |
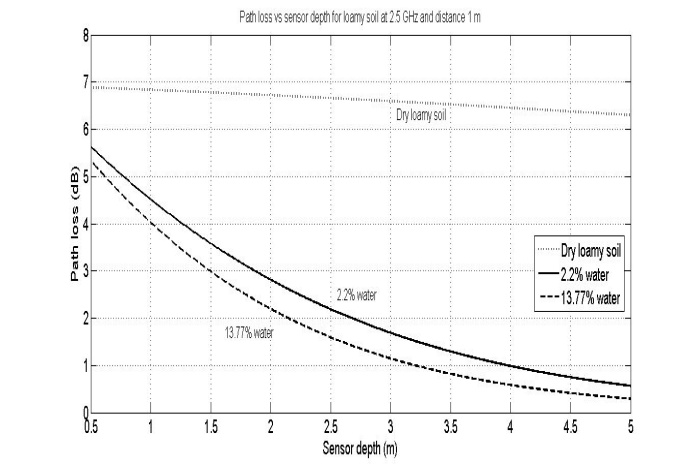 | Figure 9. Path loss (dB) as a function of sensor depth (m) at frequency 2.5 GHz and distance between two sensors 1 m for loamy soil |
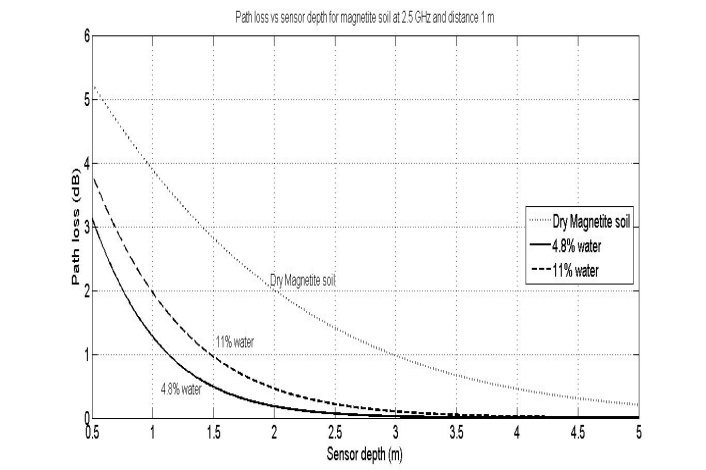 | Figure 10. Path loss (dB) as a function of sensor depth (m) at frequency 2.5 GHz and distance between two sensors 1 m for magnetite soil at different water concentration |
7.3. Antenna Design
- Circular microstrip antenna operates at 2.5 GHz design is shown in Figure 11. FEKO software is used to design and simulate this antenna. The dimensions of the designed antenna are as follow: antenna patch diameter is 30.36 mm, substrate height is 1.5 mm, substrate length is 75.9 mm, substrate width is 75.9 mm and the dielectric constant is 4.35.
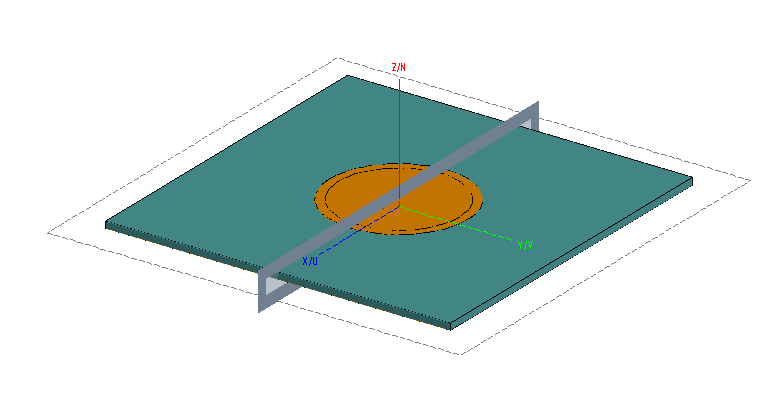 | Figure 11. Designed circular microstrip antenna operates at 2.5 GHz |
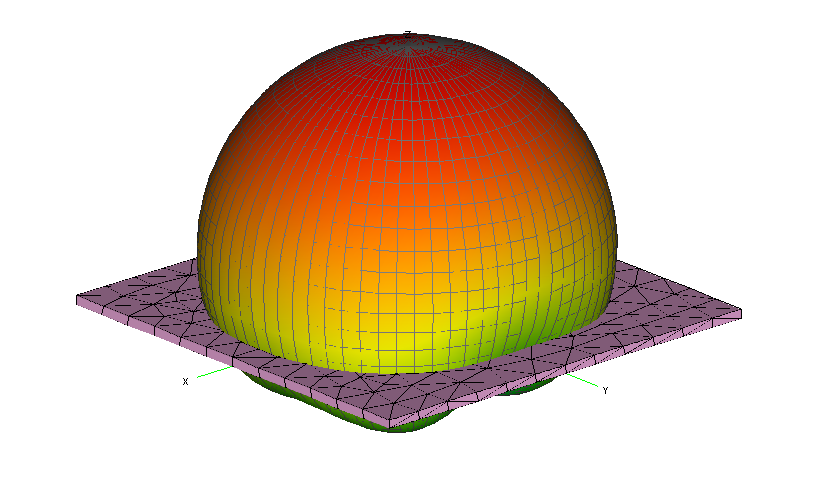 | Figure 12. Radiation pattern of microstrip circular (dB) antenna operates at 2.5 GHz |
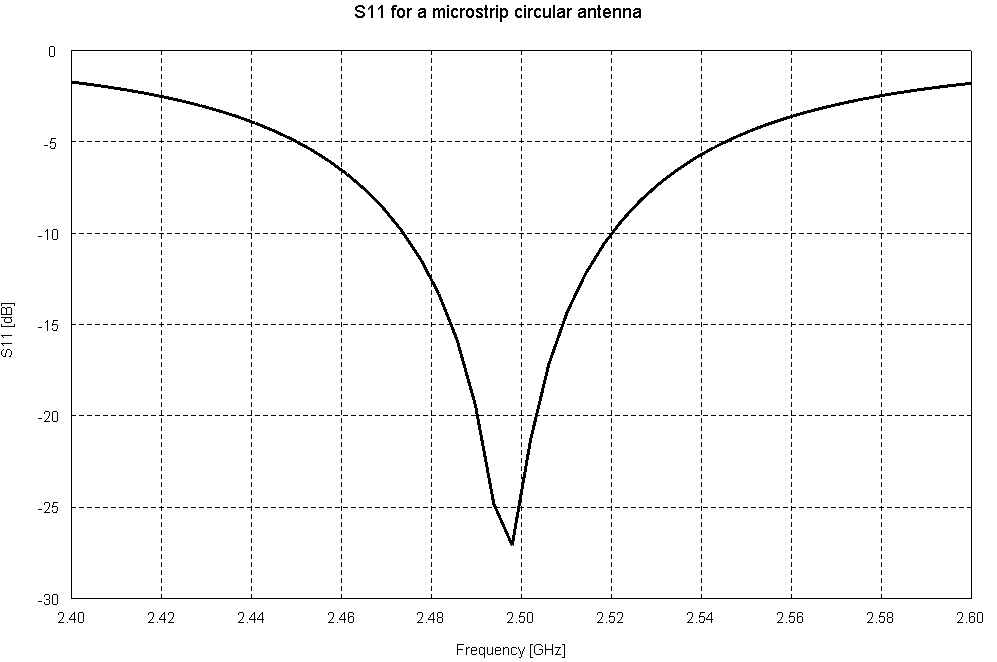 | Figure 13. Return loss (S11) as a function of frequency (GHz) |
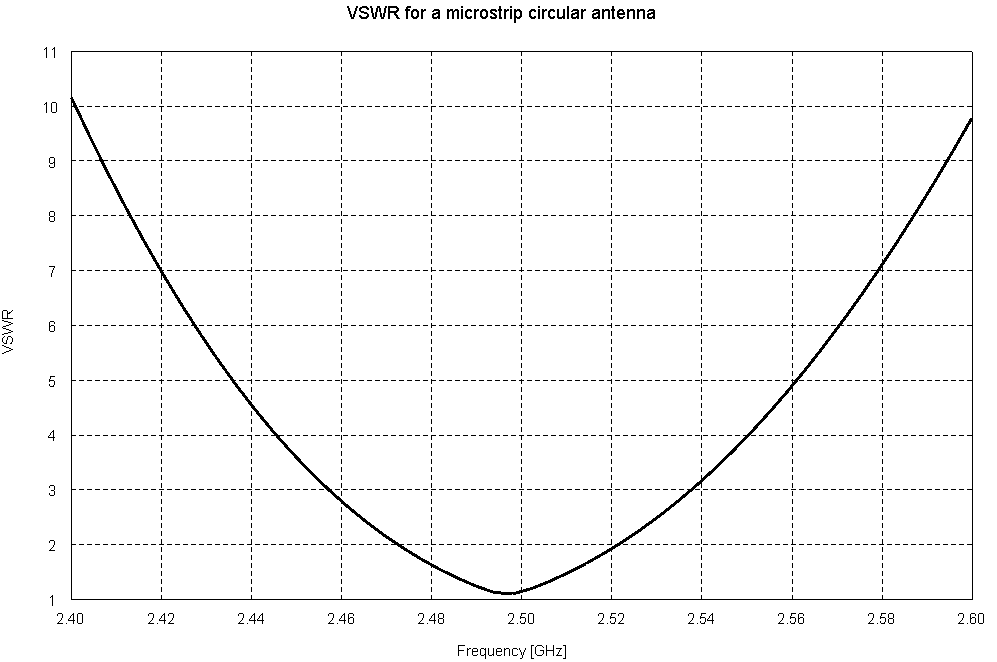 | Figure 14. Voltage standing wave ratio as a function of frequency (GHz) |
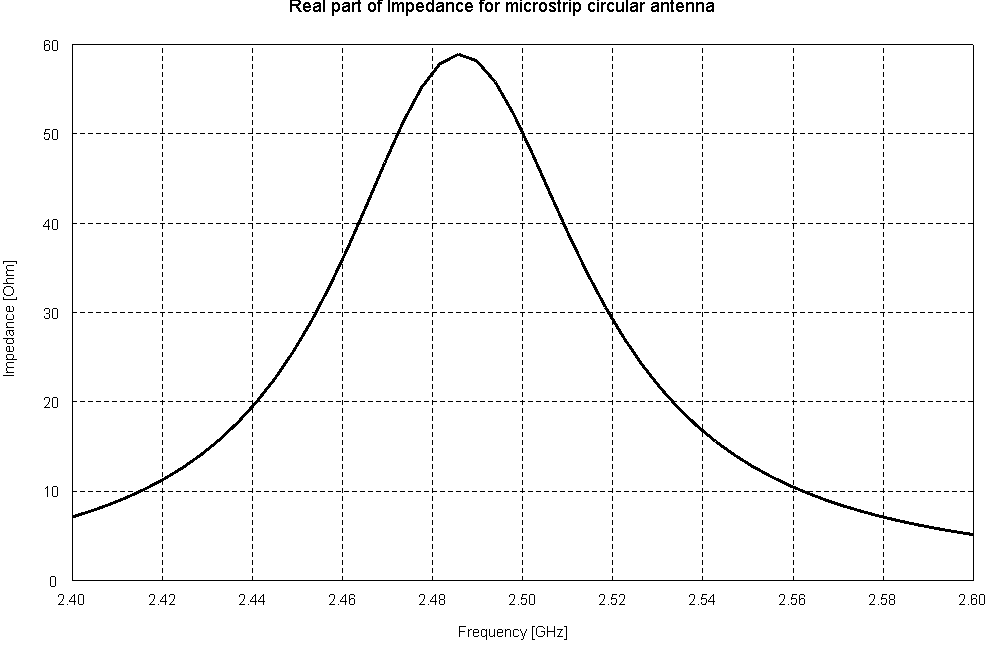 | Figure 15. Input impedance as a function of frequency (GHz) |
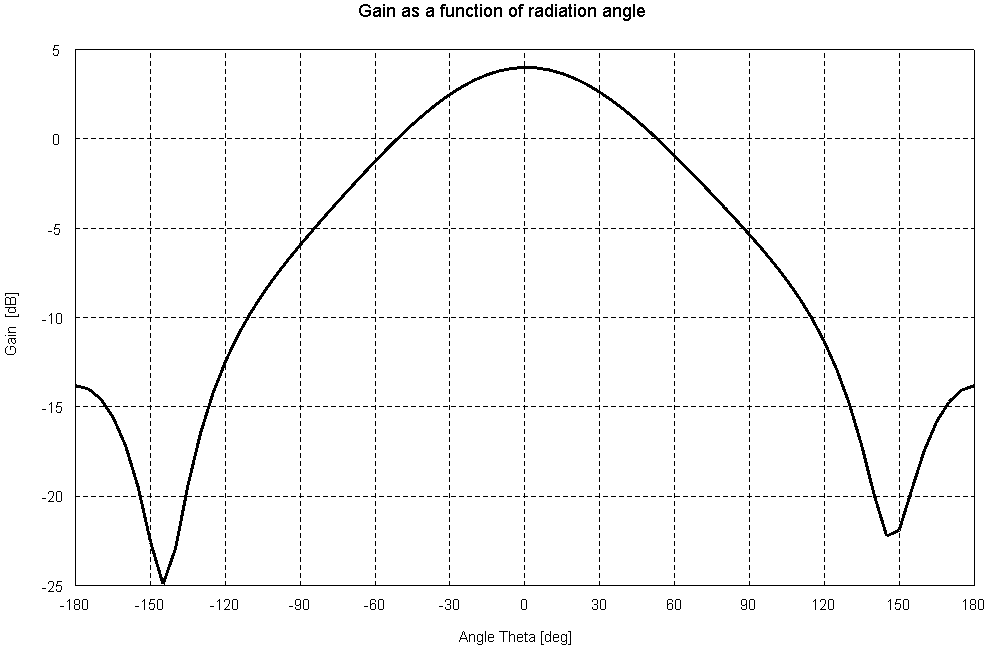 | Figure 16. Antenna gain as a function of radiation angle at 2.5 GHz |
8. Conclusions
- A mathematical model for path loss due to attenuation of electromagnetic waves propagates in different types of soil resonates at 2.5 GHz is introduced in this paper. The reflection of electromagnetic waves at the air-soil interface is given as a function of sensor depth in soil and distance between sensors. Three different types of soil are given in this paper, sandy, loamy and magnetite soil. For lower permittivity, the path loss is a low value. The higher distance between sensors leads to higher losses is produced.The reflection from air-soil interface is negligible in case of deep soil, after 3 m, except for dry sandy soil and dry loamy soil. A high gain microstrip circular antenna is designed and simulated using FEKO software. Return loss, voltage standing wave ratio, real part of input impedance and gain is also given in this paper. S11 of the designed antenna is -25 dB at 2.5 GHz, which is very efficient value for underground wireless communication to overcome the high path loss due attenuation.
References
| [1] | W. Dargie and C. Poellabauer, "Fundamentals of Wireless Sensor Networks: Theory and Practice," John Wiley and Sons, 2010. |
| [2] | K. Hunt, J. Niemeier and A. Kruger, “RF Communications in Underwater Wireless Sensor Networks,” IEEE International Conference on Electro/Information Technology (EIT), pp. 1-6, Oct., 2010. |
| [3] | J. Tiusanen, “Attenuation of a Soil Scout Radio Signal,” Biosystems Eng., vol. 90, no. 2, pp. 127-133, Feb. 2005. |
| [4] | J. Tiusanen, “Validation and Results of the Soil Scout Radio Signal Attenuation Model,” Biosystems Eng., vol. 97, no. 1, pp. 11-17, May 2007. |
| [5] | J. Tiusanen, “Wireless Soil Scout Prototype Radio Signal Reception Compared to the Attenuation Model,” Precis. Agric., vol. 10, no. 5, pp. 372-381, Oct. 2009. |
| [6] | I. Akyidiz “A Mode-Based Approach for Channel Modeling in Underground Tunnels under the Impact of Vehicular Traffic Flow,” IEEE Trans. on Wireless Communication, vol. 10, no. 10, pp. 3222-3231, Oct. 2011. |
| [7] | E. Stuntebeck, D. Pompili and T. Melodia, “Wireless Underground Sensor Networks Using Commodity Terrestrial Motes,” 2nd IEEE Workshop on Wireless Mesh Networks, Reston, pp. 112-114, 2006. |
| [8] | J. Huang, R. Kumar, A. Kumar and R. Weber, “Development of a Wireless Soil Sensor Network,” ASABE International meeting, Providence, Paper 080025, 2008. |
| [9] | N. Chaamwe, W. Liu and H. Jiang, “Wave Propagation Communication Models for Wireless Underground Sensor Networks” 12th IEEE International Conference on Communication Technology (ICCT), pp. 9-12, Nov. 2010. |
| [10] | I. Akyildiz, Z. Sun and M. Vuran, “Signal Propagation Techniques for Wireless Underground Communication Networks” Physical Communication, vol. 2, pp. 167-183, Sep. 2009. |
| [11] | I. Akyildiz and E. Stuntebeck, “Wireless Underground Sensor Networks: Research Challenges” Ad Hoc Networks (Elsevier), vol. 4, no. 6, pp. 669-686, Nov. 2006. |
| [12] | X. Che, I. Wells, P. Kear, G. Dickers, X. Gong and M. Rhodes, “A Static Multi-hop Underwater Wireless Sensor Network Using RF Electromagnetic Communications,” 29th IEEE International Conference on Distributed Computing Systems Workshops, Montreal, Canada, pp. 460-463, 2009. |
| [13] | R. Von, “Dielectric Materials and Applications” M.I.T press, Cambridge, MA, 1954. |
| [14] | M. Rhodes, “Electromagnetic Propagation in Seawater and its Value in Military Systems,” SEAS DTC Technical Conference, Edinburg, UK, 2007. |
| [15] | N. Peplinski, F. Ulaby and M. Dobson, “Dielectric Properties of Soils in the 0.3-1.3 GHz range” IEEE Transaction on Geosciences and Remote Sensing vol. 33, no. 3, pp. 803-807, 1995. |
| [16] | I. Akyildiz and Z. Sun “On capacity of magnetic induction-based wireless underground sensor networks”, IEEE INFOCOM, 2012 Proceedings, pp. 370 – 378, March 2010. |
| [17] | T. Weldon and Y. Rathore, “Wave Propagation Model and Simulation for Landmine Detection” Tech. rep., University of N. Carolina at Charlotte, 1999. |
| [18] | T. Miller, B. Bochers, J. Hendrickx, S. Hong, L. Dekker and C. Ritsema, “Effect of Soil Physical Properties on GPR for Landmine Detection” 5th International Symposium on Technology and the Mine Problem, 2002. |
| [19] | R. Musaloiu, A. Terzis, A. Szalay, J. Cogan and J. Gray, “Life Under Your Feet: A Wireless Soil Ecology Sensor Network” EmNet’06, Pro. of the 3rd IEEE Con. On Embeded Networked Sensors, 2006. |
| [20] | L. Jui-Han, “Bandwidth enhancement design of single-layer slotted circular microstrip antennas” IEEE Transactions on Antennas and Propagation, vol. 51, Issue 5, pp. 1126-1129, May 2003. |
| [21] | P. Zade, S. Khade and N. Choudhary, “Modeling and Designing of Circular Microstrip Antenna for Wireless Communication” 2nd International Conference on Emerging Trends in Engineering and Technology (ICETET), pp. 1189-1194, Dec. 2009 |
| [22] | N. Zakaria, A. Sulaiman and M. Latip, “Design of a circular microstrip antenna” IEEE International RF and Microwave Conference, pp. 289-292, Dec. 2008. |
| [23] | C. Sim, L. Kuang-Woei and R. Jeen-Sheen, “Design of an annular-ring microstrip antenna for circular polarization” IEEE Antennas and Propagation Society International Symposium, vol. 1, pp. 471-474, June 2004. |
| [24] | G. Stuber, “Principles of Mobile Communication,” Klumer Academic Publishers, 1996, 2001. |
| [25] | S. Ramo, J. Whinnery and T. Van Duzer, Fields and Water for Communications Electronics, John Wiley and Son, New York, 1994. |
| [26] | J. Wait, Electromagnetic Wave Theory, Harper and Row, New York, 1985. |
| [27] | D. Cheng, “Field and Wave Electromagnetics,” Addison Wesley Publisher, 2nd edition, Jan., 1989. |
| [28] | P. Birkeland, Soils and Geomorphology: Oxford University Press, New York, 1984. |
| [29] | G. Blake and K. Hartge, Bulk Density, in A. Klute, ed., Methods of Soil Analysis, Part I. Physical and Mineralogical Methods: Agronomy Monograph no. 9 (2nd ed.), 1986. |
| [30] | B. Brasher, D. Franzmeier, V. Valassis, and S. Davidson, Use of saran resin to coat natural soil clods for bulk density and moisture retention measurements: Soil Science v. 101, p. 108, 1966. |
| [31] | A. Tisdall, Comparison of methods of determining apparent density of soils, Australian Journal of Agricultural Research, v. 2, pp. 349-354, 1951. |