-
Paper Information
- Next Paper
- Previous Paper
- Paper Submission
-
Journal Information
- About This Journal
- Editorial Board
- Current Issue
- Archive
- Author Guidelines
- Contact Us
Journal of Wireless Networking and Communications
p-ISSN: 2167-7328 e-ISSN: 2167-7336
2012; 2(5): 126-135
doi: 10.5923/j.jwnc.20120205.07
An Autonomous Group Mobility Prediction Model for Simulation of Mobile Ad-hoc through Wireless Network
Walisa Romsaiyud 1, Wichian Premchaiswadi 1, Nucharee Premchaiswadi 2
1Graduate School of Information Technology, Siam University, 38 Petkasem rd., Prasri-charoen, Bangkok, 10160, Thailand
2Faculty of Information Technology, 110/1-4 Dhurakij Pundit University, Prachachuen rd., Laksi, Bangkok, 10210, Thailand
Correspondence to: Walisa Romsaiyud , Graduate School of Information Technology, Siam University, 38 Petkasem rd., Prasri-charoen, Bangkok, 10160, Thailand.
| Email: |  |
Copyright © 2012 Scientific & Academic Publishing. All Rights Reserved.
Group mobility models for ad-hoc wireless networks are frequently used with the purpose of learning the pattern of mobile multi-nodes which move together towards a common destination. Though, network nodes in a mobile Ad-hoc network move in some motion patterns - called mobility models – but there is still a lack of study on the new parameters that are satisfactory for Ad-hoc network partition prediction. Normally, network partitioning is considered as the origin for numerous unexpected serious disruptions in network routing and upper layer applications. Consequently, by exploiting the group mobility pattern, we minimized the extent of such disruptions in an effective way for mobile group users. In this paper, we proposed a new portrayal of group mobility derived from the existing group mobility models available in hand (as secondary data). In general, our model consists of two steps; 1) suggesting a discriminative pattern for group users, and 2) developing a group users’ mobility prediction model. Moreover, in our experiments, we used a simulation technique to improve the performance in terms of precision and recall parameters. In order to take full advantage of significance and prediction of the mobility model, GMP (Group Mobility Pattern) and corruption factors were investigated. The results showed that our method is more accurate in making predictions compared with the two existing methods (MC/MT and TM) designated in this study.
Keywords: Mobile Ad-hoc Network (MANET), Group Mobility Models, Random Waypoint, Realistic Mobility Model, Mobility Patterns
Cite this paper: Walisa Romsaiyud , Wichian Premchaiswadi , Nucharee Premchaiswadi , "An Autonomous Group Mobility Prediction Model for Simulation of Mobile Ad-hoc through Wireless Network", Journal of Wireless Networking and Communications, Vol. 2 No. 5, 2012, pp. 126-135. doi: 10.5923/j.jwnc.20120205.07.
Article Outline
1. Introduction
- A Mobile Ad-hoc Network is an autonomous system of mobile devices connected through wireless ad-hoc links. Mobility management in mobile computing environments covers the methods for storing and updating the location information of mobile users who are served by the system. A hot topic in mobility management research field is mobility prediction. Mobility prediction can be defined as the prediction of a mobile user’s next movement where the mobile user is traveling between the cells of a PCS or GSM network. The predicted movement can then be used to increase the efficiency of PCSs. By using the predicted movement, the system can effectively allocate resources to the most probable-to-move cells instead of blindly allocating excessive resources in the cell-neighbourhood of a mobile user. Effective allocation of resources to mobile users would improve resource utilization and reduce the latency in accessing the resources. Broadcast program generation can also benefit from predicted mobility patterns, since the data items can be broadcast to the cell wherethe users are moving[1]. Accurate prediction of location information is also crucial in processing location-dependent queries of mobile users. When a user submits a location-dependent query, the answer to the query will depend on the current location of the user[2]. Many application areas including health care, bioscience, hotel management, and the military benefit from efficient processing of location-dependent queries. With effective prediction of location, it may also be possible to answer the queries that refer to the future positions of users.Up until now, there has been a considerable amount of research on mobility management. Most of the research has focused on the problem of location update, which is concerned with the reporting of the up-to-date cell locations by the mobile users to the PCS network [3]. Location update should be performed whenever a mobile user moves to another cell in the network to be able to track the exact location of each mobile user. When an incoming call arrives, the network simply routes the call to the last reported location of the mobile user. Compared to the amount of work performed on location update, little has been done in the area of mobility prediction [4–6, 8-10, 12]. These works have some deficiencies, which are explained as the following:— They seldom attempt to find mobility patterns. Instead, the patterns are assumed to be already available. These patterns are then used for mobility prediction.— Habitually [7-9], prediction models in such cases are rooted in probability distribution of the speed and direction of the mobile user. For collecting such information, highly sophisticated and expensive tools such as GPS (Global Positioning System) are needed.— Most of the methods studied in these works are highly sensitive to a change in a mobile user’s path. For this reason, the prediction accuracy drops in case of noisy data. These methods do not consider the difference between the randomness and the regularity in users’ paths (i.e., they do not distinguish a random movement and a regular movement of a user). The general idea behind our method is to distinguish regularity and randomness in user movement. We examine real user mobility models for building an ad-hoc peer-to-peer network. Previous works explore randomness and regularity as two individual concepts and do not take them together for ad-hoc networks. Our objective is to examine whether a network based on the pair-wise and non-pair-wise contacts can be built or not. The novelty of our work is the conjecture that there is both regularity and randomness in user mobility which can provide complete coverage of the network. We create a user study to test our hypothesis using sequential pattern mining. We mine the access patterns of a user travelling in each node. In order to to overcome the deficiencies, we develop an effective mobility prediction algorithm as the following: In the first phase of our two-phase algorithm, movement data of mobile user is mined for discovering regularities in inter-cell movements. These regularities are called mobility patterns. Mobility rules are then extracted from the mobility patterns in the second phase of our algorithm. The first two phases of our prediction algorithm, which are user mobility pattern mining and mobility rule generation, are accomplished offline through the system. Nevertheless, the mobility prediction is accomplished online. It means that whenever a user intends to make an inter-cell movement, a prediction request is sent to the system and the prediction is made by the system using our mobility rule based prediction algorithm [10-12]. Going over the main points again, the key contributions of our works are:— We address the problem of group mobility movement from several parameters that directly affect Ad-hoc network partition prediction (this is the initial effort to solve this problem).— We use sequential pattern mining to scrutinize the mobility patterns of users in mobile computing environments. Afterwards, we propose prediction accuracy model.— We formalize our problem by introducing a principled group mobility model and propose an objective function for our problem.— We evaluate the results obtained from simulation model. We apply group mobility pattern (GMP) algorithm with the intention of making best use of the mobility prediction algorithm.Consequently, the effectiveness and advantage of our method are validated by a wide-ranging empirical study on a mobile user travels on a 15 by 15 hexagonal shaped network which gives a total of 225 base stations. We construct the training and test sets. The number of GAPs in training set is 9000 and the number of GAPs in test set is 1000 for supporting the experiment. The remainder of the article is organized as follows: Section 2 presents some the background that related on the mobility models. Section 3 addresses related work. Section 4 describes the group mobility prediction based on mobility rules. Section 5 describes the experimental study and the results. Section 6 presents a conclusion and discusses some perspectives and ideas for future work.
2. Background
- In this section, we described the definition terms that related on the mobility models. We classified into three categories as followings:
2.1. Random Waypoint Mobility Model
- The Random Waypoint Mobility Model [13-14] is an extension of the Random Walk model. It introduces a pause after the node has reached its destination point. The pause time is uniformly distributed between a minimum and a maximum value. After the pause, the node starts moving towards the next randomly chosen destination point and the process is repeated again. The distribution of the nodes in the simulation area and the distribution of the node speeds vary over the simulation time. Even thought the speed of a node is chosen from a uniform distribution, the distribution of the node speed sampled after a long enough time will differ from the uniform distribution where the speed for the next trip is chosen from. A lower speed is more likely to be.
2.2. Reference Point Group Mobility Model
- Reference Point Group Mobility Model (RPGM)[13-15] model is one of the typical group mobility models, and it has a logical center node as team leader that determined the group’s movement behavior. The movement of group leader at time, t can be represented by motion vector
 ,[14] provides the general motion trend of the whole group. The motion vector
  can be randomly chosen or carefully designed based on certain predefined paths. The movement of group members is significantly affected by the movement of its group leader. For each node, mobility is assigned with a reference point that follows the group movement. Upon this predefined reference point, each mobile node could be randomly placed in the neighbourhood. The formally, motion vector of group member, I, at time t,
  , can be described as:
 | (1) |
 is a random vector deviated by group member i from its own reference point. The vector
  is an independent identically distributed random process whose length is uniformly distributed in the interval[0,
  ] (where
  is maximum allowed distance deviation) and whose direction is uniformly distributed in the interval[0, 2
 ].
]. 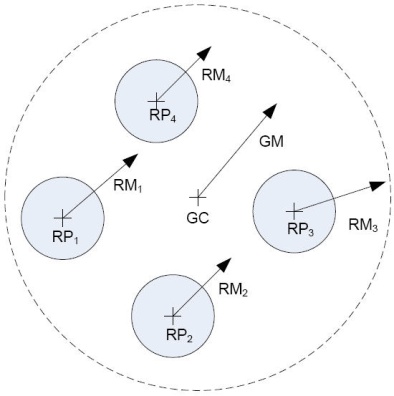 | Figure 1. Reference Point Group Mobility Model[3, 6] |
2.3. The Reference Velocity Group Mobility Model
- The Reference Velocity Group Mobility Model (RVGM)[16, 17] extended the RPGM model by proposing a velocity representation of the mobility group and the mobile nodes. The node movement is expressed by a velocity vector v = (vx,vy)T; where vx and vy denote the velocity components in the x and y directions, respectively. In RVGM model, the velocity vector of i-th node in j-th group is obtained as following:
 | (2) |
3. Related Work
- In this section, we will first present other works related to the sequential pattern mining problem. Second, we present the research for predicting the mobile users’ group movement behaviour. Third, we present an adaptive algorithm for location management.The sequential pattern mining problem was discussed in[7, 13]. For our domain, the mobile users are assumed to be moving between the cells of a PCS network. The algorithms proposed in[8] cannot be applied directly to our domain for mining mobility patterns, because these algorithms do not take into account the network topology while generating the candidate patterns. This weakness of the proposed algorithms gives rise to generation of candidate patterns, which cannot exist as mobility patterns on the corresponding network, since only the sequence of neighbouring cells of the network can be considered as a mobility pattern. Therefore, the number of candidates generated can be extremely high, and this factor can dramatically reduce the performance of the mining algorithm. In [1, 14], sequential pattern mining is applied to the domain of predictive Web prefetching. Web prefetching can be defined as deriving users’ future requests for Web documents based on their previous requests. For effectively predicting the users’ future requests, user access patterns are mined from the Web logs of users’ previous requests and then these patterns are used for prefetching. The method presented in[1, 7, and 13] extends existing algorithms for mining sequential patterns in order to take the graph structure of the corresponding Web site into account during support counting, candidate generation and pruning. As we describe in Section III, in the first phase of our mobility prediction algorithm, we generalize the method presented in[1, 13] to be able to mine mobility patterns of users in mobile computing environments. In the latter stages of our algorithm, mobility rules are extracted from the mobility patterns, and by using these rules, user movements are predicted. There has been a considerable amount of research in mobility prediction, as well. The work presented in[5] is among the pioneering research for predicting the mobile users’ movement behaviour. In that work, user’s moving behaviour is modelled as repetitions of some elementary movement patterns which are indeed circular and straight line patterns. In order to estimate the future location of a user, a mobile motion prediction (MMP) algorithm is proposed. However, the MMP algorithm is highly sensitive to random movements of the user. It is reported in [5] that as the random movements of the user increase the performance of MMP decreases linearly. The work in [6] proposes a two level scheme, which combines a local with a global prediction model. The top level is the Group mobility model (GMM), whose resolution is determined in terms of the cells crossed by a mobile user during the lifetime of the connection. The bottom level is the local mobility model (LMM), whose resolution is determined in terms of a 3-tuple sample space (speed, direction, position) that varies with time. LMM is used to model the intra-cell movements of the mobile users. On the other hand, GMM is used to predict the inter-cell movement trajectory of a user by matching the user’s actual path to one of the existing ‘‘mobility patterns’’. For this purpose pattern matching techniques are used. Premchaiswadi W. et. al.[10], enhance both the link layer and network layer handovers using location’s information driven from the mobile phone’s cell tower for tracking users. However, the weakness of the work is revealed at this point because there is no method presented in[4] to discover these mobility patterns, Gauss–Markov[3] model is introduced, where a mobile user’s current velocity and location is correlated in time to a various degree. Based on the Gauss–Markov model, a mobile user’s future location is predicted by the network based on the information gathered from the user’s last report of location and velocity. In [13], Aljadhai and Znati use a first-order autoregressive filter in order to determine the direction of movement of a user. It is claimed in that work that the proposed method guarantees that the predicted mobile direction is not affected by small deviations in the mobile user’s direction. In the work, Romsaiyud W. and Premchaiswadi W.[12] for location prediction cell-to-cell transition probabilities of a mobile user is calculated by the help of the previous inter-cell movements of the user, and then recorded to a matrix. Based on this, resource allocation is done at the k most probable cells that are in the neighbourhood of the current cell. Here k is a user-defined parameter. This method is called Mobility Prediction based on Transition Matrix (TM). An adaptive algorithm for location management is proposed in[16]. By building and maintaining a dictionary of individual user’s path updates, the proposed on-line algorithm can learn mobile users’ mobility patterns.
4. Group Mobility Prediction Based on Mobility Rules
- In this section, we presented two algorithms: group mobility pattern (GMP) mining for generating of group mobility rules using the mined GMPs, and proposed the mobility prediction.
4.1. Group Mobility Patterns
- We define a group mobility pattern (GMP) as a sequence of neighbouring cells in the coverage region network [12]. The consecutive cells of a GMP should be neighbours because the users cannot travel between non neighbour cells. Indeed, GMPs correspond to the expected regularities of the group actual paths. In order to mine the GMPs from group actual paths (GAPs), sequential pattern mining [12, 14] can be used. Sequential pattern mining has been previously used and examined in various research domains. One such work has been performed in the domain of web log mining [14, 15, 18- 19]. In that work, sequential pattern mining is used to mine the access patterns of a user while visiting the pages of web sites. This method assumes the web pages to be the nodes and the links between these pages to be the edges of an unweighted directed graph, G. Then, sequential pattern mining is applied to web logs by considering G.We design a new method that is convenient for our domain, by generalizing the method of[12, 14] and applying it for GMP mining. This new method employs— A different definition of the graph G, and— A new method for support counting, which generalizes the method presented in[12, 14-16].From the group mobility pattern for traverse in the graph, assume that we have two GAPs, A = (a1, a2, …., an) and B=(b1, b2, …., bm). B is a subsequence of A, if there exist integers
 such that bk = aik, for all k, where 1
 . In other words, B is a subsequence of A, if all cells in B also exist in A while keeping their order in B (but they do not need to be consecutive in A). Let us give an example by using the coverage region given in Figure. 2: assume A = (c3, c4, c0, c1, c6, c5), then B = (c4, c5) will be a length-2 subsequence of A. In other words, the GAP B is contained by the GAP A.
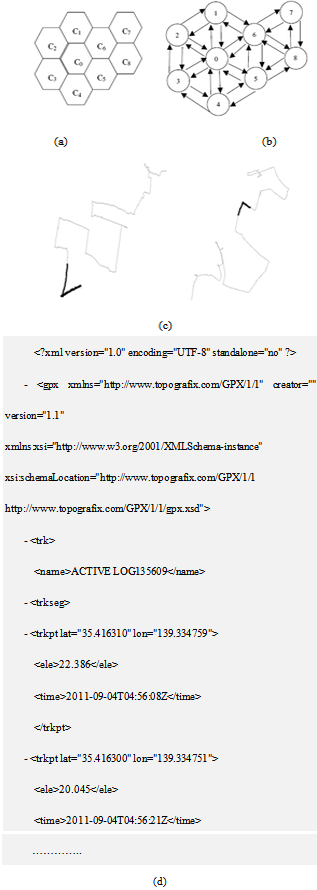 | Figure 2. An example coverage region (a) the corresponding graph G (b)[11], User mobility traversal (c) and XML trace file that collects data from the starting point to the destination point (d) |
 the patterns which have a length of one 2: k=13: L
  4: while Ck
  5: foreach GAP a
  D6: S = {s | s
  Ck and s is a subsequence of a}7: foreach s
  S8: s.count = s.count+s.suppInc 9: Lk ={ s|s
  Ck, s.count
  suppmin}10: L = L
  Lk 11: Ck+1
  CandidateGeneration (Lk, G),
  Ck+112: c.count = 013: k= k+1 14: return LFrom Pseudocode I, we illustrate this method of support counting treats a highly corrupted candidate pattern and a slightly corrupted (or even not corrupted at all) candidate pattern in the same way and assigns the support value of 1 to both patterns. Since this method is unfair for the context of mobile motion prediction, unlike the work in[11, 13- 14], our support counting method considers the degree of corruption, i.e., we differentiate the support given to a slightly corrupted pattern and to a highly corrupted pattern. In our method, we calculate the support assigned to a candidate pattern B by a GAP A (i.e., suppInc) by using the following formula:
 | (3) |
4.2. Mobility Prediction Algorithm
- The pseudo-code for the mobility prediction phase of our algorithm is presented in a Preudocode II. In this phase, the next movement of the mobile group users’ are predicted. The prediction procedure can be summarized as follows: Assume that a mobile user has followed a path P = (c1, c2, . . ., ci-1 ) up to now. The algorithm finds out the rules whose head parts are contained in path P, and also the last cell in their head is ci-1. We call these rules the matching rules. We store the first cell of the tail of each matching rule along with a value which is calculated by summing up the confidence and the support values of the rule in an array of such tuples. The support of a rule is the support of the GMP from which the current rule is generated. The tuples of this array are then sorted in descending order with respect to their support plus confidence values. While sorting the matching rules, both the support and confidence values of a rule should be taken into consideration to select the most confident and frequent rules.Pseudocode II. GroupMobilityPrediction ModelInput: Current trajectory of the user, P= (c1, c2,…,ci-1)Set of mobility rules, RMaximum predictions made each time mOutput: Set of predicted cells, GCells 1: GCells =
 2: k=13: foreach rule r: (a1, a2,..,aj)
  (aj+1,…,ak)
  R4: if (a1,a2,..,aj) is contained by P=(c1,c2,..,ci-1) and aj = ci-15: MatchingRules MacthingRules
  r6: TupleArray[k] = (aj+1, r.confidence+r.support)7: k = k+18: TupleArray
  sort(TupleArray)9: index = 010: while (index < m && index < TupleArray.length)11: GCells
  GCells
  TupleArray[index]12: index = index+113: return GCellsFrom Pseudocode II, we illustrate this method of parameter, m; which is the maximum number of predictions that can be made each time the user moves. For prediction, we select the first m tuples from the sorted tuples array[12, 21, 26-27]. Then the cells of these tuples are our predictions for the next movement of the mobile user group. It means that we use the first m matching rules that have the highest confidence plus support value for predicting the group user’s next movement.
5. Experimental Results
- For simulation, we have adapted the simulation model which is presented in our earlier work[23, 29-30]. In this model, it is assumed that a mobile user travels on a 15 by 15 hexagonal shaped network which gives a total of 225 base stations. In order to generate the group actual paths (GAPs), first a number of group mobility patterns (GMPs) is generated. The length of a GMP is determined by a uniform distribution with a mean length l. Each GMP is taken as a random walk over the hexagonal network[26]. There are two types of GAPs generated. The first type consists of GAPs that follow a GMP and the second type consists of outliers (i.e., those which do not follow a pattern). The ratio of the number of outliers to the number of GAPs that follow a GMP is denoted by 0. For each new GAP we decide whether it is going to be an outlier or not, according to the value 0. If it is an outlier, then it is formed as a random walk over the hexagonal network. Otherwise, a GMP is selected randomly that will correspond to the generated GAP. We also use a corruption mechanism to distinguish the GAP from its corresponding GMP. We insert random cells between the consecutive cells of the GMP. In order to accomplish this, we define a corruption ratio c, which denotes the ratio of the number of such random cells to the number of cells in the corresponding GMP. The total number of generated GAPs is 10,000 and from these, we construct the training and test sets. The number of GAPs in training set is 9000 and the number of GAPs in test set is 1000. GMPs are mined from the GAPs in the training set and then the mobility rules that will be used in prediction are generated by using these GMPs. The GAPs in the test set are used for evaluating the prediction accuracy of our algorithm. There are three possible outcomes for the location prediction, when compared to the actual location: — The predictor correctly identified the location of the next move.— The predictor incorrectly identified the location of the next move.— The predictor returned ‘‘no prediction’’.
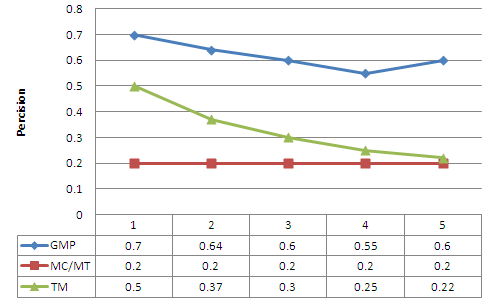 | Figure 3. Precision as a function of the maximum number of prediction made each time |
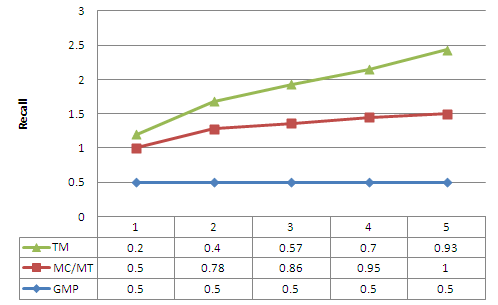 | Figure 4. Recall as a function of the maximum number of prediction made each time |
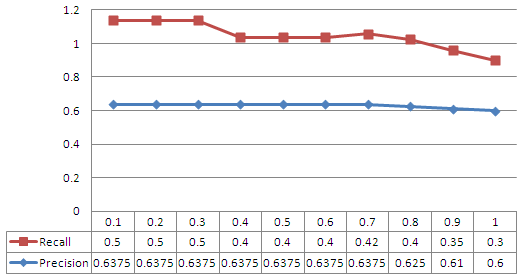 | Figure 5. Precision and Recall as a function of the minimum support for GMP prediction model |
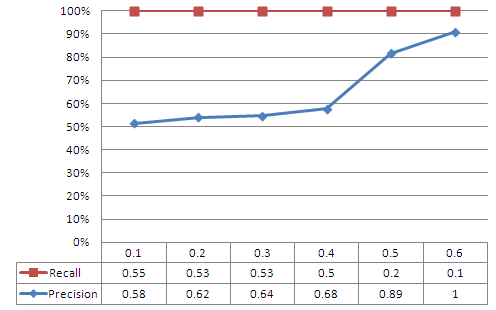 | Figure 6. Precision and Recall as a function of the minimum confidence for GMP prediction model |
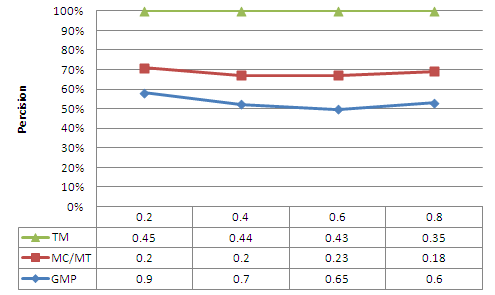 | Figure 7. Precision as a function of the corruption factor |
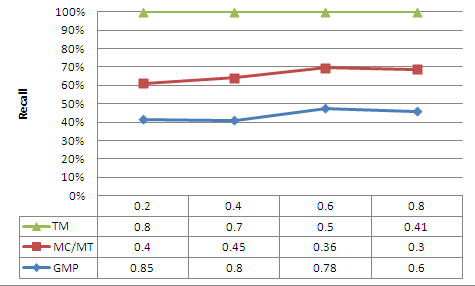 | Figure 8. Recall as a function of the corruption factor |
6. Conclusions
- In this paper, we applied a data mining technique for the prediction of behavioural group patterns derived from user movements’ data in a mobile computing system. The algorithm proposed in this study is based on mining the mobility patterns of users in each group, forming mobility rules from these patterns, and finally predicting a mobile user’s group movements using the mentioned mobility rules. Through accurate prediction of mobile user movements, our algorithm enabled the system to allocate resources to users in an efficient way, thus leading to an improvement in resource utilization and a reduction in the latency in accessing the resources. Furthermore, our algorithm enabled the system to produce more accurate answers to location dependent queries that refer to future positions of mobile users. We have evaluated the performance of our algorithm using simulation and compared the obtained results with the performance of two other prediction methods, mobility prediction based on MC/MT and TM models. In MC/MT model, mobility prediction is based on the cell-to-cell transition probability matrix. The TM method does not take any historical information into account when making prediction. In this method, randomly selected neighbours of the current cell are used as the predicted cells. This method can be considered as a baseline algorithm for comparison. Our method has performed well with a variety of corruption factor and outlier percentage values. We have observed that although an increase in the corruption in the data decreases the recall and precision, an increase in the outlier percentage has no significant effect on the recall and precision. When compared to the performance of the baseline method, which is MC/MT Prediction, our method provides a very good performance in terms of precision and recall.
APPENDIX
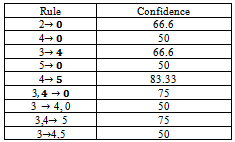
- Present the three tables as 1) Database of group actual paths (gaps), 2) Generating all possible mobility rules and 3) The set of all large patterns.
|
|
|
ACKNOWLEDGEMENTS
- The authors would like to thank the anonymous reviewers for their valuable feedbacks and suggestions for this work. We would also like to acknowledge support from the Graduate School of Information Technology at Siam University.
References
| [1] | G Y. Saygin, O. Ulusoy, “Exploiting data mining techniques for broadcasting data in mobile computing environments”, Journal of IEEE Transactions on Knowledge and Data Engineering, Vol. 14 (6), pp.1387–1399, 2002. |
| [2] | G. Gok, O. Ulusoy, “Transmission of continuous query results in mobile computing systems”, Elsevier Science Inc., Journal of Information Sciences: The International Journal of Information Sciences, Vol. 125 (1–4), pp.37–63, 2000. |
| [3] | I.F. Akyildiz, S.M. Ho, Y.-B. Lin, “Movement-based location update and selective paging for PCS networks”, Journal of IEEE/ACM Transactions on Network, Vol. 4 (4), pp. 629–639, 1996. |
| [4] | B. Liang, Z. Haas, “Predictive distance-based mobility management for PCS networks”, IEEE Press Piscataway, Journal of IEEE/ACM Transactions on Networking, Vol. 11 (5), pp.718–732, 2003. |
| [5] | Chirang kumar, Bharat Bhushan and Shailender Gupa, “Evaluation of MANET Performance in Presence of Obstacles” , Journal of Ad hoc, Sensor & Ubiquitous Computing, Vol. 3(3), pp. 37-47, 2012 |
| [6] | T. Liu, P. Bahl, I. Chlamtac, “Mobility modeling, location tracking, and trajectory prediction in wireless ATM networks”, Journal of IEEE on Selected Areas in Communications, Vol. 16 (6), pp. 922–936, 1998. |
| [7] | D. Katsaros, A. Nanopoulos, M. Karakaya, G. Yavas, O. Ulusoy, Y. Manolopoulos, “Clustering mobile trajectories for resource allocation in mobile environments” , in Proceedings of the Intelligent Data Analysis Conference, Springer-Verlag, Lecture Notes in Computer Science, Vol. 2810, pp.319-329, 2003. |
| [8] | S. Rajagopal, R.B. Srinivasan, R.B. Narayan, X.B.C. Petit, “GPS-based predictive resource allocation in cellural networks” , in Proceedings of 2002 IEEE International Conference on Networks, pp. 229–234, 2002. |
| [9] | Ming-Hui Jin, Jorng-Tzong Horng, Meng-Feng Tsai and Eric Hsiao-Kuang Wu, “Location query based on moving behaviors”, Journal of Information Systems, Vol. 32(3), pp.385-401, 2007. |
| [10] | Premchaiswadi W., Romsaiyud W. and Premchaiswadi N., “Navigation without GPS: Fake Location for Mobile Phone Tracking”, in Proceedings of 2011 IEEE International Conference on ITS Telecommunications, pp. 195-200, 2011. |
| [11] | Reshmi M. and Nabendu C., “A Study on Wormhole Attacks in MANET”, Journal of International of Computer Information Systems and Industrial Management Applications, Vol. 3, pp. 271-279, 2001. |
| [12] | Romsaiyud W. and Premchaiswadi W., “Intelligence Switching Method on Mobile Application for Cell-ID/GPS Positioning Systems”, in Proceedings of 2009 IEEE International Conference on ICT and Knowledge Engineering, pp. 83-88, 2009. |
| [13] | A. Aljadhai, T. Znati, “Predictive mobility support for QoS provisioning in mobile wireless environments”, IEEE Press Piscataway, Journal of IEEE on Selected Areas Communication, Vol. 19 (10), pp.1915–1930, 2001. |
| [14] | Sheng-Hao Chung, Wei-Han Chang and Lin K.W., “Hybrid Routing Protocols for Ad Hoc Wireless Networks”, Journal of Ad Hoc, Sensor & Ubiquitous Computing, Vol. 2(4), pp.79-96, 2011. |
| [15] | Cheng-Lin Tsao, Yu eh-Ting Wu, Wanjiun Liao and Jia-Chun Kuo, “Link duration of the random way point model in mobile ad-hoc networks”, in Proceedings of 2006 IEEE International Conference on Wireless Communications and Networking, pp. 367-371, 2006. |
| [16] | Santosh Kumar, S.C. Sharman and Bhupendra Suman, “Mobility Metrics Based Classification & Analysis of Mobility Model for Tactical Network”, Journal of Next-Generation Networks, Vol. 2(3), pp. 39-51, 2010. |
| [17] | Mohd Izuan Mohd Saad and Zuriati Ahmad Zukarnain, “Performance Analysis of Random-Based Mobility Models in MANET Routing Priotocol”, European Journal of Scientific Research, Vol. 32(4), pp. 444-454, 2009. |
| [18] | Abdul-Rahman, S. Mohamed-Hussein Z. and Bakar A.A., “Velocity-based reinitialisation approach in particle swarm optimization for feature selection”, in Proceedings of 2011 IEEE International Conference on Hybrid Intelligent Systems, pp.621-624, 2011. |
| [19] | Uslu G., Altun O. and Baydere S., “A Bayesian approach for indoor human activity monitoring”, in Proceedings of 2011 IEEE International Conference on Hybrid Intelligent Systems, pp.324-327, 2011. |
| [20] | D. Gusfield, “Algorithms on Strings, Trees, and Sequences”, Cambridge University Press, 1997. |
| [21] | X. Hong, M. Gerla, G. Pei, and C. Chiang, “A group Mobility model for ad hoc wireless networks”, in Proceedings of 1999 ACM International Workshop on Modeling and Simulation of Wireless and Mobile Systems, 1999. |
| [22] | Karen H. Wang and Baochun Li, “Group Mobility and Partition Prediction in Wireless ad-hoc Networks”, IEEE Press Piscataway, Journal of IEEE on Selected Areas in Communications, Vol. 16 (5), pp. 922-936, 2002. |
| [23] | F. Bai, N. Sadagopan, and A. Helmy, ” Important: a framework to systematically analyze the impact of mobility on performance of routing protocols for ad hoc networks”, in Proceedings of 2003 IEEE International Conference on Computer and Communications Societies, Vol. 2, pp. 825–835, 2003. |
| [24] | Tom Goff, Nael B, et al. “Preemptive Routing in Ad-hoc Networks”, Journal of Parallel and Distributed Computing- Special issue on Routing in mobile and wireless ad hoc networks, Vol. 62 (2), pp. 123 – 140, 2003. |
| [25] | Kap-Dong Kim, Kwangil Lee, Jun-Hee Park and Sang-Ha Kim, “A Scalable Multicasting with Group Mobility Support in Mobile Ad Hoc Networks”, Journal of Information Processing Systems, Vol. 3 (1), pp. 1-7, 2007. |
| [26] | Geetha Jayakumar and Gopinath Ganapathi, “Reference Point Group Mobility and Random Waypoint Models in Performance Evaluation of MANET Routing Protocols”, Journal of Computer Systems, Networks, and Communications, Vol. 1, 2008, Doi:10.1155/2008/860364, 2008. |
| [27] | Creighton Hager,Jared Burdin, Randall Landry, “Modeling Emergent Behavior in Tactical Wireless Networks”, in Proceedings of 2009 IEEE International Conference on Military Communications, pp. 1-7, 2009. |
| [28] | T. Camp, J. Boleng, and V. Davies, “A Survey of Mobility Models for Ad-hoc Network Research”, in Proceedings of 2002 IEEE International Conference on Wireless Communication & Mobile Computing, Special Issue on Mobile Ad Hoc Networking: Research, Trends and Applications, vol. 2, no. 5, pp. 483-502, 2002. |
| [29] | Jun Li, Yifeng Zhou, Louise Lamont, F. Richard Yu and Camille-Alain Rabbath, “Swarm Mobility and its Impact on Performance of Routing Protocols in MANETs”, Elsevier Science Publishers B.V. Amsterdam, Journal Computer Communications, Vol. 35(6), pp. 709-719, 2012. |
| [30] | Sergio IIarri, Eduardo Mena and Arantza ILLarramendi, “Monitoring Continuous Location Queries Using Mobile Agents”, Springer-Verlag Berlin Heidelberg, Advances in Databases and Information Systems, Lecture Notes in Computer Science, Vol. 2435, pp.92–105, 2002. |
 Abstract
 Reference
 Full-Text PDF
 Full-Text HTML
