Hend Saad1, Riham Refeat1, Moustafa Aziz1, Hesham Mansour2
1Nuclear Safety Engineering Department, Egyptian atomic Energy Authority (EAEA), 3 Ahmed El Zomor St., Nasr City, Cairo, Egypt
2Physics Department, Faculty of Science, Cairo University, Giza, Egypt
Correspondence to: Hend Saad, Nuclear Safety Engineering Department, Egyptian atomic Energy Authority (EAEA), 3 Ahmed El Zomor St., Nasr City, Cairo, Egypt.
| Email: |  |
Copyright © 2022 The Author(s). Published by Scientific & Academic Publishing.
This work is licensed under the Creative Commons Attribution International License (CC BY).
http://creativecommons.org/licenses/by/4.0/

Abstract
One of the main features of advanced pressurized water reactors is the tendency to extend the fuel life cycle. This is achieved by using fuel with high uranium enrichment and burnable absorbers to flatten out the variations in the reactivity and power. The distribution of the absorbers in the fuel assemblies can have a significant impact on the core power distribution. In the present paper, the effect of the axial distribution of gadolinium absorber on the reactivity and power of the US-APWR is determined at steady state and during burnup calculations. MCNP6 code is used to simulate two core models for the APWR. The first model represents the original core configuration where some fuel rods are divided into two parts with Gadolinia fuel pellets in the lower part. The second model represents a proposed core configuration where Gadolinia fuel rods are divided into three parts with Gadolinia fuel pellets in the central region. The main safety neutronic parameters of the two models are calculated; the effective multiplication factor, radial and axial power distributions, effective delayed neutron fraction, the mean generation time, Doppler and moderator coefficients. The results obtained showed that the proposed core configuration extended the lifetime of fuel cycle by 76 days compared to the original core. Also, the proposed core yielded flattened power profiles, which means additional axial power distribution control. The results recommend the use of Gadolinia fuel rods that contains gadolinium absorber in the central region of the rod to improve the performance of the APWR and guarantee the safe operation of the reactor.
Keywords:
Advanced Pressurized Water Reactor, Gadolinium Burnable Poison, Burnup, Power Distribution, Kinetic Parameters, Reactivity Coefficients
Cite this paper: Hend Saad, Riham Refeat, Moustafa Aziz, Hesham Mansour, Comparative Analysis of Fuel with Different Gadolinium Axial Distribution in Advanced Pressurized Water Reactor Core, Journal of Nuclear and Particle Physics, Vol. 12 No. 1, 2022, pp. 1-13. doi: 10.5923/j.jnpp.20221201.01.
1. Introduction
The United State Advanced Pressurized Water Reactor (US-APWR) is a generation III nuclear reactor design, its development is based on advanced pressurized water reactor technology [1]. Generation III nuclear reactors are essentially generation II reactors with evolutionary design improvements in several areas, namely; fuel technology, thermal efficiency, modularized construction, safety systems, and standardized design. It is characterized by high fuel burn-up levels that increases its efficiency, and reduce the amount of waste produced. Also, burnable absorbers ('poisons') are used to extend fuel life cycle [2].US-APWR has a 4451 MWt, about 1700 MWe net; due to longer fuel assemblies (4.3m instead of 3.7m in earlier designed PWR), higher core burnup and higher thermal efficiency (37%). It has 24-month fuel cycle. Since, the most important requirement of a nuclear power plant is the safety, so, the US-APWR incorporates numerous technical improvements to further enhance its safety features [1,3-8].To optimize the utilization of fuel in APWR, extended burnup cycles and low leakage fuelling patterns have been proposed. Gadolinium burnable absorbers ('poisons') are used to extend the fuel life cycle. The use of gadolinium as a burnable poison offers several advantages because of its large absorption cross section. An additional advantage of gadolinium is expressed as the gadolinium can be mixed with the fuel, requiring no displacement of water [9]. The radial distribution of the gadolinium absorber in the assembly and its axial distribution in the fuel rods itself, has an effect on the power of the reactor. The axial power distribution in the core can be reduced by axially zoning the gadolinium in the fuel rods. This leads to flattening of power, which means additional control of power distribution. Many studies have been undertaken to determine the feasibility of the use of gadolinium as a burnable poison for PWRs [10-14]. The goal of the present work is to determine the optimal axial distribution of gadolinium burnable poison that can be used in APWR to enhance core performance throughout its life cycle. MCNP6 code [15-17] is used to simulate two core configurations for US-APWR. The first one is the original core configuration of the reactor with partial axial distribution of gadolinium absorber (UO2 +Gd2O3) in the lower part of fuel rods and UO2 fuel pellets in the upper part [1]. Then an alternative gadolinium axial distribution in fuel rods is proposed with gadolinium fuel pellets in the central region of the fuel rod and UO2 fuel pellets in the upper and lower parts. The safety performance of the alternative core is investigated and compared to the original core distribution.
2. Reactor Core Description
The APWR core consists of 257 fuel assemblies surrounded by stainless-steel radial neutron reflector designed to improve neutron utilization, which reduces the fuel cycle cost and significantly reduces reactor vessel irradiation compared to previous PWRs with baffle/barrel designs [1]. Through installation of the radial reflector, neutron irradiation of the reactor vessel can be reduced to 1/3 that of present reactors. The 17 x 17 fuel assembly consists of 264 fuel rods, 24 guide thimble tubes, and 1 instrumentation thimble tube. The fuel rod consists of ZIRLOTM 1 fuel cladding loaded with sintered uranium dioxide pellets and/or sintered Gadolinia-uranium dioxide (UO2 + Gd2O3) pellets, a coil spring in the upper plenum, and a lower plenum spacer. Figure (1) illustrates the axial composition of fuel rods and the three models that will be used in the present work: 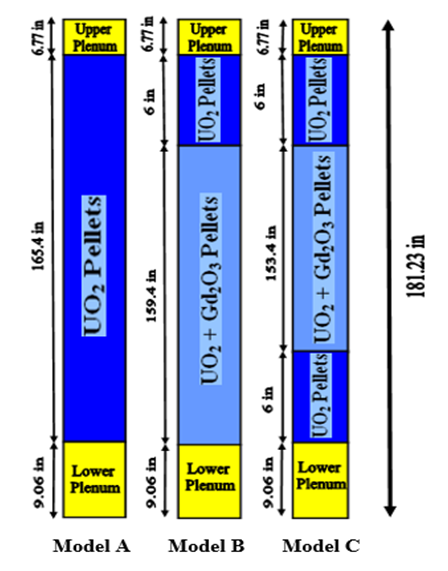 | Figure (1). Schematic View of axial composition of Fuel Rods (Dimensions in inches according to reference 1) |
Model (A): The active fuel zone is filled with pure UO2 pellets.Model (B): The upper part of the fuel rod is filled with UO2 fuel pellets and the lower part contains (UO2 +Gd2O3) pellets.Model (C): Contains three parts; the upper and lower parts are filled with UO2 fuel pellets while (UO2 + Gd2O3) fuel pellets lies in between.Fuel rods with models (A and B) are used in the original core configuration [1], while in the proposed core configuration fuel rods with model (B) are replaced by those with model (C). Figure (2) shows a typical initial core loading pattern for the original core configuration of APWR. The core consists of 257 fuel assemblies distributed in 9 different batches as indicated in the first column of figure (2). Each batch consists of a number of similar assemblies. Each assembly batch is characterized by different fuel enrichment, axial rods composition, number of burnable poison rods and gadolinium content [1]. The description of the nine batches of the APWR core is summarized as follows:Ø R1UA: The assembly contains 264 fuel rods of model (A) with initial enrichment 2.05% without Burnable poisons or Gadolinia.Ø R2UA: The assembly contains 264 fuel rods of model (A) with initial enrichment 3.55% without Burnable poisons or Gadolinia.Ø R2UC: The assembly contains 264 fuel rods of model (A) with initial enrichment 3.55% and 20 Burnable poisons without Gadolinia.Ø R2UD: The assembly contains 264 fuel rods of model (A) with initial enrichment 3.55% and 24 Burnable poisons without Gadolinia.Ø R2GB: The assembly contains 240 fuel rods with initial enrichment 3.55% and 24 Gadolinia fuel rods of model (B) and without Burnable poisons.Ø R2GC: The assembly contains 240 fuel rods with initial enrichment 3.55% and 24 Gadolinia fuel rods of model (B) and without Burnable poisons.Ø R3UA: The assembly contains 264 fuel rods of model (A) with initial enrichment 4.15% without Burnable poisons or Gadolinia.Ø R3GB: The assembly contains 240 fuel rods with initial enrichment 4.15% and 24 Gadolinia fuel rods of model (B) and without Burnable poisons.Ø R3GC: The assembly contains 240 fuel rods with initial enrichment 4.15% and 24 Gadolinia fuel rods of model (B) and without Burnable poisons.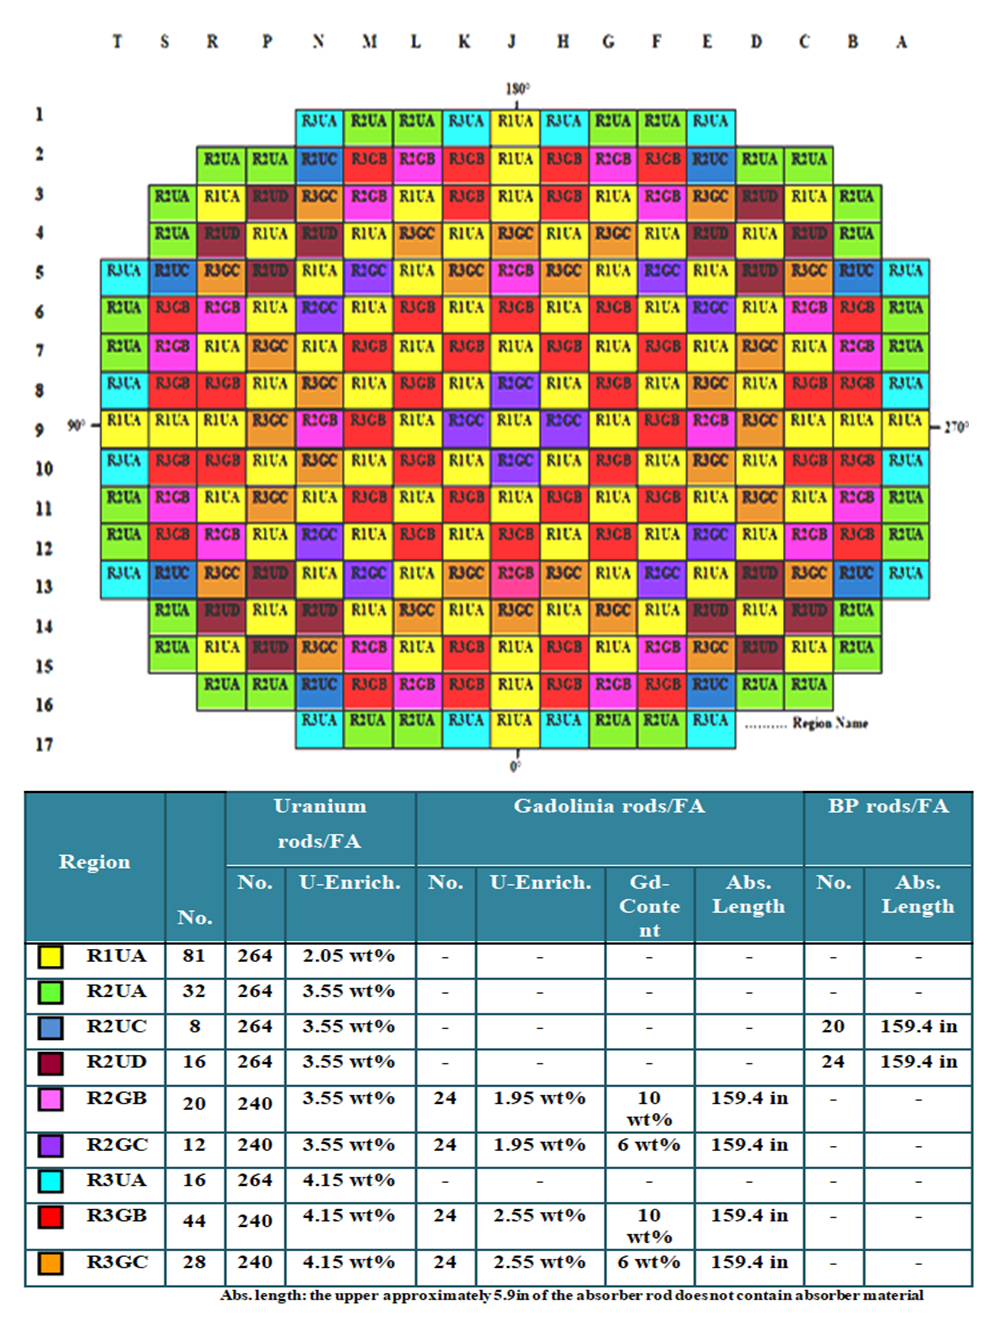 | Figure (2). The original core loading pattern for APWR |
3. Simulated MCNP6 Core Model and Methodology
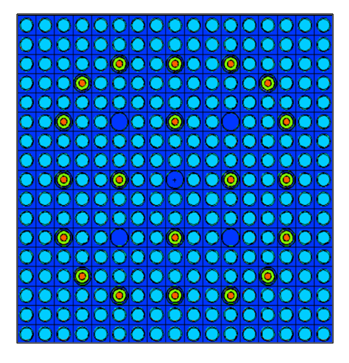
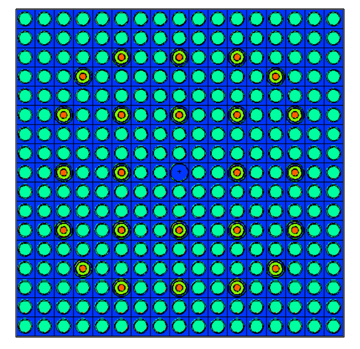
MCNP6 code [15-17] is used in the present study to simulate the full APWR reactor core. The particle radiation transport code MCNP [18,19], which stands for Monte Carlo N Particle, is a general-purpose, continuous-energy, generalized-geometry, time-dependent, Monte Carlo radiation-transport code designed to track many particle types over broad ranges of energies. MCNP6 represents the culmination of a multi-year effort to merge the MCNP5™ and MCNPX™ codes into a single product comprising all features of both. The new features include treatment of large amount of particles, inclusion of model physics options for energies above the cross-section table range, burnup feature, and delayed particle production [17].The different nine fuel assembly batches of the APWR core are simulated using MCNP6. All the geometrical and composition details in the core design are considered. Each assembly batch is characterized by different: fuel enrichment, axial rod composition, number of burnable poison and rod gadolinium content. The total core assemblies are 257 with 17 x 17 rod distributions. The simulated MCNP fuel assemblies’ configurations are given in details in figures (3-6). Figure (3) shows typical model (A) fuel assembly without burnable poison. Figure (4) shows typical models (B) and (C) which contain 24 Gadolinium integral fuel rods. Figure (5) shows typical model (A) fuel assembly with 20 burnable poisons. Figure (6) shows typical model (A) fuel assembly with 24 burnable poisons. 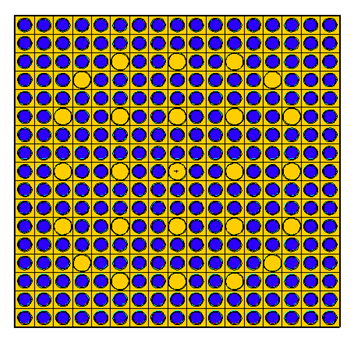 | Figure (3). MCNP6 cross sectional view for model (A), without burnable absorbers |
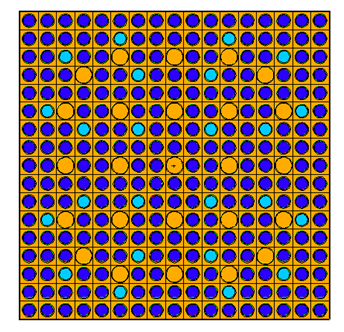 | Figure (4). MCNP6 cross sectional view for models (B) and (C), with 24 gadolinium integral fuel rods |
 | Figure (5). MCNP6 cross sectional view for model (A), with 20 burnable absorbers |
 | Figure (6). MCNP6 cross sectional view for model (A), with 24 burnable absorbers |
The horizontal and vertical cross section views for the whole reactor core are presented in figure (7). The model includes neutron reflector, core barrel and pressure vessel.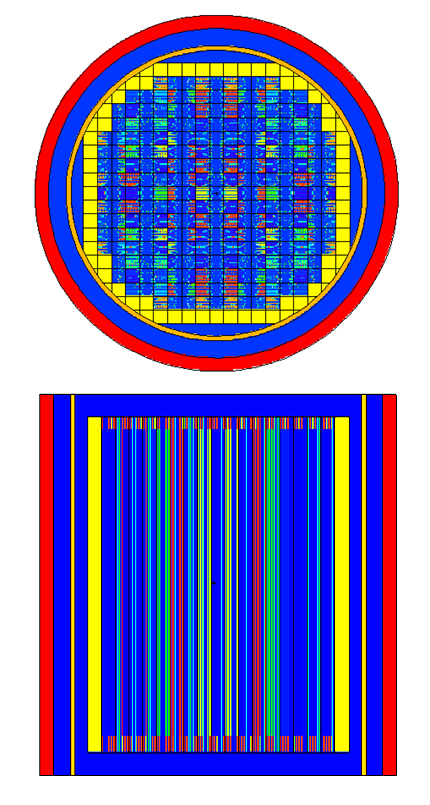 | Figure (7). MCNP6 radial and axial cross sectional views of APWR original core configuration |
In the second stage all model (B) fuel rods are replaced with model (C) fuel rods, the number and radial distribution of fuel rods are preserved. Hence, the description of the nine batches of the APWR core is as follows:Ø R1UA, R2UA, R2UC, R2UD and R3UA fuel assemblies are kept the same as in the original core configuration.Ø R2GB, R2GC, R3GB and R3GC fuel assemblies have the same number of UO2 fuel rods and Gadolinia fuel rods as that of the original core configuration. Both the uranium and gadolinium enrichments are preserved, but the axial distribution of gadolinium within the fuel rods is changed. Model (B) fuel rods of the original core configuration are replaced with model (C) fuel rods in the alternative core configuration. To demonstrate the neutronic behavior of the proposed core configuration, the main neutronic parameters are determined for the original and alternative core configurations of the APWR. These parameters includes the variation of the effective multiplication factor keff with burnup, the radial power distribution of fuel assemblies and the core axial power distribution at BOC and at different burnup steps [0.15, 11, and 23 (GWd/MTU)]. The results obtained for both cores are compared with each other to determine the optimal core configuration. Then the safety and kinetic parameters for the alternative core configuration are calculated to assess its safety performance during reactor operation.The variation of the effective delayed neutron fraction and the mean generation time with burnup is determined. The effective delayed neutron fraction is calculated using equation (1) and the neutron mean generation time is calculated using equation (2) [20-22]: 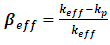 | (1) |
Where βeff is the delayed neutron fraction, keff is the effective neutron multiplication factor and kp is the neutron multiplication factor with only prompt neutrons.  | (2) |
Where Λ is the mean generation time, keff is the effective neutron multiplication factor and, lp is the prompt neutron lifetime, which is the average time for a prompt neutron to be removed from the system by leakage or absorption.Finally the reactivity coefficients; Doppler and moderator coefficients are calculated for the proposed core configuration of US-APWR using MCNP6 code. They are defined as follows [22-25]: | (3) |
 | (4) |
Where δρ is the reactivity change as a result of the change in factors such as fuel or moderator temperature, δTx is the change in fuel or moderator temperature (Kelvin), and (k1 and k2) are the multiplication factors before and after the change.The Evaluated Neutron Data File library, ENDF/B-VII.1 [26] is used as a source of cross section data for the present calculations.
4. Results and Discussion
4.1. Burnup Calculations
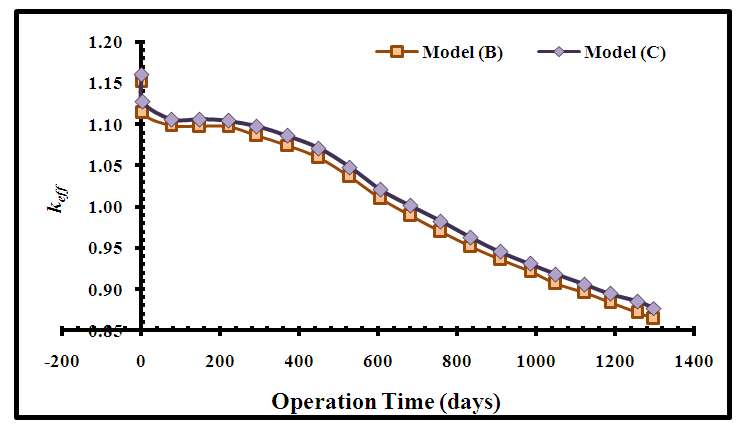
Burnup calculations are performed for the original and alternative core configurations of APWR to reach 40 (GWd/MTU). The variation of the effective multiplication factor (keff) with burnup and operation time for the full reactor core is presented in figures (8 and 9). Model (B) is the original core configuration of APWR and model (C) is the proposed core configuration.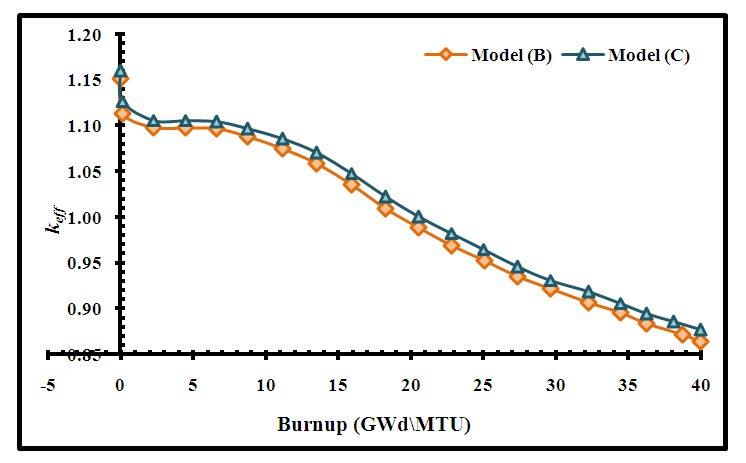 | Figure (8). Variation of keff of the APWR core with burnup |
 | Figure (9). Variation of keff of the APWR core with the operational time |
For both models keff decreased with burnup due to the consumption of the fuel fissile isotopes. keff behaviour with burnup can be divided into 3 modes; at the beginning (burnup <5 (GWd/MTU)) the slope of the curve is sharper than the rest of the curve due to the effect of gadolinium in some assemblies and buildup of 135Xe which acted as a poison due to its high absorption cross section. Below 18 (GWd/MTU) keff decreases slowly because of the presence of burnable poisons and after 18 (GWd/MTU), the rate increases after burnup of burnable poisons. Figure (9) illustrates the variation of keff versus operation time (days) corresponding to figure (8). It indicates that the effective multiplication factor of model (C) is 1.00085 achieved at time 683 days and burnup 21 (GWd/MTU), while model (B) is 1.00975 achieved at time 607 days and burnup 18 (GWd/MTU). This means that using fuel assemblies with model (C) fuel rods extended the lifetime of the fuel cycle by 76 days and increased the fuel discharge burnup. This leads to the minimization of the fuel cost, the amount of spent fuel and the amount of waste after reprocessing. Figures (10 and 11) present the depletion of fuel isotopes (235U and 238U isotopes) for both core models. It is clear that the concentrations of the uranium isotopes for model C are higher than model B, this causes increase in fission rate and hence increase in keff. 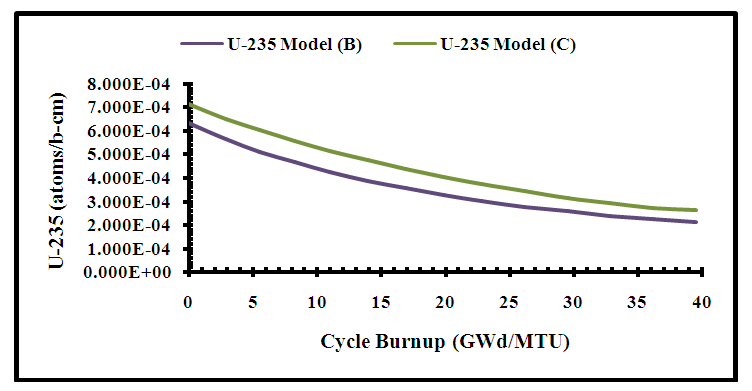 | Figure (10). Variation of 235U concentration with Burnup |
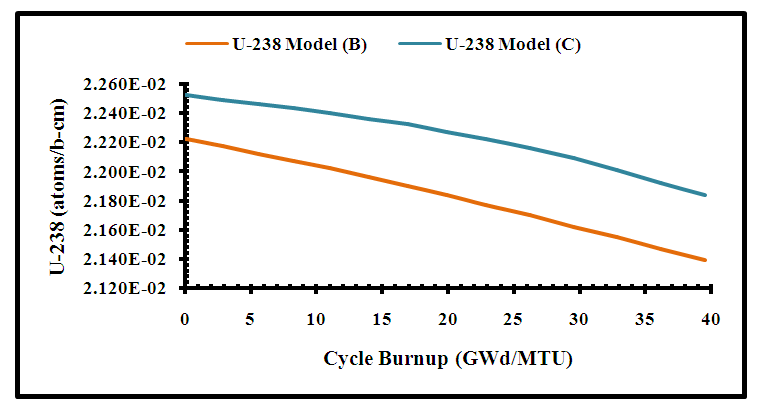 | Figure (11). Variation of 238U concentration with Burnup |
4.2. Radial Power Distribution
Normalized radial power distribution for each assembly is calculated for both core models at BOC and at different fuel burnup levels [0.15, 11, and 23 (GWd/MTU)]. The initial conditions used in calculations are: temperature of hot shutdown (557 deg.F°), all control rods out (ARO), without boron (Zero ppm). At BOC, no xenon is considered (NoXe) while at burnup levels equilibrium xenon (EqXe) is considered. The results obtained are compared with reference [1]. Figures (12-15) presents the radial power distribution in one-eighth of the reactor core. The first value is the assembly type; the second value is the normalized assembly power value for model (B), the third is the normalized power value for model (C), followed by reference value (fourth row). 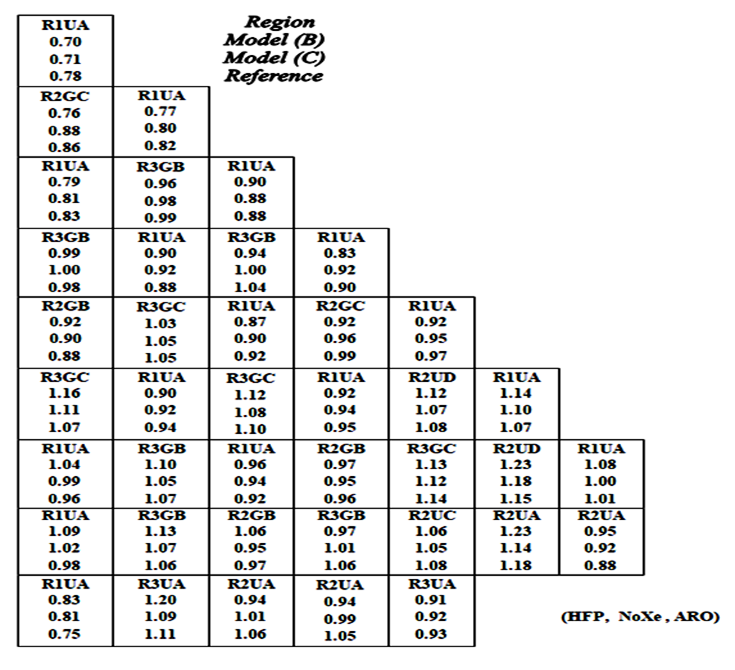 | Figure (12). Normalized Radial Power at 0 (GWD/MTU) |
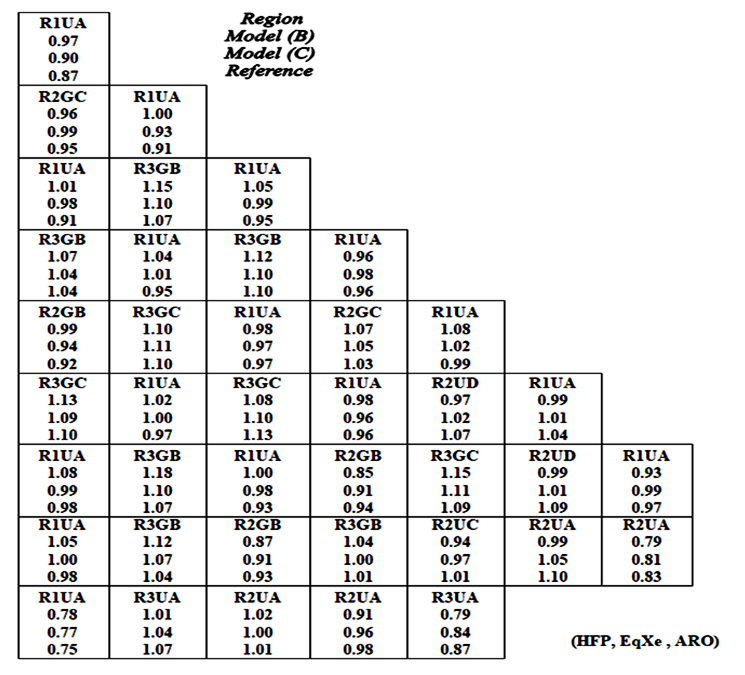 | Figure (13). Normalized Radial Power at 0.15 (GWD/MTU) |
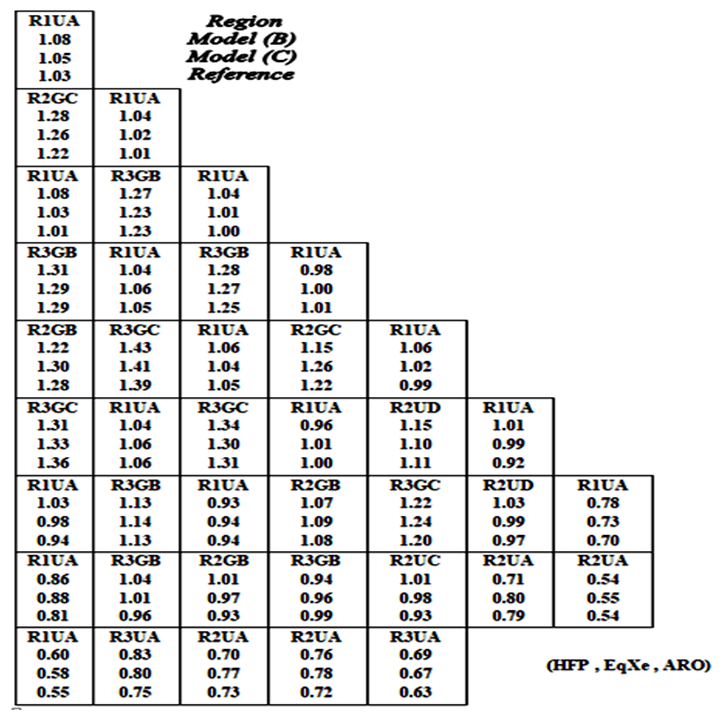 | Figure (14). Normalized Radial Power at 11 (GWD/MTU) |
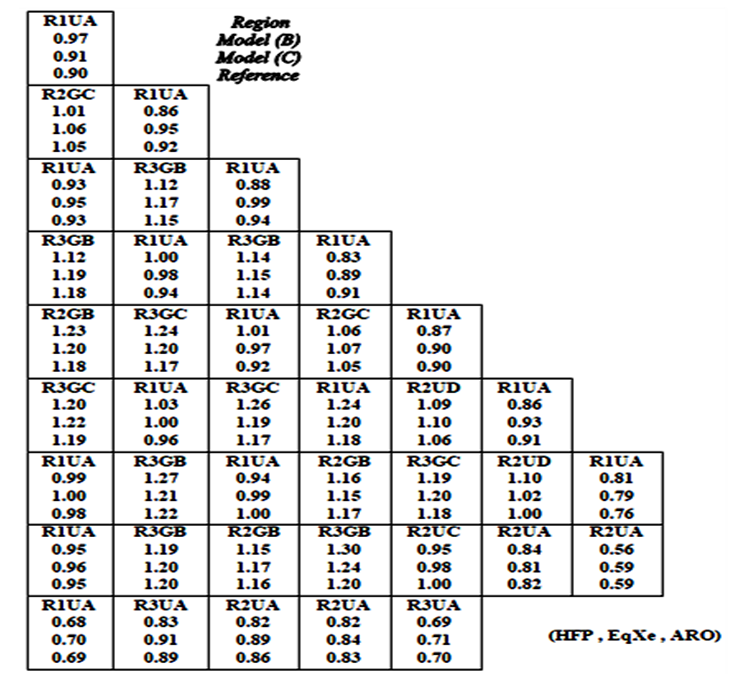 | Figure (15). Normalized Radial Power at 23 (GWD/MTU) |
The results show that the power values obtained for both models are so close to the reference and that the results of model (C) are much closer. This indicates that the performance of model (C) is better than model (B).
4.3. Axial Power Distribution
Normalized axial power distributions for core models (B) and (C) are calculated at BOC and at the different fuel burnup levels [0.15, 11, and 23 (GWd/MTU)] with the initial conditions stated in section 4.2. Figure (16) illustrates the axial power distribution for both core models at BOC. Figure (17) shows the axial power distribution for model (B) at the different burnup levels and figure (18) presents the results of model (C). 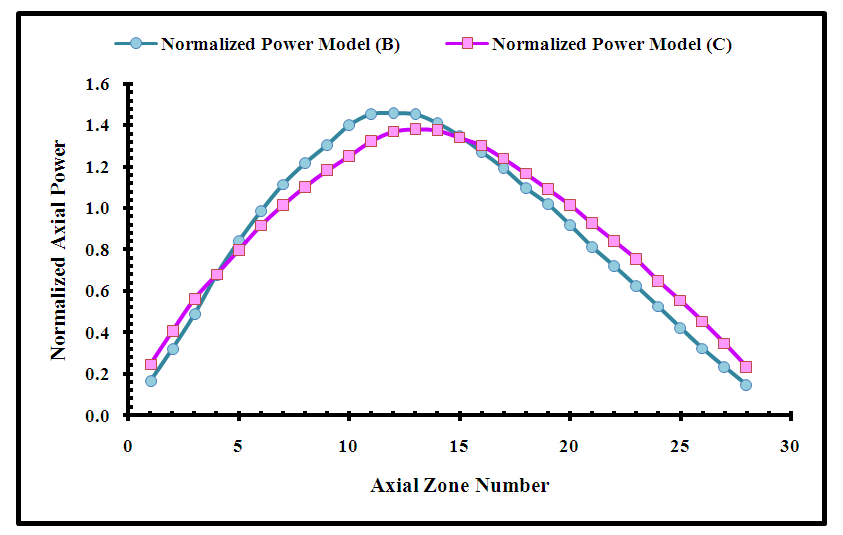 | Figure (16). Normalized Axial Power Distribution for the APWR full Core at BOC |
It is shown in figure 16 that at BOC, the power peaking factor for model (B) is 1.46 and for model (C) is 1.38. Both values are acceptable and maintain the safety limits for the reactor operation [1,27]. But the power peaking factor for model C is lower than model B which is a requirement for the reactor safety. It is also shown that for model (C), the difference between the power value at the center of the curve and those at the ends is smaller than for model (B). This corresponds to flattening of the power profile observed for models (C) compared to model (B). The results indicate that the axial power distribution of model (C) is more flattening than model (B).The results presented in figures (17 and 18) illustrate the power depression at the core center due to fuel depletion at the burnup levels [11, and 23 (GWd/MTU)]. Comparing the results of model (B) in figure (17) with those of model (C) in figure (18); it is shown that the power values of model (B) are higher than model (C), so model (C) yields optimal flattened axial power distribution. 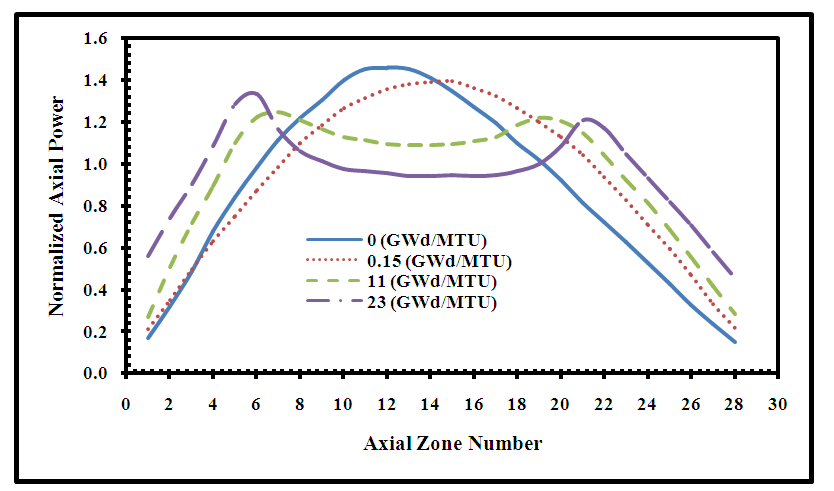 | Figure (17). Normalized Axial Power Distribution for the full Core at different burnup levels for Model (B) |
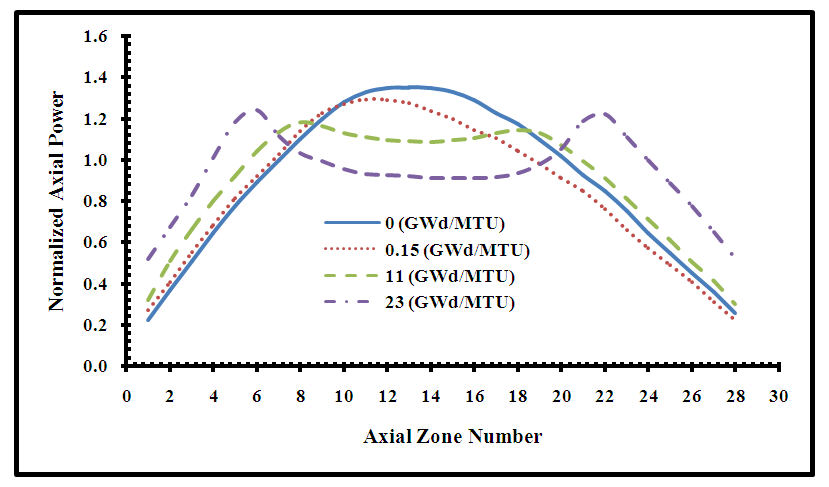 | Figure (18). Normalized Axial Power Distribution for the full Core at different burnup levels for Model (C) |
To demonstrate the results obtained, the flux distribution in both core configurations is determined using FMESH tally which is one of the new features in MCNP6 code. Figure (19) presents the flux distribution in the core superimposed on the horizontal mid-plane for models (B) and (C). It is shown that the peak value for flux in model (B) is higher than that in model (C).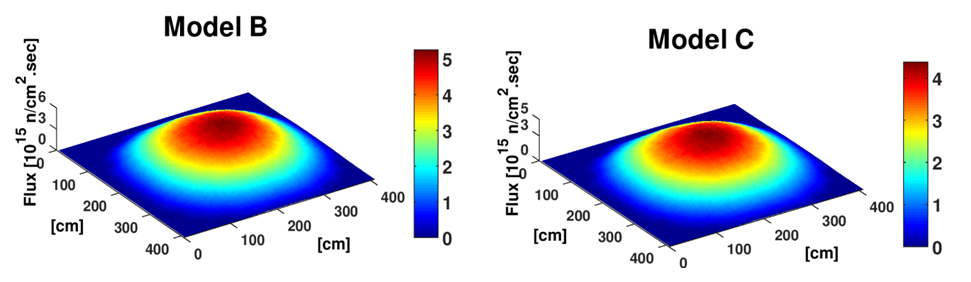 | Figure (19). Flux Distribution in the Axial Mid-plane of the core for Models (B) and (C) |
Thus, the distribution of the gadolinium absorber in the central region of fuel rod (part-length absorber) leads to flattening of axial power, which means additional axial power distribution control.
4.4. Kinetic Parameters and Reactivity Coefficients Calculations
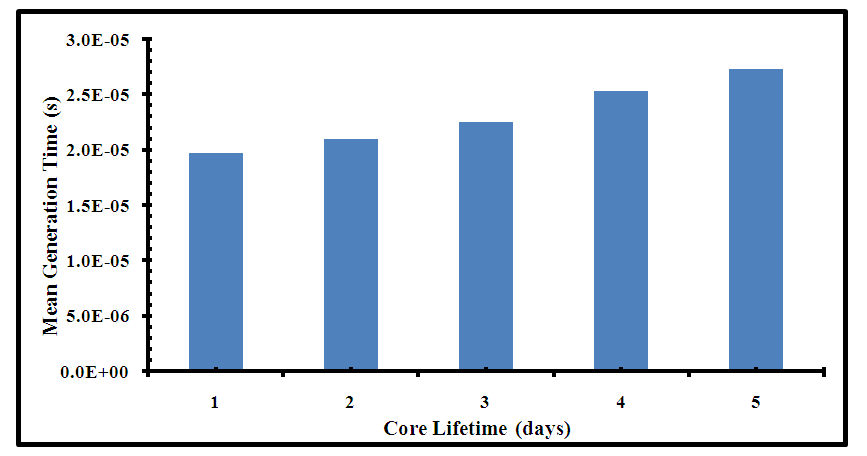
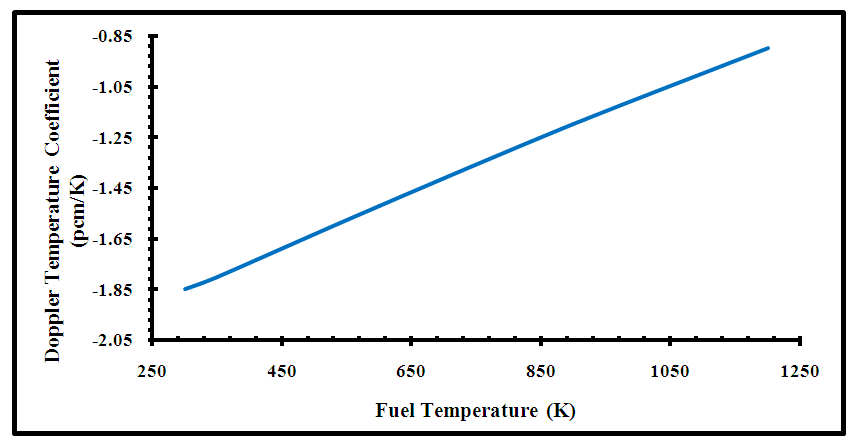
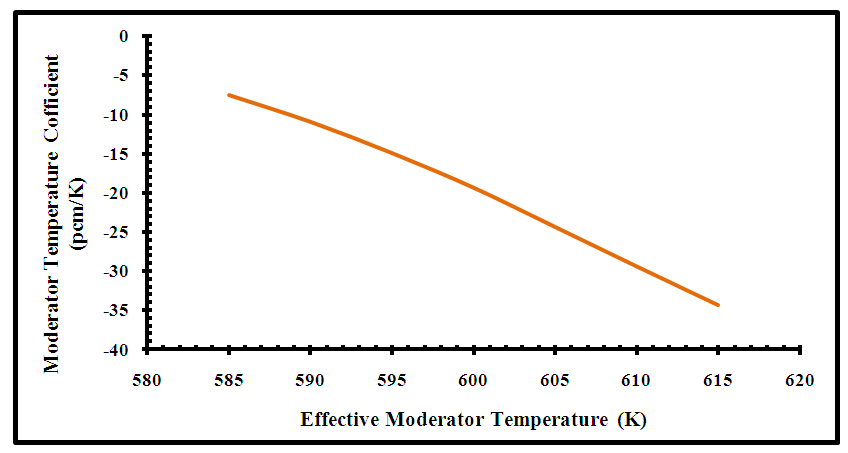
The kinetic parameters and reactivity coefficients are determined for the proposed core configuration (model C) to evaluate its safety performance during reactor operation. The variation of the effective delayed neutron fraction and the mean generation time with burnup is determined and the results are presented in figures 20 and 21. The reactivity coefficients; fuel and moderator temperature coefficients are presented in figures 22 and 23.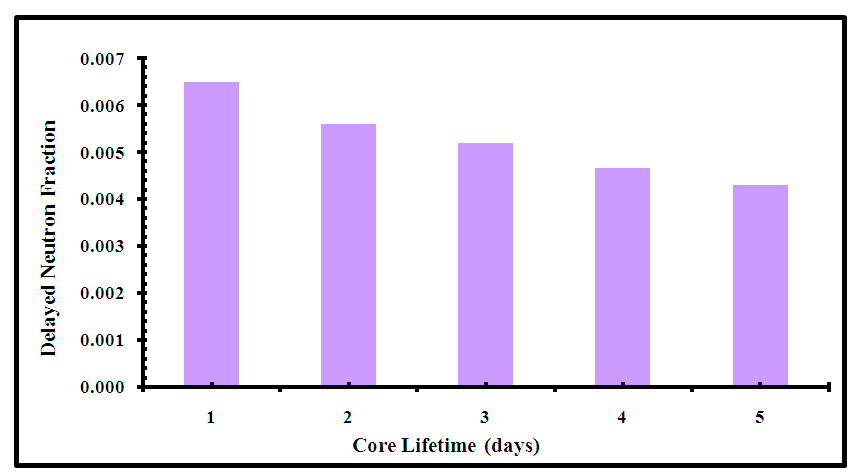 | Figure (20). The Effective Delayed Neutron Fraction for Model C core configuration |
 | Figure (21). The Mean Generation Time for Model C core configuration |
 | Figure (22). Doppler Temperature Coefficients for Model C core configuration |
 | Figure (23). Moderator Temperature Coefficients for Model C core configuration |
Figure (20) shows the delayed neutron fraction for the proposed US-APWR core configuration over its lifetime. It starts at 0.0065, which lies within the design limits of the US-APWR (0.0044 to 0.0075) [1]. This value decreases steadily to 0.0043 at EOL. This is due to the depletion of U-235 and build-up of plutonium in the core. Figure (21) shows the mean generation time for the proposed US-APWR core configuration over its lifetime. It starts at 1.9732e-05 second where the prompt neutron lifetime is equal to 15.8 micro second, this lies within the design limits of the US-APWR (8 to 20 micro second) [1]. At EOL, the mean generation time increases steadily to 2.7245e-05 second. This is due to the relation between mean generation time and the effective neutron multiplication factor. Figure (22) illustrated the fuel temperature coefficient (Doppler coefficient) for the proposed model (C) at different fuel temperatures from 300 K to 1200 K at BOC. The Doppler coefficient reveals the change in reactivity caused by Doppler Broadening of the neutron cross-section for the uranium fuel as a result of change in fuel temperature. Model C has negative Doppler reactivity coefficients with increased fuel temperature, which prevents the positive reactivity feedback and maintains the inherent reactor safety.Figure (23) shows the variation of the moderator coefficient with temperature for model C core configuration. As the moderator temperature increases from 580 K to 615 K, negative moderator coefficient is provided producing negative reactivity feedback. This maintains the self-regulating effect and more reactivity control.Accordingly, the results obtained for the kinetic parameters and reactivity coefficients show that the proposed core distribution (model C) can maintain the safe operation of the reactor.
5. Conclusions
• MCNP6 code is used to simulate two core configurations for US-APWR; the models include the reactor core, the neutron reflector and the pressure vessel. The two core configurations have different axial distribution of gadolinium in fuel rods. The performance of the two cores is investigated to determine the optimal core configuration for the studied reactor. The effective multiplication factor and radial and axial power distribution are calculated for both core configurations at steady state and during fuel burnup.• The results indicate that the use of fuel assemblies with gadolinium fuel pellets located in the central part of fuel rod extended the lifetime of fuel cycle by 76 days and increased the fuel discharge burnup. This leads to the minimization of the fuel cost, the amount of spent fuel and the amount of waste after reprocessing. It also leads to flattening of axial power distribution within the core, which means additional power control. • The Kinetic parameters and reactivity coefficients are determined for the proposed core configuration. The results obtained are acceptable and satisfies the design limits and safety operational limits of the US-APWR.• It is concluded that the performance of the APWR is improved with the use of Gadolinia fuel rods that contains gadolinium absorber in the central region of the rod and the safe operation of the reactor is maintained.
Note
1. ZIRLOTM: is a registered trademark of the Westinghouse Electric Corporation.
References
| [1] | Design Control Document for the US-APWR, MUAP- DC004 Revision 4 August 2013. |
| [2] | http://33h.co/keyzn. |
| [3] | Mitsubishi Fuel Design Criteria and Methodology, MUAP-07008-P-A Rev.2, (Proprietary) and MUAP-07008-NP-A Rev.2 (Non-Proprietary), July 2013. |
| [4] | US-APWR Fuel System Design Evaluation, MUAP-07016-P Rev.4 (Proprietary) and MUAP-07016-NP Rev.4 (Non-Proprietary), August 2013. |
| [5] | US-APWR Fuel System Design Parameters List, MUAP-07018-P Rev.0 (Proprietary) and MUAP-07018-NP Rev.0 (Non-Proprietary), December 2007. |
| [6] | Mitsubishi Fuel Design Criteria and Methodology, MUAP-07008-P (Proprietary) and MUAP-07008-NP (Non-Proprietary), Rev. 2, July 2010. |
| [7] | "The US Advanced Pressurized Water Reactor". Mitsubishi Nuclear Energy Systems. Retrieved 15 November 2013. |
| [8] | Mitsubishi Fuel Design Criteria and Methodology, MUAP-07008-P (Proprietary) and MUAP-07008-NP (Non-Proprietary), Rev. 2, July 2010. |
| [9] | INTERNATIONAL ATOMIC ENERGY AGENCY, IAEA-TECDOC-844, “Characteristics and use of urania-gadolinia fuels”, 1995. |
| [10] | C. R. DRUMM, "Optimization of Gadolinium Burnable Poison by the Conjugate Gradients Method," PhD Dissertation, University of Michigan (1984). |
| [11] | R. K. HALING, "Operating Strategy for Maintaining an Optimum Power Distribution Throughout Life," TID-7672, p. 205, U.S. Atomic Energy Commission (1963). |
| [12] | L. MORTENSEN, "Absorber Management Using Burnable Poisons," RIS0-341, Ris0 National Laboratory, Denmark (1977). |
| [13] | B. M. ROTHLEDER, "Feasibility of Using Gadolinium as a Burnable Poison in PWR Cores," EPRI-NP-1663, Electric Power Research Institute (1981). |
| [14] | A. AHLIN, M. EDENIUS, and H. HAGGBLOM, "CASMO, A Fuel Assembly Burnup Program, User's Manual," AE-RF-76-4158, Studsvik (1978). |
| [15] | Pelowitz, D. B., MCNP6TM USER’S MANUAL Version 1.0 , Manual Rev. 0, Los Alamos National Laboratory Report, LA-CP-13-00634, Rev. 0, May 2013. |
| [16] | T. Goorley, et al., "Initial MCNP6 Release Overview", Nuclear Technology, 180, p. 298-315, December 2012. |
| [17] | T. Goorley, "MCNP6.1.1-Beta Release Notes", LA-UR-14-24680, 2014. |
| [18] | MCNP5: X-5 Monte Carlo Team, "MCNP - Version 5, Vol. I: Overview and Theory", LA-UR-03-1987, 2003. |
| [19] | MCNPX: D.B. Pelowitz, Ed., "MCNPX User's Manual Version 2.7.0" LA-CP-11-00438, 2011. |
| [20] | G. R. Keepin, et al., Delayed Neutrons from Fissionable Isotopes of Uranium, Plutonium and Thorium, Physical Review 107, 1044, 1957. |
| [21] | Matthew Johnson, Scott Lucas, Pavel Tsvetkov, Modeling of Reactor Kinetics and Dynamics, Idaho National Laboratory, INL/EXT-10-19953, 2010, pp 5-34. |
| [22] | Dan Gabriel Cacuci Handbook of Nuclear Engineering, Springer Science & Business Media LLC 2010, pp. 1723-2822. |
| [23] | Rokhmadi, Suwoto, Zuhair, "Analysis of Doppler Reactivity Coefficient on the Typical PWR-1000 Reactor with Mox Fuel", International Conference on Nuclear Energy Technologies and Sciences (2016). |
| [24] | K. Mourtzanos, C. Housiadas, M. Antonopoulos- Domis, "Calculation of the moderator temperature coefficient of reactivity for water moderated reactors", Annals of Nuclear Energy 28 (2001) 1773–1782. |
| [25] | Russell D. Mosteller, “The Doppler-defect Benchmark: Overview and Summary of results”. Joint International Topical Meeting on Mathematics & computing and Supercomputing in nuclear Applications, Monterey, California, April 15-19, 2007. pp.661-673. |
| [26] | Chadwick M.B., et.al, "ENDF/B-VII.1: Nuclear Data for Science and Technology: "Cross Sections, Covariances, Fission Product Yields and Decay Data", Nuclear Data Sheets 112, 2011. |
| [27] | Westinghouse technology systems Manual (section 2.2, Power Distribution Limits), U.S. NRC, Rev1013. |

 Abstract
 Reference
 Full-Text PDF
 Full-text HTML