Heba K. Louis
Safety Engineering Department, Egyptian Atomic Energy Authority, Cairo, Egypt
Correspondence to: Heba K. Louis, Safety Engineering Department, Egyptian Atomic Energy Authority, Cairo, Egypt.
| Email: |  |
Copyright © 2021 The Author(s). Published by Scientific & Academic Publishing.
This work is licensed under the Creative Commons Attribution International License (CC BY).
http://creativecommons.org/licenses/by/4.0/

Abstract
Calculating safety parameters in nuclear reactors have an important influence on the nuclear reactor control and safety. The effective multiplication factor, reactivity coefficients, power peaking factor and the kinetic parameters are the most important safety parameters for determining reactor status. The aim of the present study is to analyze the behavior of the nuclear safety parameters for the VVER-1200 core in normal state of reactor operation. A full-scale three-dimensional model of the VVER-1200/AES-2006 reactor core was performed using MCNP6 Monte Carlo code. The cross-section library data based on the ENDF/B-VII.1 are used. The investigated parameters are the effective multiplication factor, excess reactivity, Shutdown Margin, reactivity coefficients, power peaking factor and kinetic parameters. The neutron flux in both radial and axial distributions and the power distribution are also studied. The verification of the MCNP6 model VVER-1200 was performed by comparing the results of the MCNP code with VVER-1200/V392M’s FS-SAR, good agreements were observed. The calculated values of reactivity coefficients illustrated safe behavior. The effective delayed neutron fraction was within the range of standard values of VVER-1200. The power peak does not exceed the limit of the Power Peaking Factor, which ensures reactor safety. The maximum peak was 1.5 at the height corresponding to 50% of the active length of the fuel. More results are presented.
Keywords:
Neutronic analysis, Safety parameters, VVER-1200, and MCNP code
Cite this paper: Heba K. Louis, Neutronic Analysis of the VVER-1200 under Normal Operating Conditions, Journal of Nuclear and Particle Physics, Vol. 11 No. 3, 2021, pp. 53-66. doi: 10.5923/j.jnpp.20211103.01.
1. Introduction
Countries are constructing nuclear power plants for their energy needs. Seventy seven VVER reactors have been built since the 1960s. The VVER is a pressurized water reactor (PWR); however, there are significant differences between the VVER and other PWR types, both in terms of design and materials used. Distinguishing features of the VVER include the following: use of horizontal steam generators; use of hexagonal fuel assemblies; avoidance of bottom penetrations into the VVER vessel; use of high capacity pressurizers. The AES-2006 design (VVER-1200) is the latest development of the long line of a VVER plant, with increasing thermal power to around 3200 MWth and providing additional passive safety features [1]. The reactor includes international safety standards with evolutionary design improvement in the areas of fuel technology, modularized construction, safety systems, and standardized designs [2,3]. It meets all the international safety requirements for Gen III+ nuclear power plants [4,5]. There are two families of VVER-1200/AES-2006 plant designs named VVER-1200/V491 and VVER-1200/V392M. The most important differences between two designs are safety systems. [6,7]The neutronic study of a nuclear reactor is carried out to ensure that the reactor is operated safely with sufficient safety margins. To accomplish this, a comprehensive study is carried out during the designing phase of a nuclear reactor.The core excess reactivity and the shutdown margin are important parameters for safe and reliable operation of a nuclear reactor. Due to the presence of an excess reactivity in the reactor core, an appropriate safety margin is required; this means that a suitable absorbent material is present to allow the reactor to be shutdown in the event of an accident. The shutdown margin (SDM) is normally defined as negative reactivity by which the reactor is subcritical or would be subcritical from its condition if all control rods were fully inserted in the core except the more reactive one.The control system is responsible for keeping the stability and safe operation of reactor. The control system will ensure the implementation of the reactor start up process, adjust power and normally shut down the reactor or in case of emergency situation. The control rod worth is a key parameter for safety assessments a reactor because it affects the increase or decrease in reactivity. The reactivity worth of the control rod is a measurement of the efficiency of the control rod to absorb excess reactivity. This value mainly depends on the characteristics and the sizes of the reactor core. Also, it depends nonlinearly on the rods' compositions and positions where the rods are inserted into the core. Therefore, calculation of control rods worth is of major importance.Also, reactivity coefficients are of the major parameters of the reactor safety. It defines the change of reactivity per unit change in some operating parameter of the reactor. The coefficients that are significant in the reactor are the fuel temperature (Doppler) coefficient, moderator temperature coefficient, boron concentration coefficient and void coefficient.Moreover, reactor kinetic parameters are very important in nuclear power plant operation since they determine time dependent behavior of reactor power after reactivity insertion. Kinetic parameters are the effective delayed neutron fraction βeff and the neutron generation time.Furthermore, the power peaking should be within the limits so that there is no hot spot in the core. [8] Therefore, a reliable neutronic analysis of the core is required during the design phase of a reactor core.The main purpose of this work is to estimate the neutronic parameters of VVER-1200 reactor that are important for safety. The effective multiplication factor (keff), excess reactivity (ρex), Shutdown Margin (SDM), temperature coefficients, boron concentration coefficient, effective delayed neutron fraction, neutron lifetime, power peaking factor, the radial neutron flux distribution and the power density in both radial and axial distributions are investigated under normal operating conditions. The investigation of the safety parameters was carried out for the VVER-1200/AES-2006 reactor [6,7] using MCNP6 code [9]. The cross-section library data based on the ENDF/B-VII.1 [10] are used.
2. The VVER-1200 Reactor Core Description
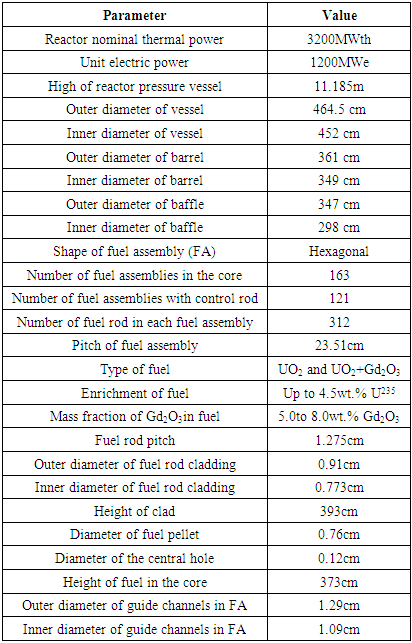
The VVER-1200/AES-2006 reactor is a pressurized water moderated reactor with thermal capacity of 3200MWth and a net electrical capacity of 1200MWe. The reactor meets all the international safety requirements for Gen III+ nuclear power plants. The main design parameters of VVER1200 core are presented in Table 1 [6].Table 1. Main design Parameters forVVER-1200/AES-2006 core [6,7]
 |
| |
|
The VVER-1200 reactor core is filled with 163 fuel assemblies (FAs). Each fuel assembly consists of a head; a bundle of 331 fuel rods and a bottom nozzle. The bundle of 331 rods contains 312 fuel rods, one instrumentation channel, and 18 guide channels in which the control rods are inserted. There are six types of fuel assemblies; each one has different enrichment, different numbers of fuel pins with different enrichment (radial profiling) as well as different pin numbers with burnable absorber and weight percentage of the burnable absorber Gd2O3. The enrichment of gadolinium oxide is 5.0% and 8%. Fig. 1 illustrates the fuel assemblies' arrangement in VVER-1200 core.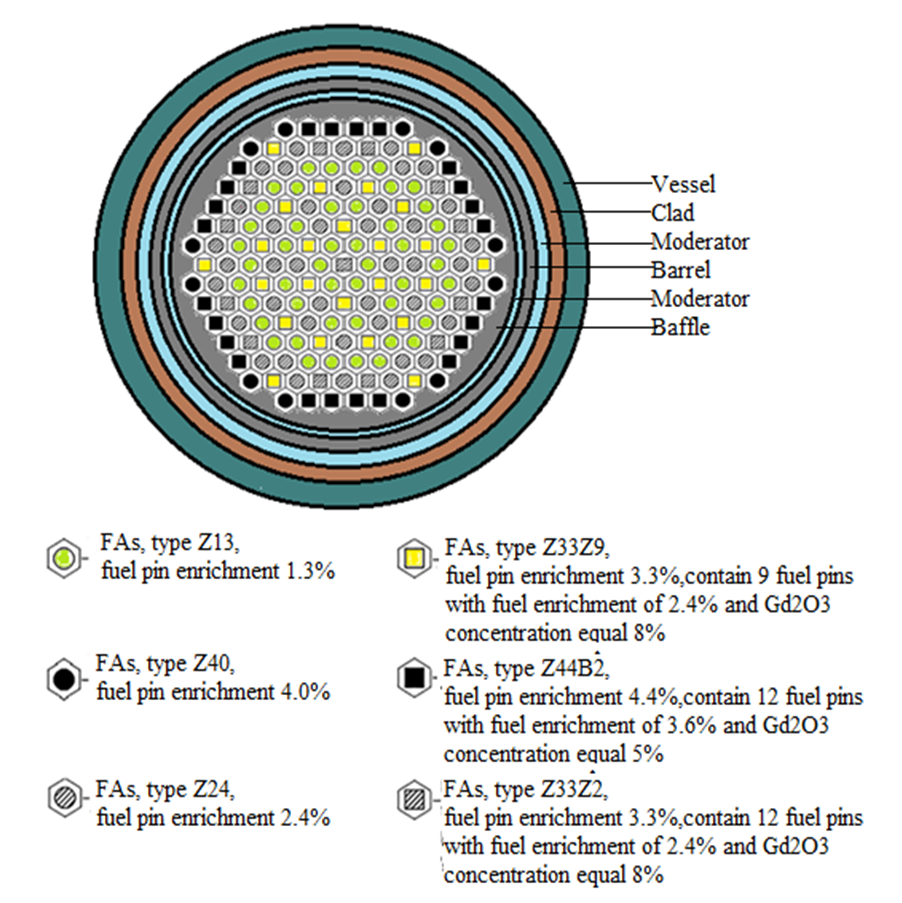 | Figure 1. Fuel assemblies' arrangement in the core |
To control and maintain the safety of the reactor, the control and protection system (CPS) is employed. Control rods (CRs) are arranged into some groups called rod cluster control group in each fuel assembly (RCCA); each one has twenty-four control rods. RCCAs are moved by the rod cluster control (RCC) system. There are 121 RCCAs divided into twelve banks that are used for changing reactivity and for reactor shutdown in normal and emergency operation conditions. Figure 2 illustrates the control rod banks distributions in the core.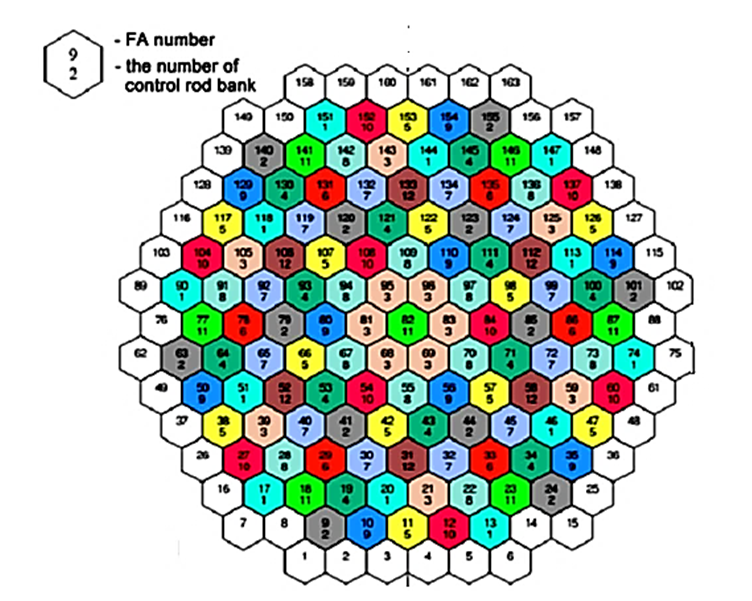 | Figure 2. Reactor core with control rod banks |
3. Model and Calculation Procedures
Neutronic parameters of fission reactors can be calculated numerically using the deterministic method or the continuous energy Monte Carlo method. The roles of both methods differ from each other. The deterministic method has been widely used in typical core design calculations for different types of fission reactors. On the other hand, the Monte Carlo method has also been widely used in cases where accurate solutions are required. The Monte Carlo method also has a specific feature of flexible processing of complicated geometry. There is no doubt that both methods are important in the calculation of neutron parameters.In this study, the neutronic parameters are calculated using Monte Carlo method by using MCNP6 code. MCNP is a general-purpose, continuous-energy, generalized-geometry, time-dependent, Monte Carlo radiation-transport code designed to track many particle types over broad ranges of energies. The code treats an arbitrary three-dimensional configuration of materials in geometric cells bounded by first- and second-degree surfaces and fourth-degree elliptical tori. MCNP6 represents the culmination of a multi-year effort to merge the MCNP5 and MCNPX codes into a single product comprising all features of both. This code is high fidelity due to its accuracy in simulating geometries and materials with continuous energy processing of nuclear parameters [9].MCNP6 horizontal simulation of the VVER-1200/AES-2006 reactor core model is illustrated in Figure 3. The cross section of the fuel, cladding, moderator, burnable absorber material and structural materials are taken from the ENDF/B-VII.1 library (ENDF71x) [10].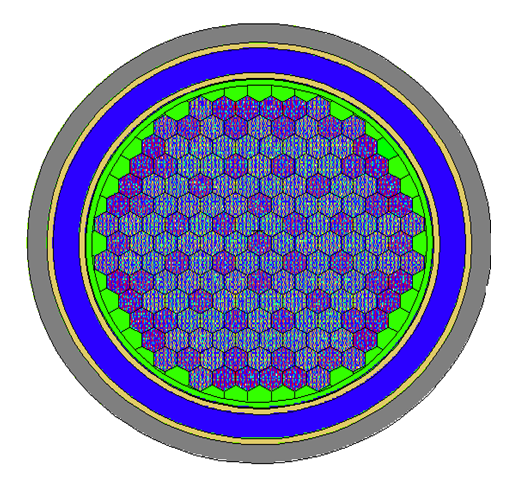 | Figure 3. Horizontal Cross Section for MCNP6 Model to VVER-1200 Reactor |
In this study, the safety parameters such as the effective multiplication factor, reactor excess reactivity, shutdown margin, reactivity coefficients, the kinetic parameters and power peaking factor are examined. Radial and axial distributions for power density and neutron flux are also determined. MCNP model VVER-1200 is verified by comparing the calculated parameters to the VVER-1200/V392M FS-SAR.
3.1. Calculations of the Effective Multiplication Factor and Excess Reactivity
The effective neutron multiplication factor (keff) plays a crucial role in determining the behavior of nuclear reactors. The value of the effective multiplication factor taking both prompt and delayed neutrons into account was acquired in the straight calculation mode of MCNP6 calculation, using data cards TOTNU with KCODE. The point source neutrons are necessary to specify, these are specified explicitly by KSRC card. In this paper, 105 neutron generations per cycle, 200 skipped cycles, and 103 active cycles are used in the calculations. | (1) |
Where:  is the reactor multiplication factors obtained when control rod is fully withdrawn from the reactor core.
3.2. Control Rod Worth Calculation
The control rod worth (CRW) is obtained by using the following formula [11]: | (2) |
Where,  is the effective multiplication factor in the case of the control rod is fully inserted in the core. There are twelve control rod groups are used in VVER1200; the control rods worth for each group is calculated.
3.3. Shutdown Margin Calculation
Shutdown margin, SDM, defines safe subcritical condition. SDM is calculated by the next equation: | (3) |
Where:  is the reactor multiplication factor obtained when all rod cluster assemblies (shutdown and control) are fully inserted except for the single rod cluster assembly of highest reactivity worth that have been fully withdrawn.
3.4. Reactivity Coefficient Calculation
Reactivity coefficients are the total temperature coefficient of reactivity;  , Fuel temperature coefficient;
  , Moderator temperature coefficient;
  , and Boron concentration coefficient;
  . The reactivity coefficients are calculated as follows:
3.4.1. Fuel Temperature Coefficient 
The fuel temperature coefficient is given by the following mathematical expression: | (4) |
Where  is the effective multiplication factor and
  is the change of effective multiplication factor as a result of the change of fuel temperature or the slope of the curve that represent the relation between
  and TF. In present calculations, the fuel coefficient is evaluated by varying the fuel temperatures from 600K - 1200K with 14 steps, and each step is 50K but the clad and moderator temperatures are kept constant at 580K.
3.4.2. Moderator Temperature Coefficient 
The moderator temperature coefficient is given by eq. 5:  | (5) |
Where  is the effective multiplication factor and
  is the change of effective multiplication factor as a result of the change of moderator/coolant temperature, or the slope of the curve that represent the relation between
  and TM. The moderator temperature coefficient is evaluated by varying the moderator temperature from 550K - 600K with 11 steps each step is 5K while the fuel temperature is fixed at 580K.
3.4.3. Total Temperature Coefficient 
The total temperature coefficient of reactivity  is the combination of both the fuel temperature coefficient
  and the coolant/moderator temperature coefficient
  as follows in Eq. 6:
 | (6) |
3.4.4. Boron Coefficient 
The Boron coefficient is given by eq. 7: | (7) |
Where  is the effective multiplication factor and
  is the change of effective multiplication factor as a result of the change of Boron concentration or the slope of the curve that represent the relation between
  and CB.The boron concentration coefficient is evaluated by varying the concentration of boron gradually from 0 - 1200 ppm with 13 steps while the temperature of both fuel and moderator are fixed at 580k.
3.5. Kinetic Parameters Calculation
Kinetic parameters are the effective delayed neutron fraction; βeff and neutron generation time and prompt neutron lifetime; lp. In the present work, the KOPTS card is used to estimate delayed neutron fraction and neutron generation time. The prompt lifetime is directly calculated by MCNP6 code. The value of the effective delayed neutron fraction is compared with that of the standard of VVER1200 [12].
3.6. Flux and Power Density Distribution
In this work, the radial neutron flux is investigated. The flux is determined using FMESH tally superimposed over the mid-plane of the core. FMESH tally is one of the features provided in MCNP to determine the flux distribution in the core. It places mesh over a geometry and calculates the track length estimate of the particle flux, averaged over a mesh cell. [13]Also, estimation of the radial power density for each fuel assembly is performed to ensure the flatness of power particularly in the center of the core. The power density in each fuel assembly was estimated by using tally F4 and tally multiplier cards (FMn). Also, the core maximum power peak is evaluated to ensure that it doesn’t exceed the power peaking factor limit to ensure the reactor safety. The power peaking factor is evaluated using the following equation. | (8) |
In addition, the axial power shape in the middle of the core is investigated at the beginning of the cycle (BOC) and at end of cycle EOC; after one year burnup.
4. Results and Discussion
In this study, the neutronic safety parameters of VVER- 1200/2006 were studied at normal operating state. The effective multiplication factor, excess reactivity, shutdown margin, reactivity coefficients, the kinetic parameters, radial power distributions, power peaking factor and the radial and axial flux distributions were investigated. Analyses of these results are also presented here.
4.1. Core Excess Reactivity, Shutdown Margin and Control Rods Worth
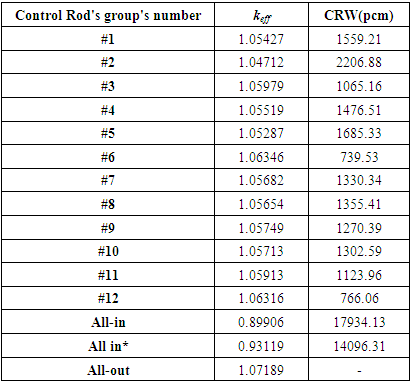
The control rod worth (CRW) of the individual group of control rods is calculated using Eq. 2 and are presented in table 2. Core excess reactivity (ρex) and the Shutdown Margin (SDM) for VVER1200 reactor are calculated using Eq. 1 and Eq. 3, the results are presented in table 3.The results from table 2 indicate that:• The worth control rod groups are different, although they have the same composition, dimensions and number of rods; they are placed in different position. The reason is that the distribution of neutron flux is different at the position of the control rod banks.• The largest worth is obtained for control rods group #2. The reason is that this group was located in fuel assemblies' type FA-Z24. This group is surrounded by three types of the fuel assemblies (FA-Z40, FAG-Z44B2 and FAG-Z33Z9) that have high uranium enrichment. As a result, the neutron flux becomes high in these regions; hence the worth of the control rods group #2 is high.Table 2. Reactivity worth of control rod groups for the VVER1200/2006 reactor
 |
| |
|
The obtained results from table 3 showed that:• The SDM is equal to the excess reactivity minus the sum of all control rods worth except the more reactive one.• The shutdown margin of VVER-1200 was sufficient, where the Safety limit of the shutdown margin for PWR must greater than 1.6%∆k/k. This designates that the worth of control rods is enough to force the reactor into a subcritical state either in the emergency situations, or with regular shutdown.Table 3. Core excess reactivity and Shutdown margin
 |
| |
|
4.2. Reactivity Coefficients
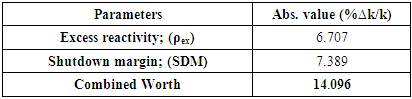
The fuel reactivity coefficient is determined by changes in the value of keff due to changes in temperature. The variations of the multiplication factor versus to the fuel temperature changes from 600 - 1200 K are presented in figure 4.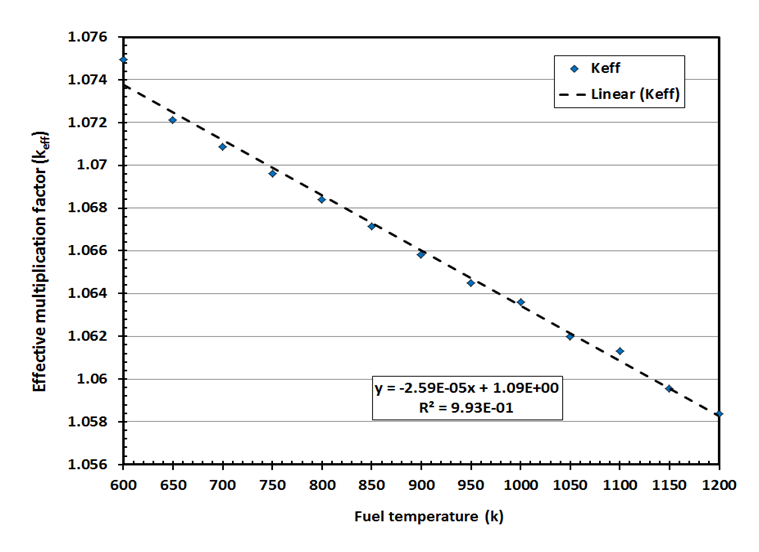 | Figure 4. Variations in effective multiplication factor versus fuel temperature increases |
Also the variations of effective multiplication factor keff with the moderator temperature ranges from 550 – 600 k are presented in figure 5. | Figure 5. Variations in effective multiplication factor versus moderator temperature increases |
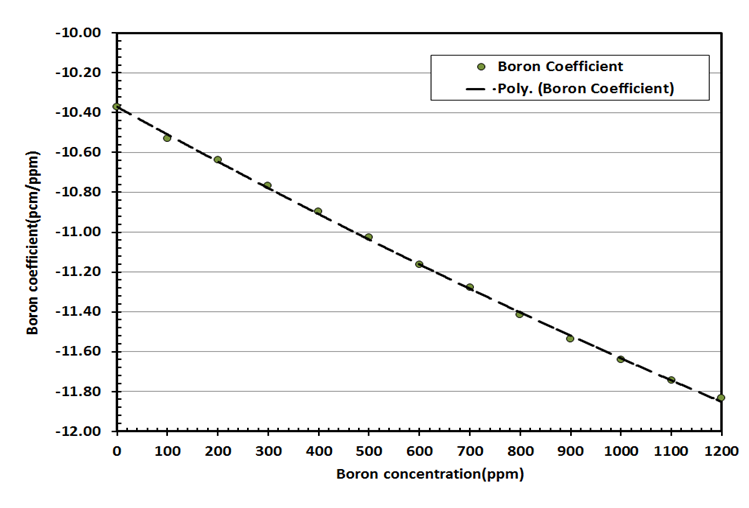
In addition, the variations of effective multiplication factor keff with the boron concentration ranges from 0 - 1200 ppm are presented in figure 6.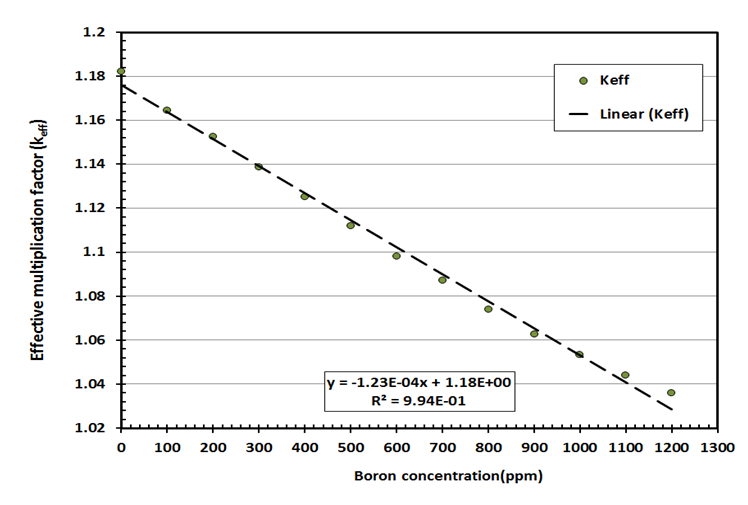 | Figure 6. Variations in effective multiplication factor versus boron concentration |
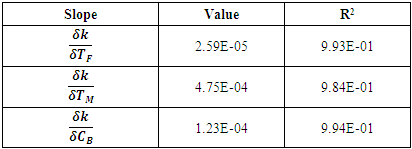
The slope of the each curve is calculated by linear fitting of the each curve, which will be used to calculate  ,
,  and
and  . The results of slopes and the determination coefficient (R2) that represents the precision of the curve fitting [14] and ranges from 0 to 1 are presented in table 4. The values of R2 designate very good representatives of the fitted data.
Table 4. Slope of the keff curves
 |
| |
|
The variations of the  ,
,  and
and  with range of temperature considered are calculated using equations (4), (5) and (7) respectively. The results of
  ,
,  and
and  are presented in figures 7, 8 and 9 respectively. The MCNP results are compared with calculated results obtained from reference [12] and with the values from FS-SAR [15].Figures 7, 8 and 9 showed that:• The fuel reactivity coefficient values are negative. Values range between -2.409pcm/K and -2.447pcm/K. The average value is -2.43pcm/K, this value conforms to the results taken from reference [12] which range from - 2.44 pcm/K to -1.73pcm/K.• When the moderator temperature rises, the reactivity curve tends to move down from -43.26 pcm/K to -44.24 pcm/K. The average value is -43.68pcm/K, This value conforms to standards in the VVER-1200’s FS-SAR which ranges from -54.8pcm/K to -26.7pcm/K.• By increasing the boron concentration, the reactivity curve moves down from -11.37pcm/ppm to -11.83pcm/ppm. The average value of
  was -11.14pcm/ppm.• Good agreements were observed between the present results and those obtained from reference [12] and with standards in the VVER-1200’s FS-SAR [15].
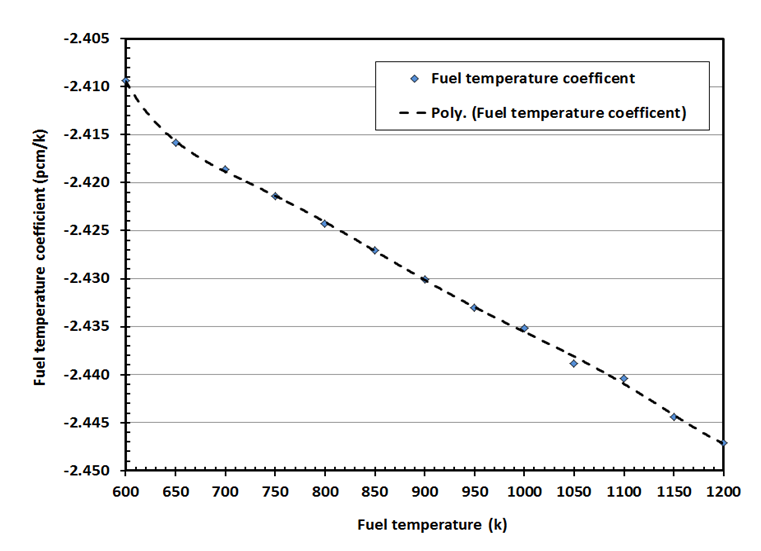 | Figure 7. Variation of the Fuel temperature coefficient with fuel temperature |
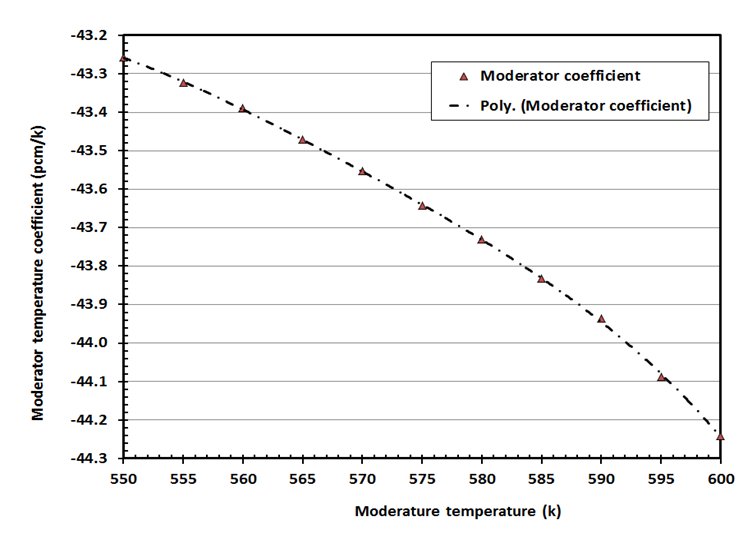 | Figure 8. Variation of the Fuel temperature coefficient with moderator temperature |
 | Figure 9. Variation of the boron coefficient with boron concentration |
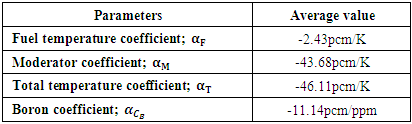
The average value of the reactivity coefficients;  and
and  are presented in the table 5.
 Table 5. Reactivity coefficients of VVER1200 reactor under normal operation
 |
| |
|
Table 5 shows negative reactivity coefficients for VVER-1200 during the normal operation state. In terms of reactor safety, a reactivity coefficient with a negative value is one of inherent safety because the reactor is stable as the temperature increases. When reactor power increases as a result of positive reactivity, the increase in reactor power will be stable as a result of negative feedback reactivity.
4.3. Kinetic Parameters
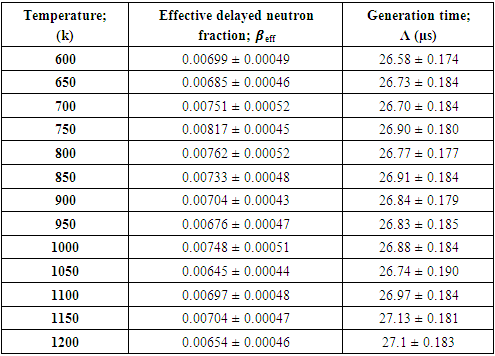
The Kinetic parameters as delayed neutron fraction and neutron generation life time of theVVER-1200 reactor were calculated at a different fuel temperature under normal operation. The results of kinetic parameters are presented in table 6. The statistical uncertainties (1 standard deviation) associated with the effective delayed neutron fraction in MCNP6 code was ranging from 0.00043 to 0.00052 while with neutron generation lifetime was from 0.174 to 0.190. Table 6. kinetic parameters vs. the fuel temperature under normal operation
 |
| |
|
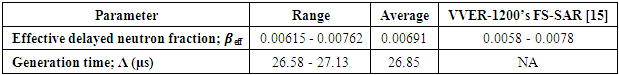
The variations of effective delayed neutron fraction and generation time with fuel temperature under normal operation are presented in figures 10 and 11 respectively. Table 7 presents the average values of kinetic parameters of the VVER-1200 reactor at normal operation compared with that of standards in the VVER-1200’s FS-SAR [15].Table 7. Kinetic parameters for VVER1200 reactor under normal operation
 |
| |
|
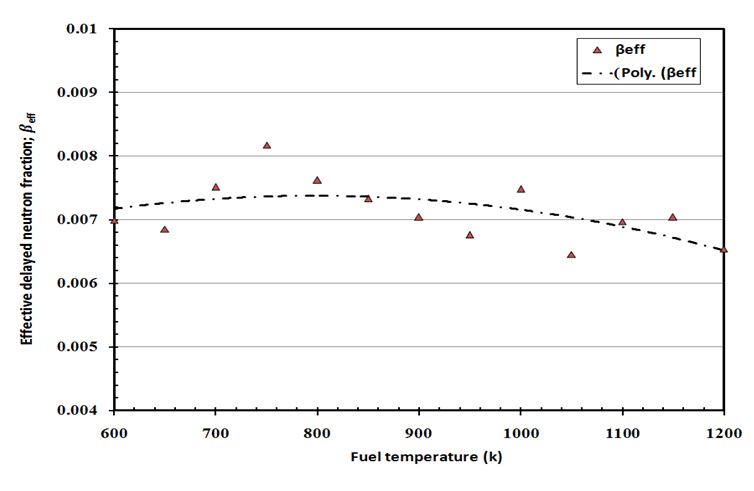 | Figure 10. Variations of effective delayed neutron fraction with fuel temperature under normal operation |
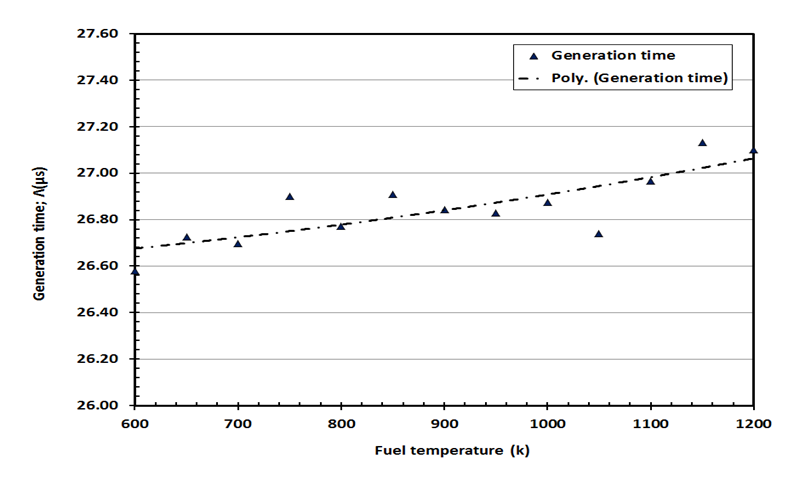 | Figure 11. Variations of generation time with fuel temperature under normal operation |
Figures 10 and 11 show that: as the temperature rises, the effective delayed neutron fraction decreases while the neutron generation time increases. With the increase in temperature, the resonance cross section increases and more neutrons are captured in U-238, hence the fission process decreases and the neutrons generated in the fuel decreases. Consequently, the delay neutrons precursors decrease and thus the effective delayed neutron fraction decreases.From tables 6 and 7 we can notice that the evaluated effective delayed neutron fraction of VVER-1200 reactor is within the range of standards in the VVER-1200’s FS-SAR [15].
4.4. Flux Distribution in the Core
The core thermal, fast and total flux distributions along X-axis and Y-axis, at the core center are presented in figures 12, 13 respectively. While, the radial flux distribution in the axial mid-plane of the core is presented in figure 14.From figures 12, 13 one can observe that:• A depression of flux in the middle of the core and the regions from 82.5 cm to 122.5 cm and from -82.5 cm to -122.5 cm; this is caused by the fact that fuel assemblies located in these regions contain of the gadolinium which is the absorber of neutrons. These results indicate that the presence of gadolinium in the core results in the reduction of the neutron flux, which leads to flattening the neutron flux, especially in the central regionas shown in figure 14 which is required for reactor safety.• In addition, the flux distributions are almost symmetrical around the center of the core, due to symmetrical distribution of the fuel assemblies in the core.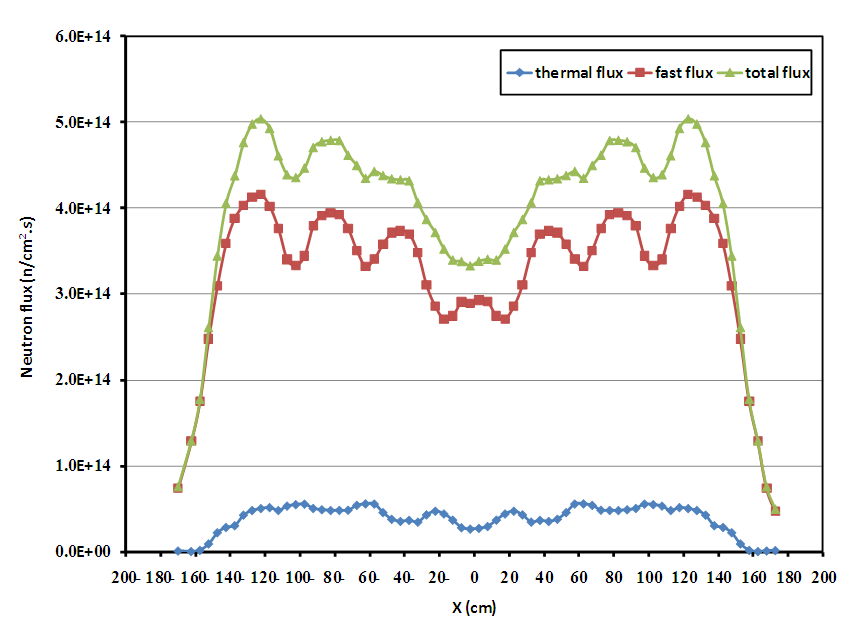 | Figure 12. Flux distribution along X-axis |
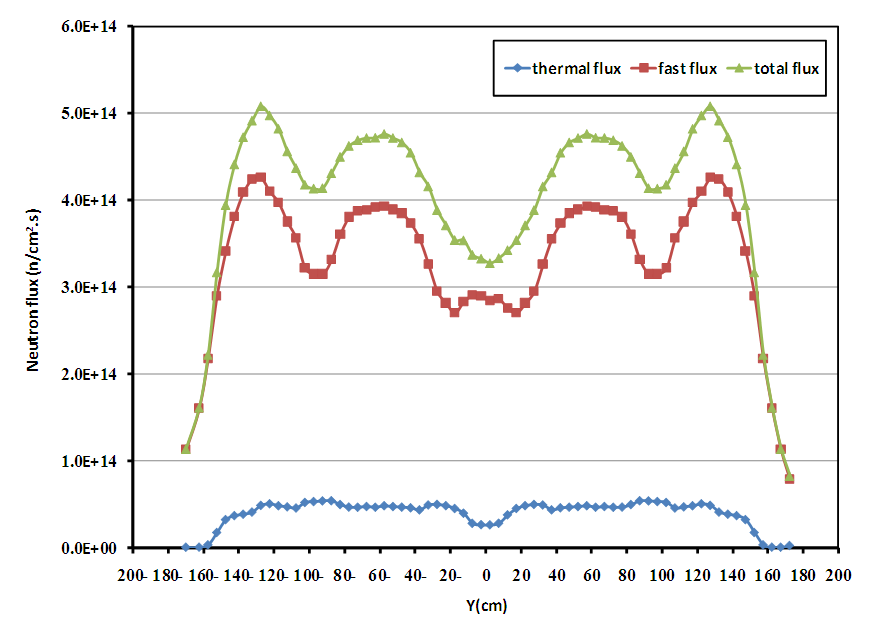 | Figure 13. Flux distribution along Y-axis |
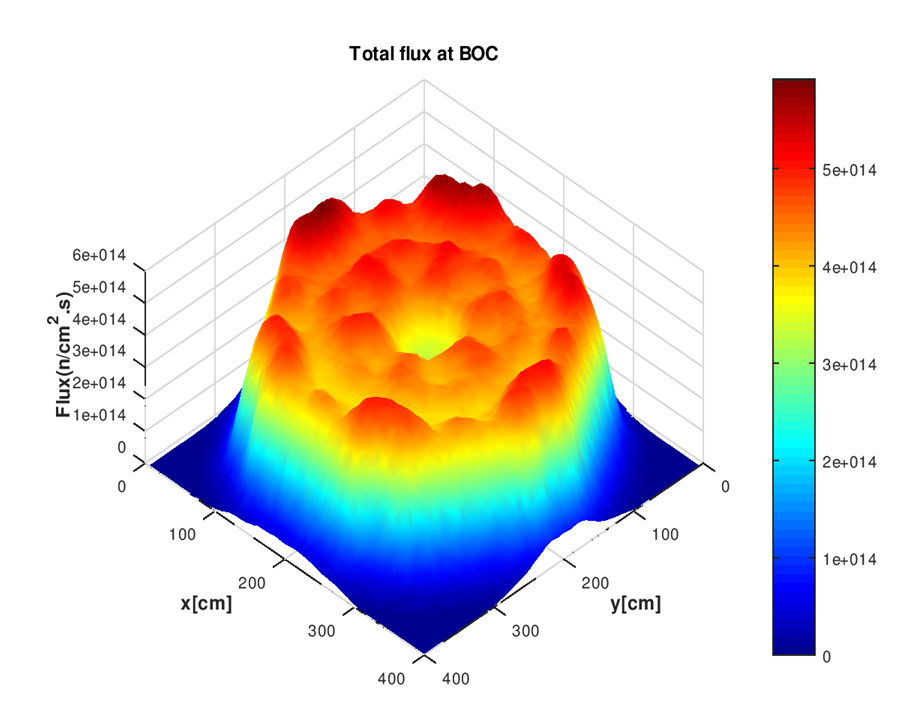 | Figure 14. Radial total flux of VVER1200 reactor |
4.5. Power Distribution and PPF
The radial power density distribution in MW for VVER-1200 reactor core is presented in figure 15. The relative power for each assembly in the core is presented in Figure 16.Figure 15 illustrated that:• The fuel assemblies located in the corner and outer edge of the core have a higher power density than the fuel assemblies in the center. The reason for this is that the highly enriched fuel assemblies are located on the periphery of the core and, fuel assemblies that contain gadolinium-absorbing rods are located in the core center.• The maximum power density was 26.29 MW and for fuel assembly number 77 of type FA-Z24 that located in the corner of the core. The power increases in these positions because the probability of fission in this region is high because of the high enrichment of these fuel assemblies. • The minimum power density was 12.54 MW and found in the fuel assembly with identification of FA-Z13 (FA number69) which located near the core center. This is due to that the distribution of fuel assemblies which contain gadolinium; FAG type Z33Z2 in the core center and FAG type Z33Z9 around the core center.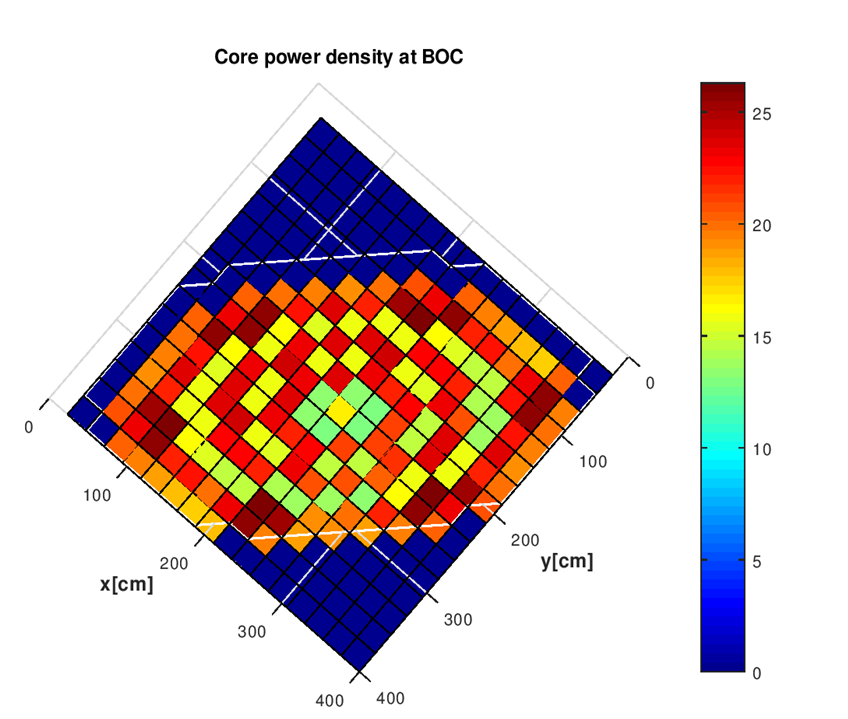 | Figure 15. Power Density Distribution in the VVER1200 Core |
Figure 16 showed that:• The radial power peaking factor (Kq) is 1.38. This value agrees with the limits of the reactor’s safety criteria as reported in reference 12; it was 1.39.• The power peaking factor has to be less than 1.5. The value of PPF does not exceed the limit of the Power Peak Factor, which ensures reactor safety.• The maximum relative power factor is 0.66. The maximum difference between the highest and lowest power distribution is 0.72. The axial normalized power distribution at Beginning of the Cycle (BOC) and at End of Cycle (after one year burnup) are investigated and presented in figure 17 and figure 18 respectively.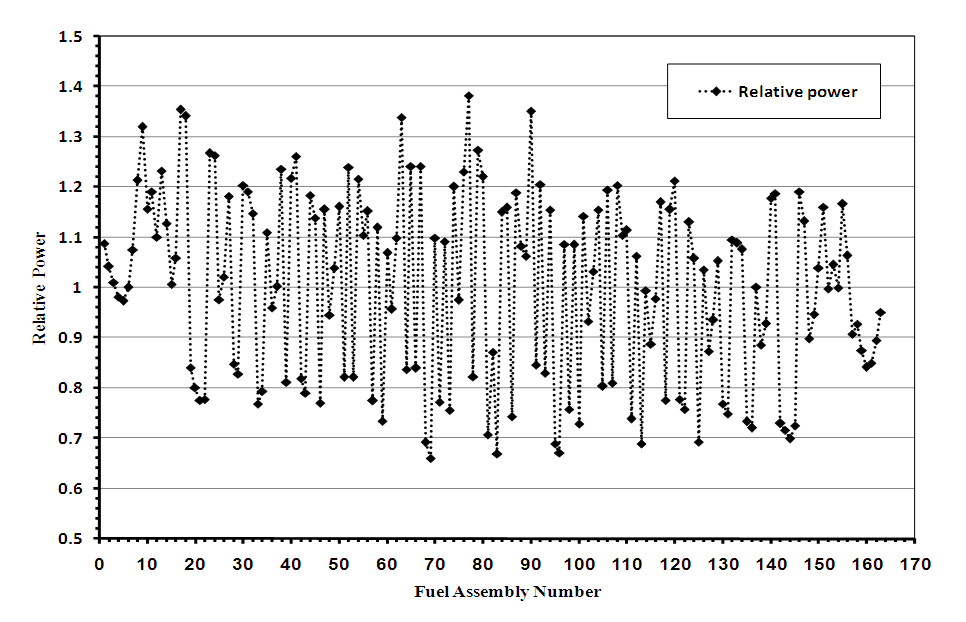 | Figure 16. Radial relative power for VVER-1200 reactor core |
Figure 17 shows that: • At the beginning of the Cycle (BOC) a near-cosine axial-shaped power was observed.• The power decreased towards the ends of the fuel rods, this due to the higher leakage is near the ends of the fuel rods.• The axial distribution of relative power with the maximum peaking factor (Kv) of 1.5 that is also suitable for the first fuel cycle as mentioned in [7]. The maximum peak was 1.5.• The axial power peaks at the height corresponding to 50% of the active length of the fuel.• Symmetrical power distribution is observed along the active length of the fuel assemblies in the core; this is due to that the material is uniformly distributed along the active length of the fuel assemblies in the core. 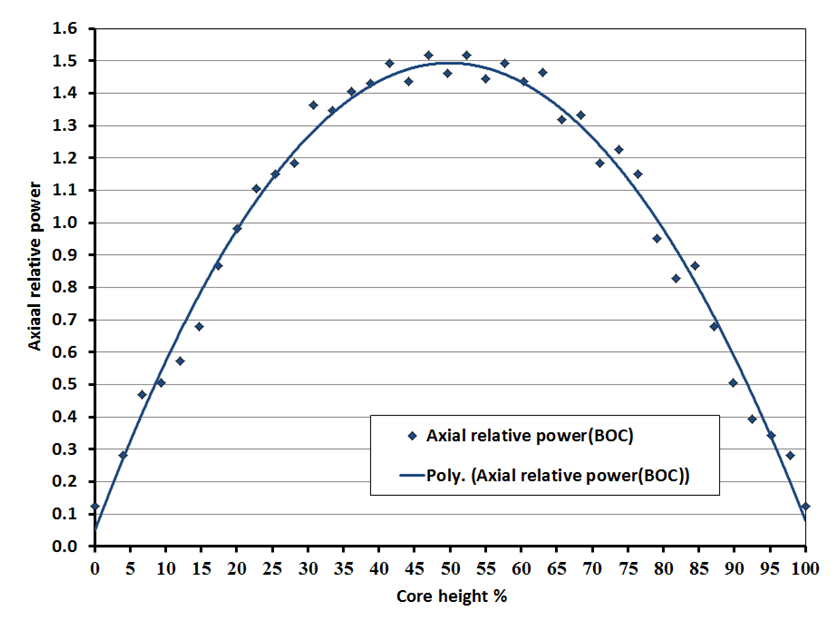 | Figure 17. Normalized axial power distribution for VVER-1200 at BOC |
Figure 18 shows that:• At the end of the cycle (EOC), the axial power shape was relatively flat in the axial mid-section with a peak power of 1.27. The flattening of the cosine shape is due to fuel depletion and the fission product buildup that occurs near the center.• The power was slightly higher at the bottom of the core than the top. This variation is due to a difference in moderator density in the lower portion of the core compared to the upper portion. The higher density of cooler water at the inlet of the assembly leads to higher reactivity, which in turn leads to higher power, than the warmer moderator at the assembly's outlet.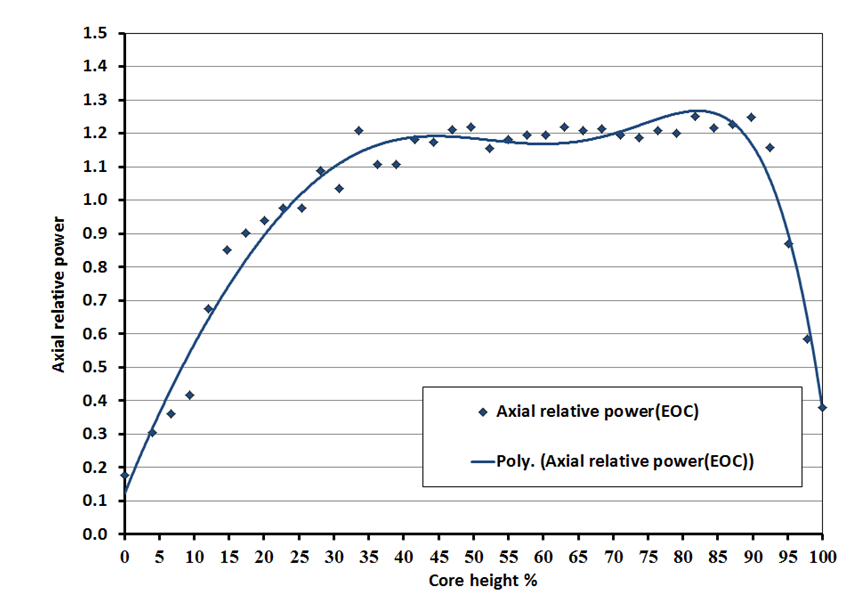 | Figure 18. Normalized axial power distribution for VVER-1200 at EOC |
5. Conclusions
Neutronic study of the nuclear reactor is performed to ensure the safe a reactor operation with enough safety margins. A detailed neutronic analysis of VVER-1200 reactor was performed in this paper. The parameters investigated were the effective delayed neutron fraction βeff, neutron generation time, the temperature reactivity coefficients, excess reactivity, shutdown margin and power peaking factor. The calculations were carried out using the MCNP6 code and the ENDF/B-VII.1 nuclear data library. Comparison of the calculated safety parameters with that given in a safety analysis report of VVER-1200/V392M was presented, and good agreements were observed. The results included the following:• The worth of control rods was sufficient to force the reactor into a subcritical state either in the emergency situations, or with regular shutdown.• Reactivity coefficients were established, under various normal operating conditions, to ensure a correct response of the reactor core. All estimated values of the reactivity coefficients were negative, ensuring reactor safety and power stability in the normal state.• The effective delayed neutron fraction was within the range of standard values of PWR.• As the temperature rises, the effective delayed neutron fraction decreases while the neutron generation time increases.• The presence of gadolinium in the core causes the flattening of the neutron flux, particularly in the central region, which is a positive requirement for reactor safety.• The flux distributions are almost symmetrical around the center of the core, due to symmetrical distribution of the fuel assemblies in the core.• The Power Peak Factor does not exceed the limit of the Power Peak Factor, which ensures reactor safety.• At the beginning of the Cycle (BOC) the maximum peak was 1.5 at the height corresponding to 50% of the active length of the fuel. • At the end of the cycle (EOC), the axial power shape was relatively flat in the axial mid-section with a peak power of 1.27.
References
| [1] | The VVER today: Evolution, Design, Safety. URL: https://www.rosatom.ru/upload/iblock/0be/0be1220af25741375138ecd1afb18743.pdf. |
| [2] | Kukshonov, A. (2012) ROSATOM Energy Solution: Engineering Perspective. Seminar on Russian Nuclear Energy Technologies & Solutions, Johannesburg, 2-3 April 2012. |
| [3] | G. P. Nyalunga, 2016. “Developing a Fresh core neutronic model at 300K for a VVER-1000 reactor type using MCNP6,” Master’s thesis, Potchefstroom Campus of the North-West University, Potchefstroom, South Africa. |
| [4] | “Advanced Nuclear Power Reactors”, 2021. http://www.world-nuclear.org/info/Nuclear-Fuel-Cycle/Power-Reactors/Advanced-Nuclear-Power-Reactors/. |
| [5] | “The State Atomic Energy Corporation ROSATOM: Russian NPPs under construction,” 2014. |
| [6] | Dien L D and Diep D N, 2017. Verification of VVER-1200 NPP Simulator in Normal Operation and Reactor Coolant Pump Coast-Down Transient, World Journal of Engineering and Technology, 2017, 5, 507-519. |
| [7] | IAEA, 1995. “In-core fuel management code package validation For WWERs,” International Atomic Energy Agency, Vienna, Tech. Report IAEA-TECDOC-847, Nov. |
| [8] | J. J. Duderstadt and L. J. Hamilton, Nuclear Reactor Analysis. USA: John Wiley & Sons, Inc., 1976. |
| [9] | Pelowitz, D.B., 2013. MCNP6 User’s Manual Version 1.0. Los Alamos National Laboratory report. LA-CP-13-00634, Rev. 0. |
| [10] | Chadwick, M.B., et al., 2011. ENDF/B-VII.1 Nuclear Data for Science and Technology: Cross Sections, Covariance, Fission Product Yields and Decay Data. |
| [11] | John R. Lamarsh and Anthony J. Baratta, 2001. Introduction to Nuclear Engineering, Third ed. Prince Hall. |
| [12] | Thanh, T., Phu, T., Long, T., and Dung, N., 2016. “Developing the core loading pattern for the VVER-1200/V491,” Institute for Nuclear Science and Technology, Vienna, Tech. Rep. VINATOM-AR 16–02. |
| [13] | Swift, A.L. et al., 2014. A Verification of MCNP6 FMESH Tally Capabilities”, LA-UR-14-28403, ANS Winter Meeting Nuclear Technology Expo. |
| [14] | Jay L. Devore, 2011. “Probability and Statistics for Engineering and the Sciences”, Boston, MA: Cengage Learning. pp. 508–510. |
| [15] | NinhThuan, 2015. Nuclear Power Plant Project, Feasibility Study Safety Analysis, NT1.0-3.101-FS-01.03.01.06.02-rev02. |

 Abstract
 Reference
 Full-Text PDF
 Full-text HTML