R. Khatun1, S. Akter1, A. N. Monika2, M. M. Rahman3, M. M. Ahasan2
1Medical Physics Division, Atomic Energy Centre, Dhaka, Bangladesh
2Institute of Nuclear Medical Physics, BAEC, Savar, Dhaka, Bangladesh
3Accelerator Facilities Division, Atomic Energy Centre, Dhaka, Bangladesh
Correspondence to: R. Khatun, Medical Physics Division, Atomic Energy Centre, Dhaka, Bangladesh.
| Email: |  |
Copyright © 2020 The Author(s). Published by Scientific & Academic Publishing.
This work is licensed under the Creative Commons Attribution International License (CC BY).
http://creativecommons.org/licenses/by/4.0/

Abstract
In Proton Induced X-ray Emission (PIXE) experiments, absorber plays an important role. It not only protects the detector from the radiation damage but also filters excessive flow of X-rays to reduce the dead time of the detecting system. A new experimental chamber has been installed at the 3 MV Van de Graaff Accelerator Facilities Division (AFD) in the Atomic Energy Centre, Dhaka (AECD). The aim of the study was to standardize the absorber thickness for the new set up of the detecting system using the nuclear analytical technique PIXE, hence we can get the accurate concentration during elemental analysis. Mylar of appropriate thickness is widely used as absorbing material, because it does not produce any unwanted secondary X-rays or γ-rays. Normally, the low Z elements present in the sample produce the maximum counts compared to the trace level high Z elements in the sample. In order to balance the counts of both low and high energy X-ray, it is very useful to have the so-called ‘funny’ filter, which consists of a suitable absorbing material with a small hole in it. In the high energy region about 100 percent of the X-ray photons pass through the absorber, the concentrations of elements Zinc, Uranium and Tellurium are not dependent on the thickness of the absorber placed in front of detector. The X-ray energies less than 2.014 keV (low energy) cannot pass through the absorber without the hole. To standardize of the detecting system for PIXE analysis, Beryllium thickness of 25 μm and Mylar of 160 μm, 340 μm, and 160 μm (with effective hole are 0.785mm2) were used. But some discrepancy between the true thickness which is the manufacturer coated value and the obtained thickness which is the “effective thickness” were found as Beryllium of 31 μm and Mylar of 142 μm, 355 μm, and 155 μm (with effective hole are 0.82mm2). The precise calibration factor was measured by using these effective thicknesses in the detecting system of the Si(Li) X-ray detector.
Keywords:
Absorber, PIXE, GUPIX, Calibration factor
Cite this paper: R. Khatun, S. Akter, A. N. Monika, M. M. Rahman, M. M. Ahasan, Standardization of Mylar Absorber Thickness of the Si(Li) X-ray Detector, Journal of Nuclear and Particle Physics, Vol. 10 No. 2, 2020, pp. 36-42. doi: 10.5923/j.jnpp.20201002.03.
1. Introduction
For this study we used Mylar absorbers of three different thicknesses in front of the Si(Li) detector to measure the effective thickness of this. We adjusted the thickness of the absorbers using thin film standard samples collected from a renowned company “Micromatter, Arlington, USA” [4]. We assumed that the thickness labeled by the company on each standard sample was accurate and tried to minimize the discrepancy between the observed and the labeled (by the manufacturer) concentration of the elements by adjusting the thickness of the absorbers. This same technique was applied by the scientists of the “Lund Nuclear Microprobe Facility, Sweden” when they constructed a new chamber to perform standardized analysis of PIXE in 2002 [5,6]. In the first iteration, all the parameters asked by GUPIX are entered along with the geometrical solid angle value. When the results from different run for different samples were compared, different trend of scatter was found and the thickness of the absorber was adjusted to minimize the difference between the obtained and the true values of concentration of the samples [1,2]. The thickness of the Beryllium (Be) layer of the detector was also corrected in the same way. The manufacturer of CANBERRA Model SL30165 Si(Li) detector labeled the beryllium layer as 25 micrometers [3]. This beryllium layer is an absorber placed by the manufacturer inside the detector to protect it from the backscattered protons. A special kind of absorber with a small hole of diameter about 1 millimeter in the middle of the absorber known as “funny filter” was also used. It is a very popular technique to detect both high energy and low energy X-rays and many researchers have done this before. For example, Sophie Gama et al in 2001 used some funny filters in their experiments [7]. Zdenek Nejedly et al of “Guelph-Waterloo Physics Institute, University of Guelph, Canada” developed an excel utility for rapid characterization of funny filters in PIXE analysis in 2004 [8].Since, the thicknesses of the absorbers are in the range of micrometers, it is quite difficult to measure the exact thickness. Normally these absorbers are made for other purposes [9,10]. So, the manufacturer does not declare the thickness accurately. Normally the PIXE analysts characterize the thickness using different techniques for the purpose of accurate PIXE results. One of the most widely technique is what we have done in this work (using the micrometer thin films). These standards are made for PIXE analysis and their labeled thicknesses are very accurate. When a new setup is installed, the standardization must be carried out to get accurate PIXE result. In this work we have standardized the system with two absorbers of various thicknesses. If someone wants to use a different absorber, he/she has to standardize that absorber in the similar manner. The elemental analysis of four samples (Neem leaves, Banyan leaves, Mango leaves and Guava leaves) has been carried out by Md. Taufique Hassan and it has been shown that the concentrations value could be very different if the correct absorber value has not been used [11]. This proves the necessity of the work. Hence, the main motto of this research work is to standardize the absorber thickness used in front of the detector that can make accuracy of the detecting system for PIXE analysis. Figure 1 represents the inner side of the chamber and Figure 2 represents the experimental arrangement of the PIXE setup. 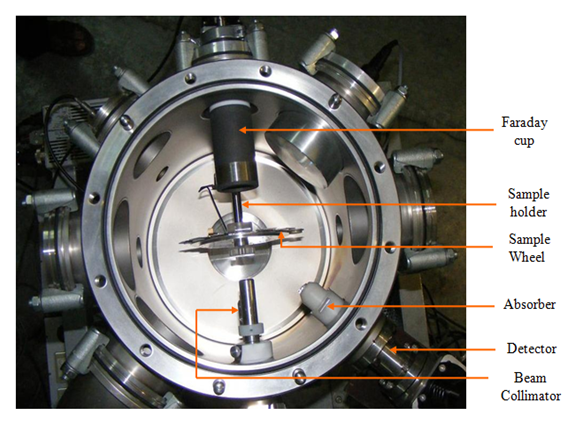 | Figure 1. Inner view of the newly installed chamber |
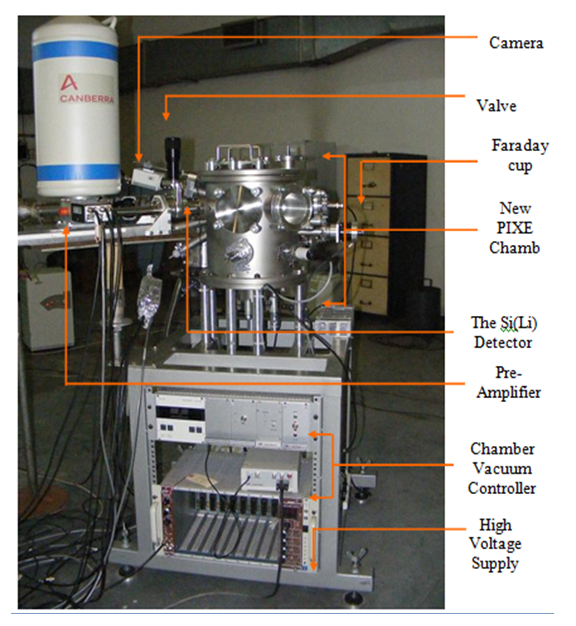 | Figure 2. Experimental setup of the new PIXE chamber |
2. Methodology
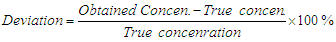
The experiments were done with 2.5 MeV proton beam using beam current of 10 nA from the 3 MV Van de Graaff Accelerator. A 30 mm2 Si(Li) detector and associated electronic setup with the resolution of 165 eV at 5.9 keV was used. The dead time of the measurements was generally less than 5%. A 200 μg/cm2 gold diffuser foil was used to homogenize the beam onto the target samples. The calibration of the PIXE setup has been done with 15 thin film standards of micrometers order thickness. For the determination of the “effective thickness”, “no absorber” was used in front of the detector. We used GUPIX software [12] with DAN32 interfacing software [13,14] for analyzing PIXE spectra in our experiment. In the GUPIX software input, first the thickness of the Be layer of 25 µm was used. The GUPIX H value was given equal to the geometrical solid angle which was determined using equation (2). The value of the solid angle is 0.0015306. When the input of Be thickness was 25 µm, the deviations, for almost all elements, were found to be above 20%. As the thickness of Be layer is sensitive to the low energy X-ray, it was possible to reduce the deviation in the low energy region. It was tried to manipulate the thickness of the Be layer in such a way that the low energy X-ray elements concentration becomes close to the true value. In the present experiment the altered thicknesses of the absorbers are not “real thicknesses” but “effective thicknesses”. The true concentration was given by the manufacturer specifications. Calibration Factor, GUPIX H value and the % of Deviation of the concentration were determined by the following relations: | (1) |
 | (2) |
 | (3) |
3. Results and Discussions
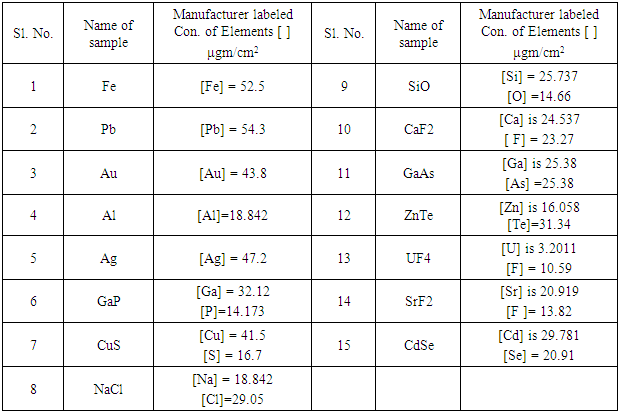
In this experiment, 15 different thin film standard samples were used. The thin standard samples allow the proton beam to pass through which is a vital advantage for the charge measurement. The following Table 1 is the list of standard samples used in our experiments.Table 1. List of standard samples
 |
| |
|
3.1. Characterization of Mylar Absorber of Thickness 160 µm
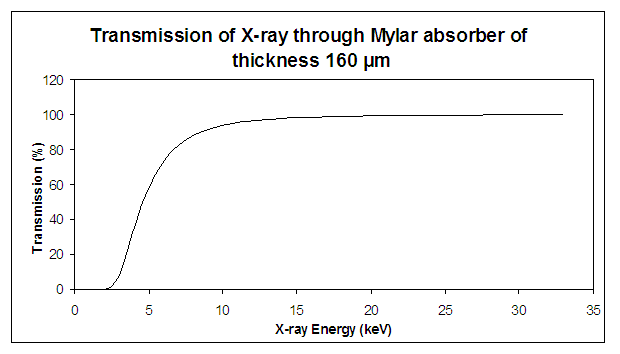
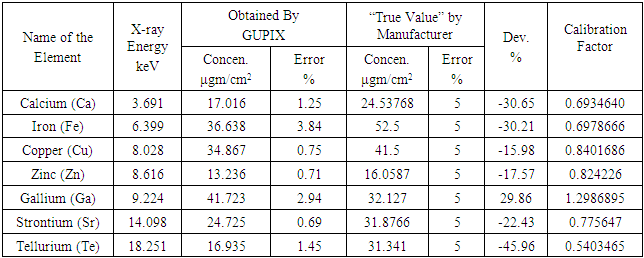
Mylar filter of thickness 160 μm was placed in the absorber holder between the detector and the sample. The transmission curve (Fig. 3) was obtained using the GUPIX software. This curve clarifies the energy dependence of transmission of X-ray. From this curve we found out elements which were dependent on this absorber thickness. From this transmission curve it can be seen that X-ray energies less than 2.014 keV cannot pass through this absorber, however about 100 percent X-ray photons can transmit through it if the energies are greater than 10 keV. It can therefore be said that X-ray energies from around 2 keV to around 9 keV are highly sensitive to Mylar thicknesses.By changing the absorber thickness in the GUPIX input it was observed that, the concentrations of the elements in the low energy region become close to their true value. But at the high energy region, some discrepancy was found. This may be due to the fact that transmission of X-ray is more than 90% in the high energy region. For calibration of the Mylar of 160 μm, we put all the input parameters in the GUPIX software. At first we put the manufacturer labeled value of the thickness of absorber Be layer (25 μm) and GUPIX H value was given equal to the geometric solid angle 0.001530612; we obtained the data given in Table 2.Table 2. Data for Be Thickness 25 μm and Mylar Thickness 160 μm
 |
| |
|
 | Figure 3. Transmission as a function of X-ray energy through Mylar absorber of thickness 160 μm |
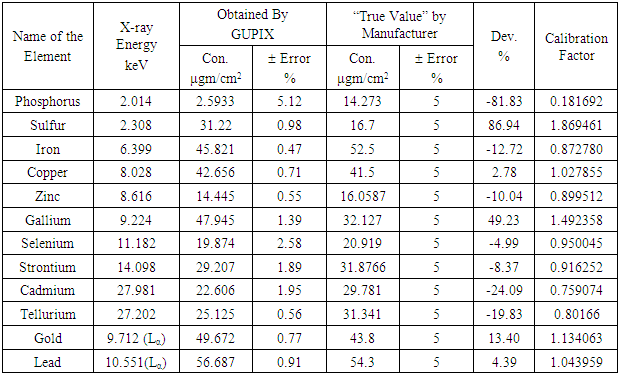
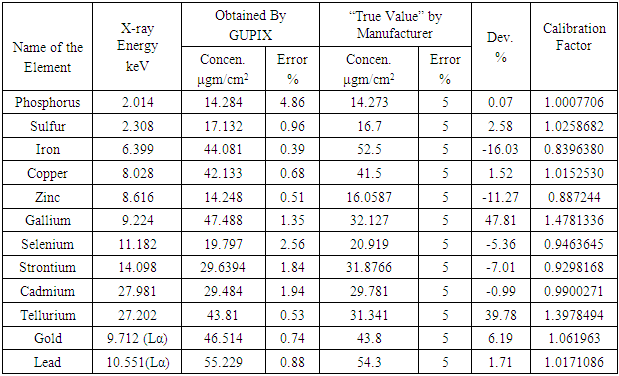
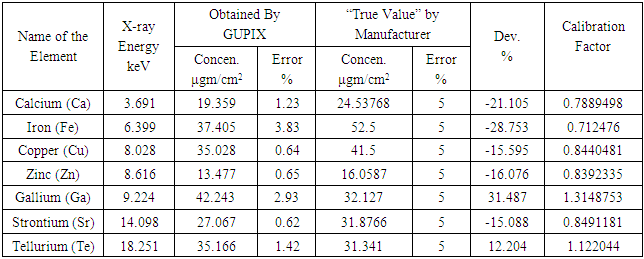
In Table 2, we found that deviations were very high for Phosphorus (-81.83%), Sulfur (86.94%), Iron (-12.72%), Zinc (-10.04%) and Gallium (49.23%) and this is why their calibration factors are also far from 1. As these are dependent on the absorber thickness (Figure 3), we tried to minimize the deviations and hence make the calibration factor close to 1.We started changing the absorber thickness in the GUPIX input. In this case, we observed that, we were able to make the concentration of the elements in the low energy region close to their true value. But, at the high X-ray energy region the measured concentration of elements are not close to the true value. This was because the transmission of high energy X-ray was more than 90% in this region.At the changing state, we finally found that, at Be layer thickness 31 μm and the absorber thickness 142 μm, the calibration factor for most of the elements (in low energy region), tends to be 1 (Table 3). On the other hand, the calibration factor moved a little bit away from the previous value for Iron. It was 0.8727 before and now it is 0.8396. When we put the absorber thickness 155 μm, the calibration factor of Iron comes close to 1 but for the other elements it goes away from 1. So, we took the closest value of thickness of Mylar absorber for which almost all elements at the low energy region was close to 1. So, the “effective thickness” of “Mylar absorber” is found to be 142 μm.
3.2. Characterization of Mylar Absorber of Thickness 340 μm
Then we used a Mylar absorber of thickness 340 μm in between the detector and the sample. The Figure 4 is the transmission curve as a function of X-ray energy for the Mylar absorber of thickness 340 μm. From this figure, we found that X-ray energies less than around 2.5 keV cannot pass through this absorber. They are totally absorbed by the absorber. On the other hand, about 100 percent X-ray photons can transmit through it for X-ray energy greater than 10 keV. So, change of the absorber thickness have no effect on these high energy X-rays. Now for calibration of the Mylar absorber with thickness 340 μm, we put all the input parameters in the GUPIX software.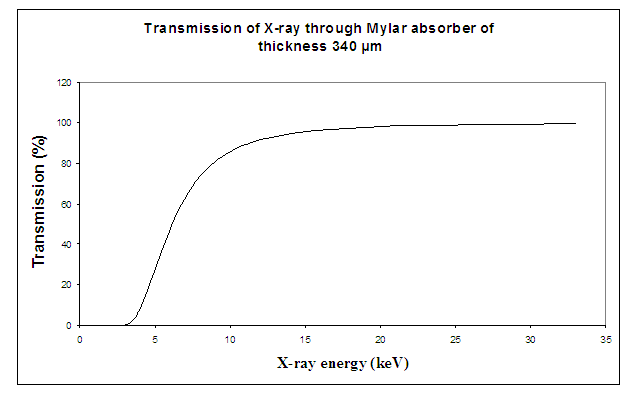 | Figure 4. Transmission as a function of X-ray energy through Mylar absorber of thickness 340 μm |
Table 3. Data for Be Thickness 31 μm and Mylar Thickness 142μm
 |
| |
|
The obtained data are presented in Table 4 and observed that the deviations for most of the elements were above 15%. So, we found the necessity of changing absorber thickness. For a perfect absorber thickness, the calibration factor should be 1. Then, we started changing the absorber thickness. It was very difficult to force the concentration of all low energy elements to their “true value”. Finally we found that for the absorber thickness 355 μm, all the concentrations of elements were closest to their respective “true value”. As their calibration factor was satisfactory (Table 5), we considered that the Mylar thickness of 355 µm was the most appropriate value.Table 4. Data for Be Thickness 25 μm and Mylar Thickness 340 μm
 |
| |
|
Table 5. Data for Be thickness 31 μm and Mylar Thickness 355 μm
 |
| |
|
Therefore, the determined “effective thickness” of Mylar 340 µm was 355µm.
3.3. Characterization of Mylar Absorber of Thickness 160 μm with Hole of Area 0.785 mm2
Figure 5 represents the graph for transmission of X-rays through the absorber with a hole area 0.785mm2 (radius r = 0.5mm, area = π × r2). It is clear that there is a probability for the low energy X-ray photons to pass through the hole. Comparing the Figure 5 with Figure 3, it is observed that X-ray energies less than 2.014 keV cannot pass through the absorber without the hole. It can be found that using the hole, the curve do not cut the X-axis and hence there is an opening which is absent in Figure 3. This is the main advantage to use a hole in the absorber. Now, for the calibration of Mylar absorber with thickness 160 μm with hole of 0.785 mm2 area, we put all the input parameters in the GUPIX software. We found that the deviations of some elements are higher than our considerable value. Then, we started manipulating the thickness of the Mylar absorber. In this time we also needed to change the area of the hole. We first fixed the Be layer thickness at 31 µm. Then, we adjusted the absorber thickness. Using the approximate hole area in the GUPIX input, we ran the samples for different times. In this way, a rough absorber thickness was determined. Then, we started changing the hole area to get concentrations close to their “true value”. Then we obtained an approximate hole area. After that we again adjusted the absorber thickness. This process was continued as long as the best calibration factor (close to 1) for all the elements was achieved.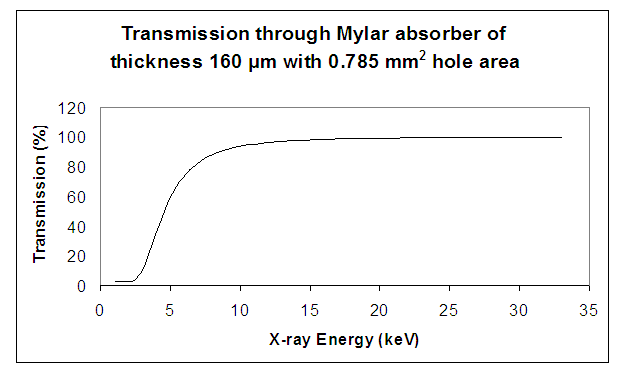 | Figure 5. Transmission of X-ray through the Mylar 160 µm with 0.785mm2 hole |
In this way we found that, at the absorber thickness 155 µm and hole area 0.82mm2 and Be layer thickness 31 µm, most of the calibration factors are closer to 1. For all the run by the GUPIX software, the error and the minimum detection limit (MDL) was quite low. Figure 6 and Figure 7 explained the data for the above two changes for holes and absorber thickness also.Comparing the Figure 6 and Figure 7, we found that in the second graph the most in the low energy region (under 4 keV) became close to 1. It is clear from the Figure 7 that, X-rays of energy greater than 8 keV have above 90% transmission probability. So, for the elements of energies greater than 8 keV, the obtained concentrations neither depend on the absorber thickness nor the area of the hole. This is why the change in calibration factor is not observed in that region.Hence, we found that the “effective thickness” of Mylar absorber is 155 µm and the “effective area of the hole” is 0.82 mm2.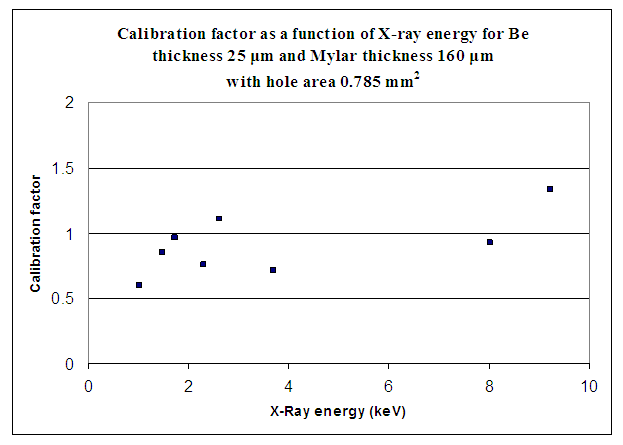 | Figure 6. Calibration factor as a function of X-ray energy for Be layer of thickness 25 μm and Mylar absorber of thickness 160 μm with hole of area 0.785 mm2 |
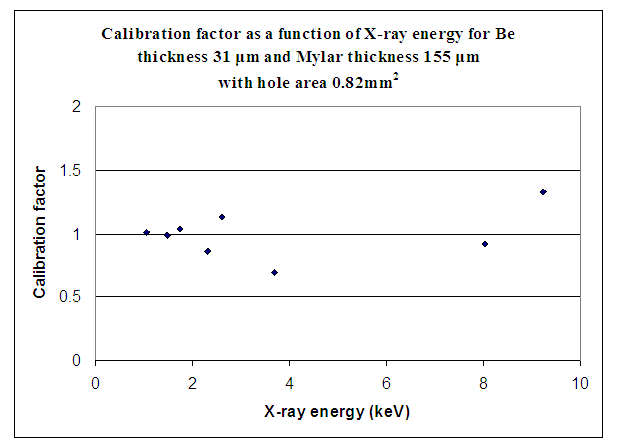 | Figure 7. Calibration factor as a function of X-ray energy for Be layer of thickness 31 µm and Mylar absorber of thickness 155 µm with hole of area 0.82 mm2 |
4. Conclusions
Several thin film standards were used for this study to adjust the thickness and area of the hole of the absorbers. The obtained effective thickness of the window material (Beryllium) of the detector was 31 μm. Mylar absorbers of three different thicknesses were used in this experiment. Among them two is without hole and one is with hole. The obtained effective thickness of two absorbers was 142 μm and 355 μm (true thickness was 160 μm and 340 μm respectively). The obtained effective thicknesses for Mylar absorber were 155 μm with hole area of 0.82 mm2 where as true thickness was 160 μm with hole area of 0.785 mm2. In the high energy region (greater than 8 keV) about 100 percent of the X-ray photons pass through the absorber. X-ray energies less than 2.014 keV (low energy) cannot pass through the absorber without the hole. During the experiments, the error and minimum detection limit (MDL) of the GUPIX software was found to be very small. This means that the software could handle the spectra very well. Despite some limitations, we confidently claim that our measured values “effective” thicknesses of the absorber can give more accurate result in further PIXE analysis. In this work we have standardized Mylar absorber of different thicknesses and this would be useful to analyze various samples in the new PIXE set up. If someone wants to use a different absorber, he/ she have to standardize that absorber in the comparable fashion.
ACKNOWLEDGEMENTS
The authors wish to thank all the members of Accelerator Facilities Division, AECD for their continuous help during the course of this study. Special thanks to Dr. Asad Shariff, CSO, Tandem Accelerator Facilities Division, Savar, for helping us throughout the experimental works.
References
| [1] | A. Shariff, K. Bülow, M. Elfman, P. Kristiansson, K. Malmqvist, J. Pallon, 2002, Calibration of new chamber using GUPIX software package for PIXE analysis, Nuclear Instruments and Methods in Physics Research Section B, 189, 131-137. |
| [2] | A. Shariff, B. G. Martinsson, V. Auzelyte, M. Elfman, P. Kristiansson, K. G. Malmqvist, 2004, Evaluation of low-energy tailing parameters of a HPGe X-ray detector to be used in GUPIX software library for PIXE analysis, Nuclear Instruments and Methods in Physics Research Section B, vol. 219-220, 110-114. |
| [3] | Detector manual, CANBERRA Model SL30165 Si(Li) detector. |
| [4] | MicroMatter Co., MicroMatter X-Ray Fluorescence Calibration Standards, 123 Madrona Lane, Deer Harbor, WA 98243. |
| [5] | A. Shariff, 2004, Development of New Experimental Facilities at the Lund Nuclear Microprobe Laboratory, PhD thesis, Department of Physics, Lund Institute of Technology, Lund University. |
| [6] | A. Shariff, K. Bülow, M. Elfman, P. Kristiansson, K. Malmqvist, J. Pallon, 2002, Calibration of new chamber using GUPIX software package for PIXE analysis, Nuclear Instruments and Methods in Physics Research Section B, 189, 131-137. |
| [7] | S. Gama, M. Volfinger, C. Ramboz, O. Rouer, 2001, Accuracy of PIXE analyses using a funny filter, Nuclear Instruments and Methods in Physics Research Section B, 181, 150-156. |
| [8] | D. Nejedly, J. L. Campbell, S. Gama, An Excel utility for the rapid characterization of “funny filters” in PIXE analysis, 2004, Nuclear Instruments and Methods in Physics Research Section B, Volumes 219-220, 136-139. |
| [9] | http://www.webopedia.com/TERM/M/Mylar.html |
| [10] | http://www.world-aluminium.org/About+Aluminium/Story+of |
| [11] | M. T. Hassan, 2008, Calibration of a New Experimental Chamber Using GUPIX Software Package for PIXE Analysis, M. Sc. Thesis, University of Dhaka. |
| [12] | http://pixe.physics.uoguelph.ca/gupix/main/ |
| [13] | http://www.microbeams.co.uk/Products.html#dan32 |
| [14] | J. Murray, G. Grime, Identification of elements in proteins by microPIXE (Proton Induced X-ray Emission), http://biop.ox.ac.uk/www/lj2001/garman/garman_03.html. |

 Abstract
 Reference
 Full-Text PDF
 Full-text HTML