Heba K. Louis, Esmat Amin
Safety Engineering Department, Nuclear and Radiological Regulation Authority (NRRA), Cairo, Egypt
Correspondence to: Heba K. Louis, Safety Engineering Department, Nuclear and Radiological Regulation Authority (NRRA), Cairo, Egypt.
| Email: |  |
Copyright © 2016 Scientific & Academic Publishing. All Rights Reserved.
This work is licensed under the Creative Commons Attribution International License (CC BY).
http://creativecommons.org/licenses/by/4.0/

Abstract
The neutronic calculations for power reactors are one of the most important steps for the safety of reactors. Performing calculations on benchmark problems related to neutronics calculations on the lattice and core levels is a preliminary step for the preparation of human building capabilities in neutronic calculations for power reactors. In present work the computational benchmarks of low enriched uranium (LEU) and (MOX) fuel assemblies for VVER-1000 have been calculated by the Monte Carlo code (version MCNPX 2.7). The aim of this work is toevaluate the accuracy of the Russian used codes and libraries against the MCNPX code and the most recent ENDF libraries. Five calculational states are performed; these states cover the operational states and cold conditions. The variations of k-inf and assembly average isotopic composition versus burnup are calculated. Several reactivity effects as 135Xe and 149Sm poisoning; Soluble boron effect; Fuel temperature (Doppler) effect; Total temperature effect also are performed. To ensure that our existing calculational method can accurately model VVER-1000 reactors with mixed-oxide (MOX) fuel, comparison is required. A comparison of the results was performed with the of Monte carol code MCU-REA and with the benchmark mean results, in most results excellent agreement was observed.
Keywords:
VVER-1000, Pressurized water reactor (PWR), Burnup, Reactivity effect and MCNPX code
Cite this paper: Heba K. Louis, Esmat Amin, The Effect of Burnup on Reactivity for VVER-1000 with MOXGD and UGD Fuel Assemblies Using MCNPX Code, Journal of Nuclear and Particle Physics, Vol. 6 No. 3, 2016, pp. 61-71. doi: 10.5923/j.jnpp.20160603.03.
1. Introduction
VVER (Water-Water Energetic Reactor) is one of the most successful and influential branches of nuclear power plant development, and the technology is widely distributed throughout the world.Several benchmark exercises have been proposed by an international Experts Group at the OECD/NEA with the intent to investigate the core physics behavior of a VVER-1000 reactor loaded with 2/3rd of (LEU) fuel assemblies and 1/3rd of (MOX) fuel assemblies [1].In the VVER-100 Benchmark a total of six solutions were performed from five countries with each participant using different methods and data combinations. Two of the solutions are based on continuous energy Monte Carlo methods, while the remaining solutions are based on collision probability (or similar) methods. The submitted solutions covered several data libraries. The goal of this work is to perform calculations of the VVER-1000 computational benchmarks with a more recent tool and libraries and make individual comparison with that used by the Russians.The results for computational benchmarks of (LEU) and (MOX) fuel assemblies by using the Monte Carlo code (version MCNPX 2.7.0) [2] with ENDF/B-VII.1 (ENDF71x) library [3] are presented in the next sections.MCNPX is a general-purpose Monte Carlo N–Particle code that can be used for neutron, photon, electron, or coupled neutron/photon/electron transport, including the capability to calculate eigenvalues for critical systems. The code treats an arbitrary three-dimensional configuration of materials in geometric cells bounded by first- and second-degree surfaces and fourth-degree elliptical tori.The present results are compared with the benchmark mean results and with the results of the RRC-KI, Russian Federation; they used the MCU Monte Carlo code MCU-REA code. MCU-REA is a general-purpose continuous energy Monte Carlo code for solving the neutron transport problems including the depletion ones. It is used with both pointwise and step function representations of cross sections. MCU data libraries are DLC/MCUDAT-2.1 based on ENDF/B-VI; JENDL-3.2; BROND.Benchmark model specificationThe benchmark model consists of two assembly types:- Uniform LEU fuel assembly with 12 U/Gd rods (UGD variant).- Profiled MOX fuel assembly with 12 U/Gd rods (MOXGD variant).The VVER-1000 assemblies are hexagonal in design and consist of one central tube, 312 fuel pin locations (12 of which are U/Gd rods), and 18 guide tubes. The clad and structural materials are composed of a Zr-Nb alloy.The UGD variant is shown in Figure 1 and consists offuel rods with 3.7 wt. % enrichment. The 12 U/Gd pins have a 235U enrichment of 3.6 wt. % and a Gd2O3 content of 4.0 wt. %. The MOXGD variant is shown in Figure 2 and contains fuel rods with three different plutonium loadings. The central region contains MOX pins with 4.2 wt. % fissile plutonium (consisting of 93 wt. % 239Pu), two rings of fuel rods with 3.0 wt. % fissile plutonium, and anouter ring of fuel rods with 2.0 wt. % fissile plutonium. The 12 U/Gd rods are in the same locations as in the UGD variant configuration and have the same design.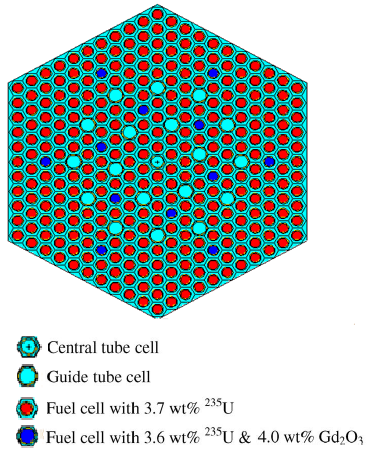 | Figure 1. The configuration of uniform LEU fuel assembly with 12 Gd BA rods |
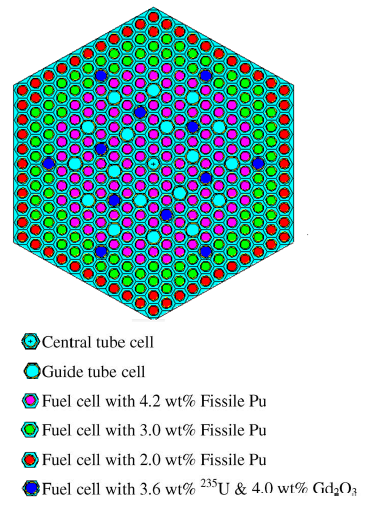 | Figure 2. The configuration of profiled MOX fuel assembly with 12 Gd BA rods |
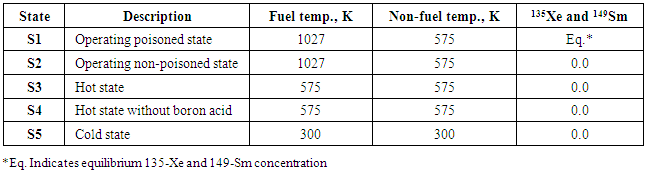
The benchmark asks for depletion calculations to a burnup of 40 MWd/kgHM along with several branch calculations at five specific sets of reactor states S1 to S5. The requested state is presented in table 1.Table 1. Calculation states
 |
| |
|
2. Calculation Procedures
This paper describes the detailed results of a benchmark study investigating the physics of aVVER-1000 reactor using low-enriched uranium and MOX fuel. The calculations were performed with the MCNPX code (version MCNPX 2.7). The cross section data for all of the isotopes are taken from the ENDF/B-VII.1 (ENDF71x). For criticality calculation, a total of 1000 neutron cycle with100 non active cycle and 106 histories per generation were used.In the present paper, the calculations are performed for different states as following:§ For S1 state (operating poisoned state), burnup calculation has been performed with a power density of 108 MWt/m3 up to a burnup of 40 MWD/kgHM with 21 burnup steps (1 MWd/kgHM in the interval 0 -15 MWd/kgHM and 5 MWd/kgHM in the interval 15-40 MWd/kgHM)). The present calculations for this state included:- The variation of kinf with burnup for UGD variant and MOXGD variant assemblies - Averaged concentrations of the fuel assembly for 235U, 236U, 238U, 238Pu, 239Pu, 240Pu, 241Pu, 242Pu, 135Xe, 149Sm, 155Gd and 157Gd.§ Several reactivity effects at burnup levels 0, 20, 40 MWd/kgHMhave been determined based on the kinf values corresponding to the reactor states as follow: - 135Xe and 149Sm poisoning effect on reactivity have been determined based on the kinf values corresponding to the reactor states S1 (operating poisoned state) and S2 (operating non-poisoned state);- soluble boron effect on reactivity for a boron change of 600 ppm has been determined based on the kinf values corresponding to the reactor states S3 (isothermal hot state with boron) and S4 (isothermal hot state without boron);- Fuel temperature (Doppler) effect on reactivity of assemblies for a fuel temperature change from 575 to 1027 K has been determined based on the kinf values corresponding to the reactor states S2 (state with Tfuel = 1027 K) and S3 (state with Tfuel = 575 K) have been used; and - Total temperature effect on reactivity of assemblies for a temperature change from 300 K to 575 K has been determined based on the kinf values corresponding to the reactor states S4 (hot state T = 575 K) and S5 (cold state with T = 300 K).
3. Results and Discussion
As mentioned previously, the calculations for the five reactor states have been performed using MCNPX code with ENDF/B-VII.1 (ENDF71x) library. The results are presented in the following:
3.1. The Variation of k-inf with Burnup
The results of infinite multiplication factors for UGD variant fuel assembly and MOX fuel assembly with respect to burnup for the operating poisoned state (S1) is shown in Figure 4.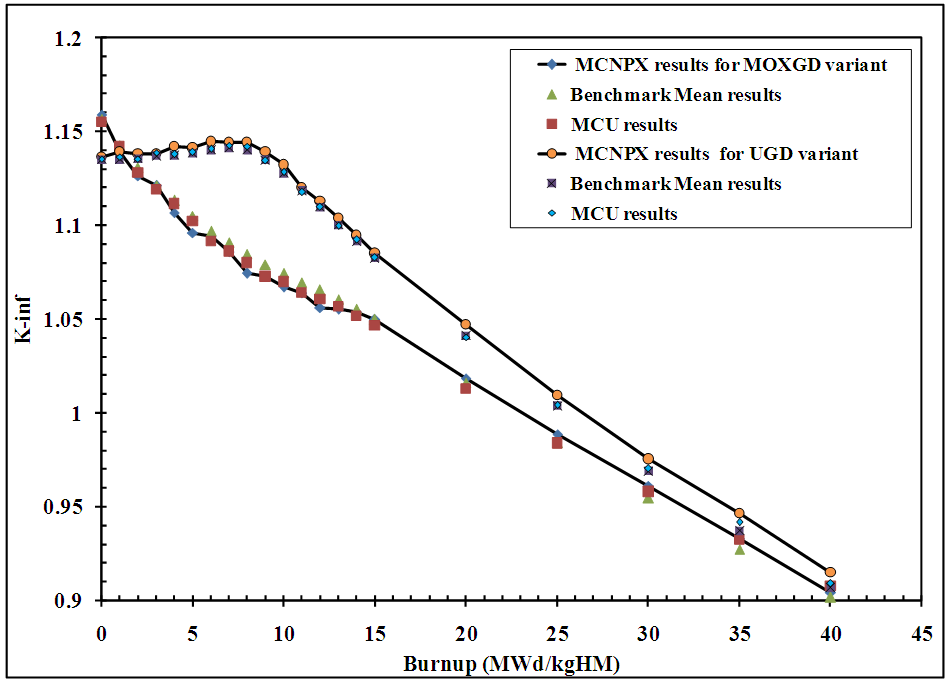 | Figure 4. Variation of K-inf with respect to burnup for UGD variant and MOXGD variant assemblies |
Figure 4 shows the comparison of the MCNPX results with both the benchmark's participants mean results and MCU results.As shown in figure 4 we can see that for UGD variant assembly, as the burnup increases the k-inf initially increases due to the rapid burn out of the Gd isotopes and the buildup of Pu-239 and then, decreases while for MOXGD variant assembly the burn up of Pu-239 is not compensated by the butnup of gadolinium isotopes and then, decreases faster with almost the complete burnup of gadolinium.The deviation of the MCNPX results from the mean benchmark results and the Russian MCU code are small and amounts to a maximum of 0.565, 0.679 for UGD variant and 0.650, 0.979 for MOXGD variant.
3.2. Assembly Average Isotopic Composition verse to Burnup
The changes in isotopic composition with respect to burnup for various fuel nuclides (235U, 236U, 238U, 238Pu, 239Pu, 240Pu, 241Pu, 242Pu, 135Xe, 149Sm, 155Gd and 157Gd) are calculated for both UGD and MOX fuel assembly and are presented in figures 5- 15 respectively.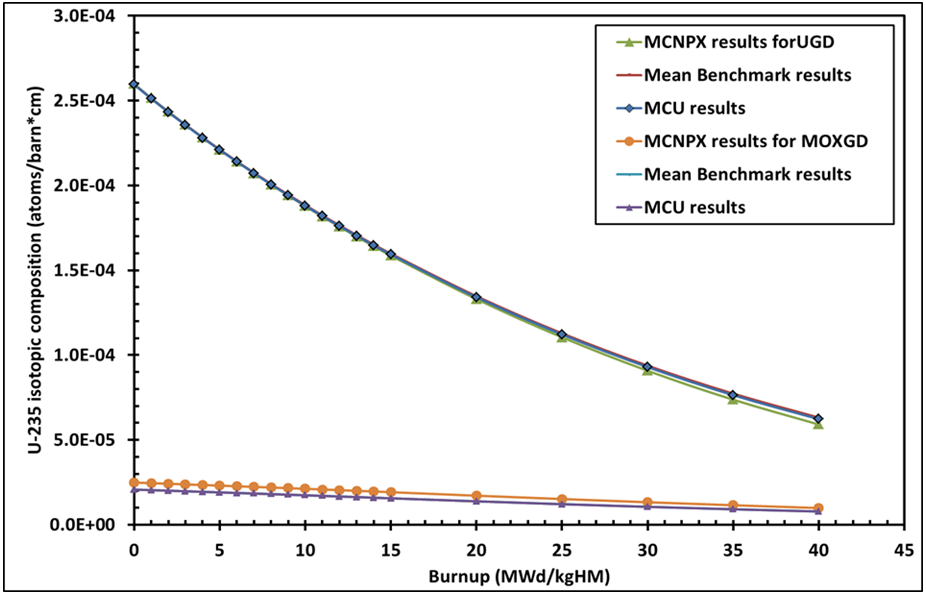 | Figure 5. Assembly average U-235 composition vs. burnup |
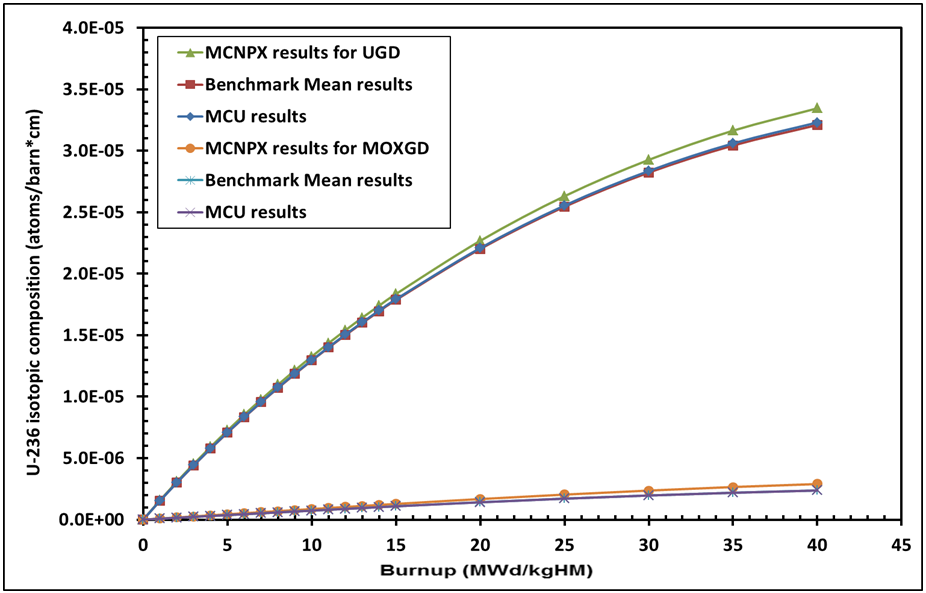 | Figure 6. Assembly average U-236 composition vs. burnup |
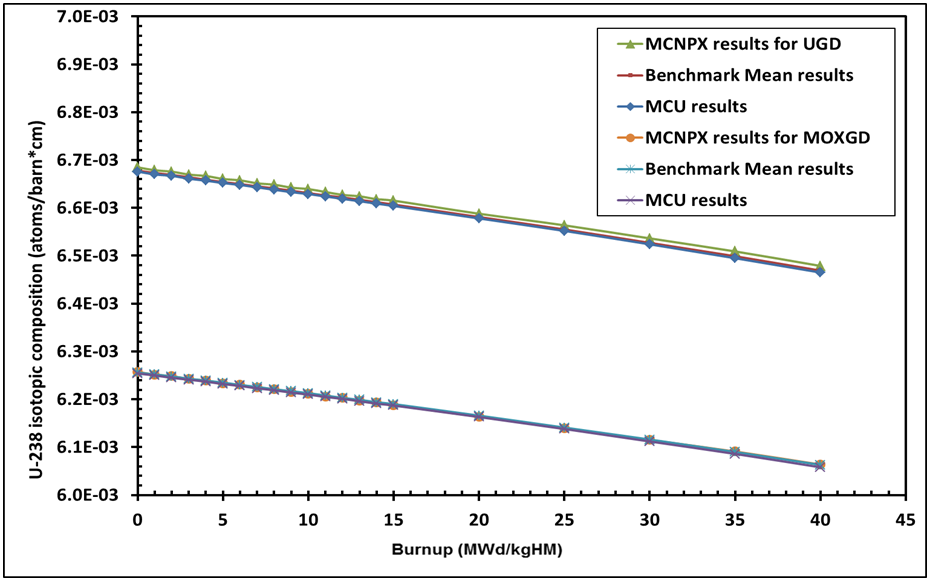 | Figure 7. Assembly average U-238 composition vs. burnup |
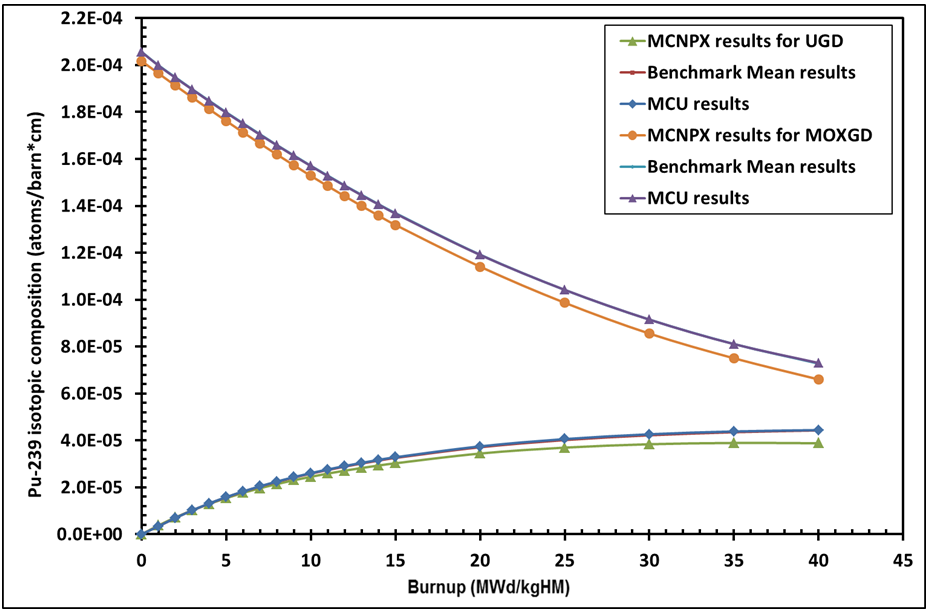 | Figure 8. Assembly average PU-239 composition vs. burnup |
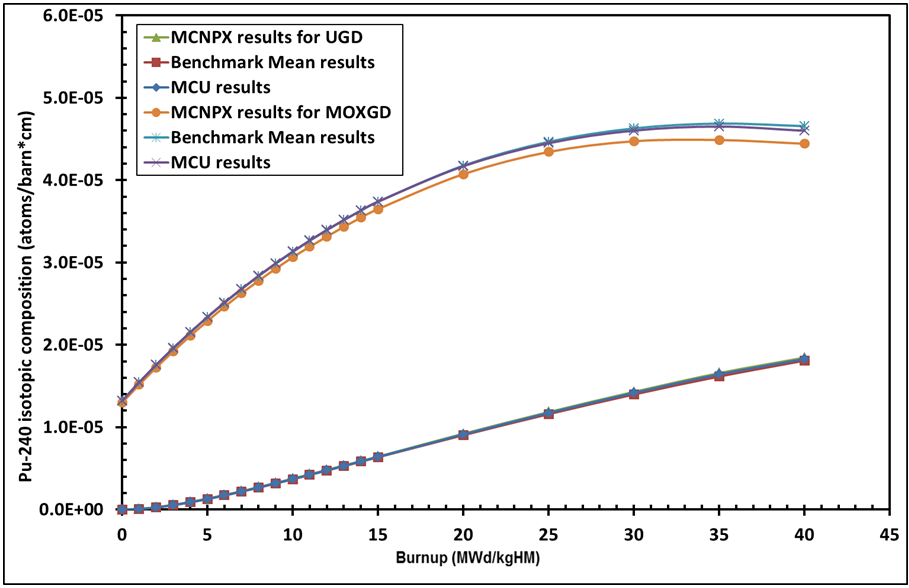 | Figure 9. Assembly average PU-240 composition vs. burnup |
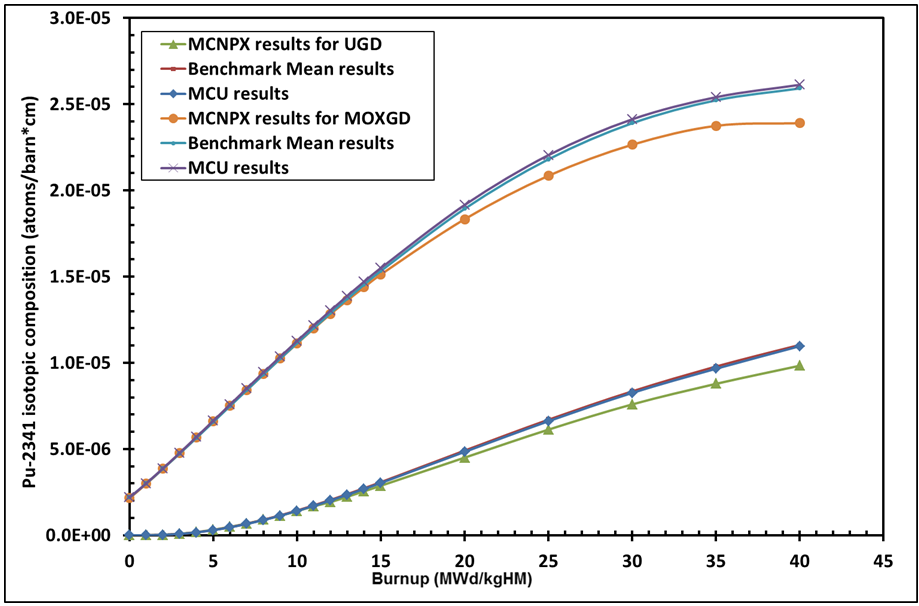 | Figure 10. Assembly average PU-241 composition vs. burnup |
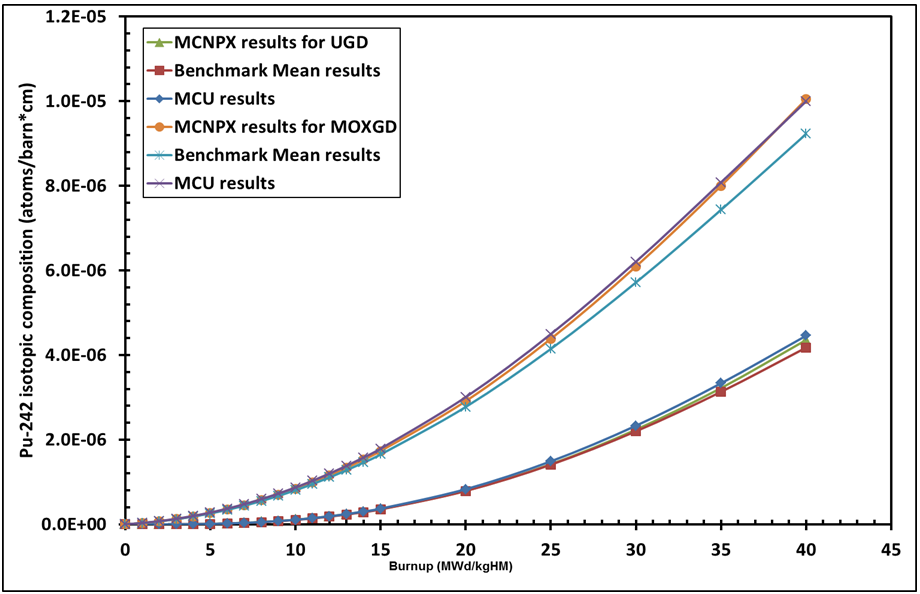 | Figure 11. Assembly average PU-242 composition vs. burnup |
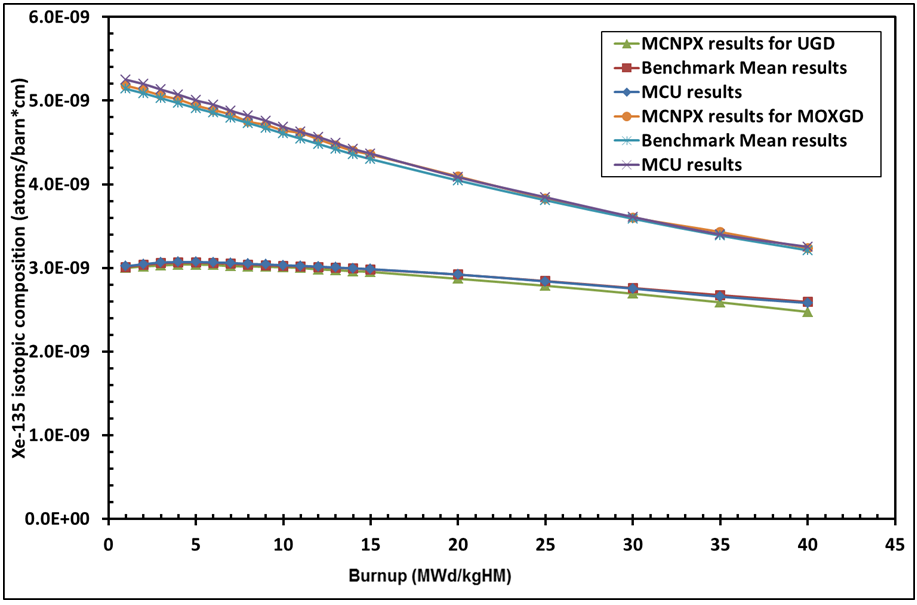 | Figure 12. Assembly average Xe-135 composition vs. burnup |
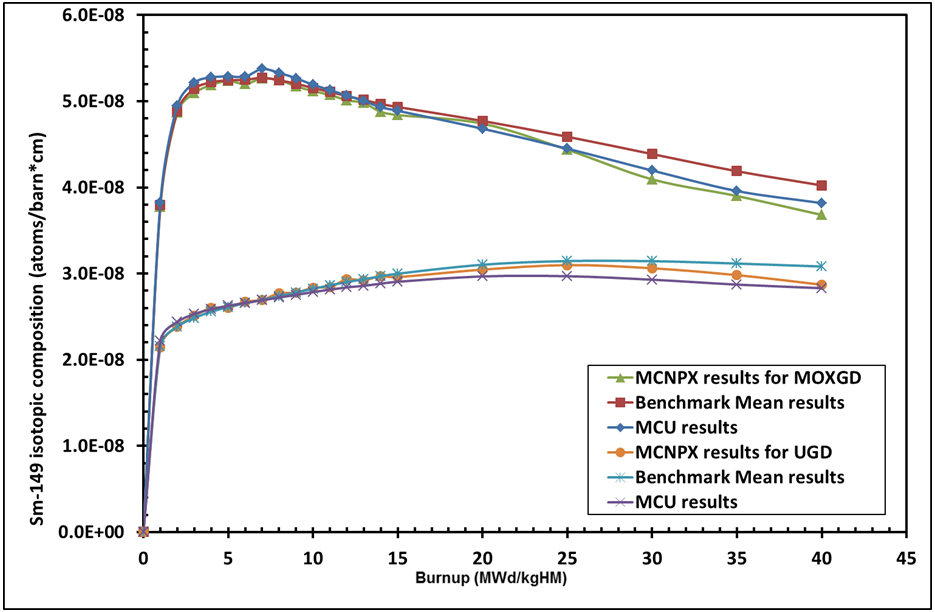 | Figure 13. Assembly average Sm-149 composition vs. burnup |
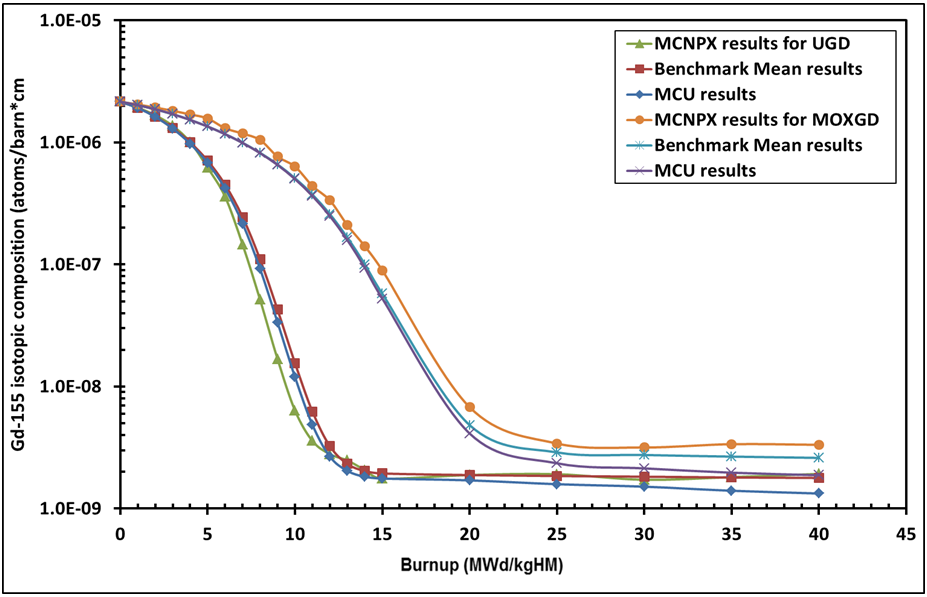 | Figure 14. Assembly average Gd-155 composition vs. burnup |
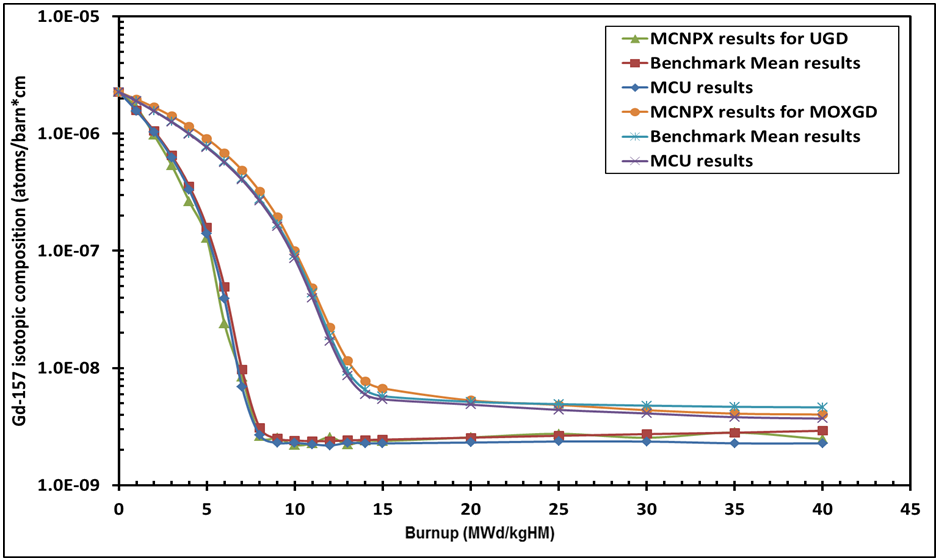 | Figure 15. Assembly average Gd-157 composition vs. burnup |
From figures 5-15 we can see that, at low burnup there is an excellent agreement with benchmark mean results and with MCU results for all isotopes in UGD and MOXGD assemblies. While at high burnup for some isotopes the discrepancies are somewhat increased but in most figures good agreement was observed. The depletion rate of 235U isotope for UGD assembly is larger than that for MOXGD assembly. The buildup rate of 236U isotope is very large in UGD assembly than in MOXGD assembly.For both UGD and MOXGD assemblies the 157Gd depletes more rapidly than 155Gd because the absorption cross section of 157Gd is higher than the absorption cross section of 155Gd. Also, both of the gadolinium isotopes 155Gd and 157Gd burn rapidly in UGD assembly than in MOXGD assembly.
3.3. k-inf Effects Results for States S1-S5
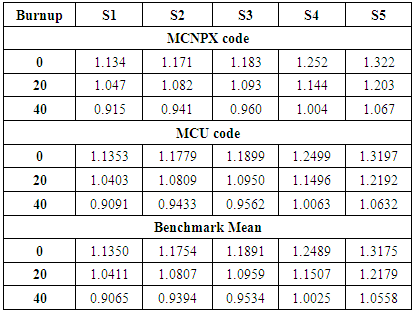
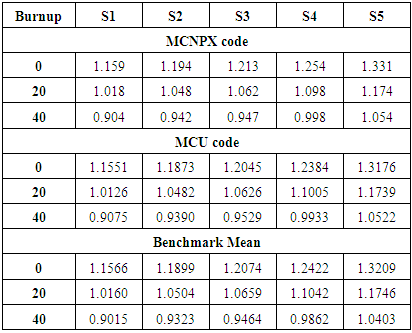
The burnup calculation has been performed at burnup points 0, 20, 40 MWd/kgHM for states S1-S5. The variations of kinf states (S1, S2, S3, S4, and S5) with respect to burnup (MWD/KgHM) for UGD and MOXGD assemblies are shown in tables 2 and 3 respectively.Table 2. UGD variant. kinf states S1- S5 with respect to burnup (MWD/KgHM)
 |
| |
|
Table 3. MOXGD variant .kinf states S1-S5 with respect to burnup (MWD/KgHM)
 |
| |
|
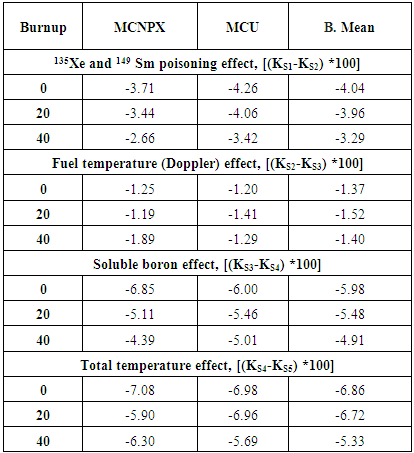
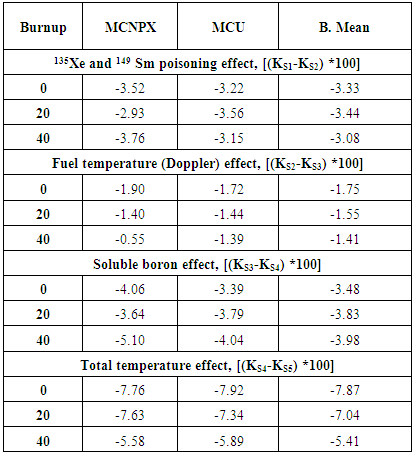
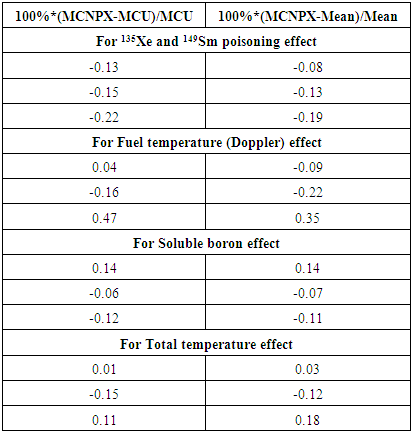
Several reactivity effects at burnup points 0, 20, 40 MWd/kgHM have been determined based on the kinf values corresponding to the reactor states as mentioned previously in calculation procedure section. The results of reactivity effects are compared with MCU result and benchmark mean results and presented in tables 4 and 5 for both UGD and MOXGD assemblies respectively. Also the MCNPX results deviations from benchmark mean results and from MCU code results are presented in tables 6 and 7.Table 4. UGD Variant. Reactivity effects, 100*(kinit-kfinal)
 |
| |
|
Table 5. MOXGD Variant. Reactivity effects, 100*(kinit-kfinal)
 |
| |
|
Table 6. UGD Variant. MCNPX Relative Deviation from MCU and Mean
 |
| |
|
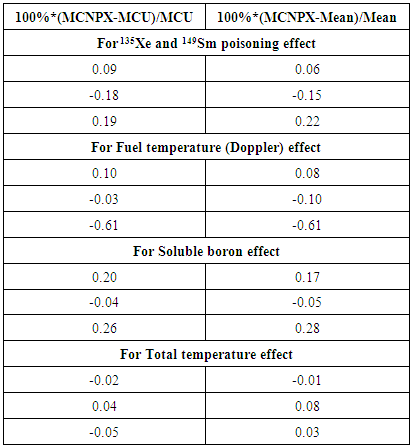
Table 7. MOXGD Variant. MCNPX Relative Deviation from MCU and Mean
 |
| |
|
From tables 2 and 3 we can see very good agreements for all MCNPX results with both of MCU code and Benchmark Mean results.From Tables 4 and 5 we can see that:- The reactivity effect of 135Xe and 149Sm on reactivity is less negative in MOXGD assembly than in UGD this because of the harder neutron spectrum in the MOXGD assembly. The calculated reactivity effect of xenon and samarium by MCNPX code are close to the benchmark mean value and with MCU code. - The reactivity effect of fuel temperature on reactivity (Doppler Effect) is more negative in MOXGD assembly than in UGD. The calculated reactivity effect of fuel temperature by MCNPX code is close to the benchmark mean value and with MCU code.- The reactivity effect of soluble boron on reactivity is less negative in MOXGD assembly than in UGD. The calculated reactivity effect of boron by MCNPX code is close to the benchmark mean value and with MCU code. - Total temperature effect on reactivity is more negative in MOXGD assembly than in UGD, this due to harder neutron spectrum in MOXGD assembly. The calculated reactivity effect of total temperature by MCNPX code is close to the benchmark mean value and with MCU code.From Tables 6 and 7 we can see that:- For The reactivity effect of 135Xe and 149Sm, the maximum absolute deviations from benchmark mean values and MCU code are 0.19 and 0.22 respectively for UGD assembly. While for MOXGD assembly the maximum absolute deviations from benchmark mean values and MCU code are 0.22 and 0.19 respectively.- For Doppler Effect the maximum absolute deviations from benchmark mean values and MCU code are 0.35 and 0.47 respectively for UGD assembly. While for MOXGD assembly the maximum absolute deviations from benchmark mean values and MCU code are 0.61 and 0.61 respectively.- For Soluble boron effect, the maximum absolute deviations from benchmark mean values and MCU code are 0.14 and 0.14 respectively for UGD assembly. While for MOXGD assembly the maximum absolute deviations from benchmark mean values and MCU code are 0.28 and 0.26 respectively.- For total temperature effect, the maximum absolute deviations from benchmark mean values and MCU code are 0.18 and 0.15 respectively for UGD assembly. While for MOXGD assembly the maximum absolute deviations from benchmark mean values and MCU code are 0.08 and 0.05 respectively.The results of comparison of the reactivity effects show very good agreement. Discrepancies for reactivity effects are approximately the same both for UGD and MOXGD variants and are somewhat increased at high burnup.
4. Conclusions
In the present paper the computational benchmarks of UGD and MOXGD variants fuel assemblies for VVER-1000 have been calculated by the Monte Carlo code (version MCNPX 2.7). The obtained results of the K-inf and the variation of fission products concentrations with respect to burnup and several reactivity effects were performed and have been compared with those of Monte carol results by MCU-REA code and with the benchmark mean results of other codes presented in the benchmark. The MCNPX results of the kinf values versus burnup show generally good agreement.Assembly average isotopic composition verse to burnup are calculated, at low burnup there is an excellent agreement with benchmark mean results and with MCU results for all isotopes in UGD and MOXGD assemblies. While at high burnup for some isotopes the discrepancies are somewhat increased but in most figures good agreement was observed.The results of comparison of the reactivity effects show very good agreement. Discrepancies for reactivity effects are approximately the same both for UGD and MOXGD variants and are somewhat increased at high burnup. In most cases very good agreement was observed. Slightly deviations was observed due to we used ENDEF-VII nuclear data library while the codes in the benchmark used other nuclear data libraries (ENDF/B-VI, JEF-2.2 and MCUDAT-2.1).
References
| [1] | NEA/NSC/DOC 10, 2002. A VVER-1000 LEU and MOX Assembly Computational Benchmark. Nuclear Energy Agency, Organisation for Economic Co-operation and Development. |
| [2] | MCNPX User's Manual. Version 2.7.0, Los Alamos National Laboratory, LA-CP-11-00438, - 2011. |
| [3] | M.B. Chadwick, et.al, ENDF/B-VII.1 Nuclear Data for Science and Technology: Cross Sections, Covariance, Fission Product Yields and Decay Data, 2011. |

 Abstract
 Reference
 Full-Text PDF
 Full-text HTML