-
Paper Information
- Paper Submission
-
Journal Information
- About This Journal
- Editorial Board
- Current Issue
- Archive
- Author Guidelines
- Contact Us
Journal of Nuclear and Particle Physics
p-ISSN: 2167-6895 e-ISSN: 2167-6909
2015; 5(6): 101-111
doi:10.5923/j.jnpp.20150506.02

Mossbauer Spectroscopy, Electrical Transport Properties and Gamma-Ray Attenuation Coefficients of Some Sodium-Iron-Phosphate Glasses Containing Bismuth
 Abstract
 Reference
 Full-Text PDF
 Full-text HTML
A. M. Abdel-Ghany1, T. Z. Amer2, A. A. Bendary3, A. G. Mostafa3
1Basic Science Dept., Faculty of Engineering Science, Sinai Univ., El-Arish, Egypt
2Phys. Dept., Faculty of Science, Al-Azhar Univ., (Girls Branch), Nasr City, Cairo, Egypt
3Mossbauer Lab., Phys. Dept., Faculty of Science, Al-Azhar Univ., Nasr City, Cairo, Egypt
Correspondence to: A. G. Mostafa, Mossbauer Lab., Phys. Dept., Faculty of Science, Al-Azhar Univ., Nasr City, Cairo, Egypt.
| Email: |  |
Copyright © 2015 Scientific & Academic Publishing. All Rights Reserved.
This work is licensed under the Creative Commons Attribution International License (CC BY).
http://creativecommons.org/licenses/by/4.0/

Some sodium iron phosphate glasses containing different amounts of bismuth have been prepared by the melt quenching method. The hyperfine structure of iron was characterized by Mossbauer effect (ME) spectroscopy. The density and molar volume were measured experimentally and were calculated empirically for comparison. Mossbauer spectroscopy showed the presence of two oxidation states of iron (Fe2+ and Fe3+) where all Fe2+ ions occupied the tetrahedral coordination, while Fe3+ ions appeared in both the tetrahedral and octahedral coordination states. The dc conductivity temperature dependence appeared to follow an Arrhenius type behavior while the frequency dependence ac conductivity follows a simple power law feature. The CBH model was found to be the most applicable conduction mechanism. It was found that, as Bi2O3 was gradually increased the gamma-ray mass attenuation coefficient increased while the HVL decreased, and the sample containing 10 mol% Bi2O3 can be used as good shielding material for low gamma-ray photon energies.
Keywords: Iron-bismuth-phosphate glasses, Mossbauer spectroscopy, Semi-conducting glasses, Electrical transport properties, Density & molar volume, Gamma-ray mass attenuation coefficient and Shielding glasses
Cite this paper: A. M. Abdel-Ghany, T. Z. Amer, A. A. Bendary, A. G. Mostafa, Mossbauer Spectroscopy, Electrical Transport Properties and Gamma-Ray Attenuation Coefficients of Some Sodium-Iron-Phosphate Glasses Containing Bismuth, Journal of Nuclear and Particle Physics, Vol. 5 No. 6, 2015, pp. 101-111. doi: 10.5923/j.jnpp.20150506.02.
Article Outline
1. Introduction
- Iron-sodium-phosphate glasses exhibit both electronic and ionic conductivities and have been studied extensively because of their low melting point and strong glass-forming character. Such glasses represent potential candidates for energy storage devices and solid state batteries as well as many applications in medical use [1-5]. It is known that Bi2O3 cannot form glass like other traditional glass formers, but it can form glass in the presence of any conventional glass former [6]. In such glasses, high polarizing Bi(III) ion can reduce its coordination number from six to three and thus glass network may consist of both BiO6 highly distorted octahedral and BiO3 pyramidal units [7]. It is known also that, the addition of iron and / or bismuth cations increases the aqueous durability of phosphate glasses through the formation of P–O–Fe and / or P–O–Bi bonds [8, 9]. The formation of such bonds affects directly different properties of phosphate glasses [10, 11]. Shaim and Et-Tabirou [12] have investigated the electrical transport properties of some alkali phosphate glasses containing Bi2O3. They concluded that, the electrical conductivity of such glasses depends on their composition and preparation technique [13, 14]. It is found that, when a network former oxide is substituted for another one, the conductivity of such mixed-former glasses exhibits different behaviors [15]. Most of the disordered materials show a dielectric relaxation that does not described by an exponential (Debye-like) decay with a characteristic single decay time [16]. On the other hand, iron-phosphate glasses containing Bi2O3 have drawn much attention due to their high gamma-ray attenuation coefficient, which reflects the possibility to act as good shielding material as well as for nuclear waste encapsulation [17]. However, Saudi et al have studied the gamma-ray attenuation coefficient and half value layer (HVL) of some glasses containing Bi2O3 and CdO, where they found that the formation of some P-O-Bi bonds cause a relative increase in the density of these glasses as well as their mass attenuation coefficient [18]. Mostafa et al, have studied the gamma-ray attenuation coefficient of some silicate glasses containing Bi2O3, where the used silica was extracted from rice husk ash. They found that the glass sample containing 20 mol% Bi2O3 is suitable for attenuating low gamma-ray photon energies while that contains 5 mol% Bi2O3 exhibits the highest neutron removal cross- section [19]. However, in this article, the hyperfine structure of some iron-sodium-phosphate glasses containing different amounts of bismuth oxide will be thoroughly investigated, applying Mossbauer spectroscopy. Then, the electrical transport properties as well as the gamma-ray mass attenuation coefficients and the HVL, will be also studied.
2. Experimental
- Iron-sodium-phosphate glasses doped with bismuth having the composition, 20 mol% Fe3O4. 20 mol% Na2O. (60-x) mol% P2O5. (x) mol% Bi2O3,[where 0 ≤ x ≤ 10 in steps of 2.5]have been prepared using pure Fe3O4, B2O3, Na2CO3 and (NH4) H2PO4 as starting materials. The batches were mixed well and melted in porcelain crucibles in an electrically heated muffle furnace at 1100°C for 2 h with frequent stirring to ensure complete homogeneity. Melts were then rapidly quenched onto a pre-cooled stainless steel molds in air.Mossbauer spectra were obtained using a constant acceleration Mössbauer effect spectrometer and the Mossbauer parameters were calculated relative to metallic iron calibration spectrum. For electrical conductivity measurements, the obtained solid glasses were polished to obtain disk shape samples of 1 mm thickness and 7 mm diameter with optically flat surfaces coated with silver paste. Each sample was then placed in a cell between two copper disks and the temperature of the sample was measured using a chromel–alumel thermocouple. All measurements were carried out in the temperature range from 300 to 525 K at four fixed frequencies [0.12, 1, 10 and 100 kHz], using RLC bridge (model SR–270). Density measurements were carried out by the liquid displacement method in toluene as an emersion liquid at room temperature using an electric balance of 10−4 g sensitivity. The molar volume values were then calculated from the obtained density results. The gamma-ray mass attenuation coefficients of the studied glasses have been calculated using WIN-X-COM program based on the mixture rule, and the HVL values were then calculated from the obtained results.
3. Results and Discussion
3.1. Mossbauer Spectroscopic Analysis
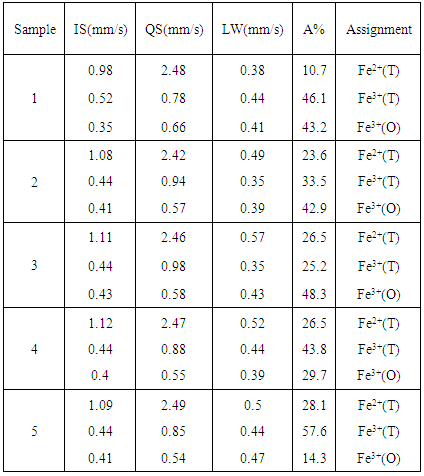
- All the obtained Mossbauer spectra appeared to be generally similar, and Figure (1) represents the obtained Mossbauer spectra of the glass samples containing 0 and 10 mol% Bi2O3. The computer analysis and fitting indicated that three separated paramagnetic doublets are presented in each spectrum, and the calculated parameters are exhibited in Table (1). Inspecting these parameters, it can be seen that the line width (LW) values of phase (I) appeared to fluctuate between 0.57 and 0.38 mm/s, while that of phase (II) appeared to fluctuate between 0.44 and 0.35 mm/s and that of phase (III) appeared to fluctuate between 0.39 and 0.51 mm/s. That is, all LW values appeared to be highly broadened which reflect the amorphous and glassy state nature of the studied samples.
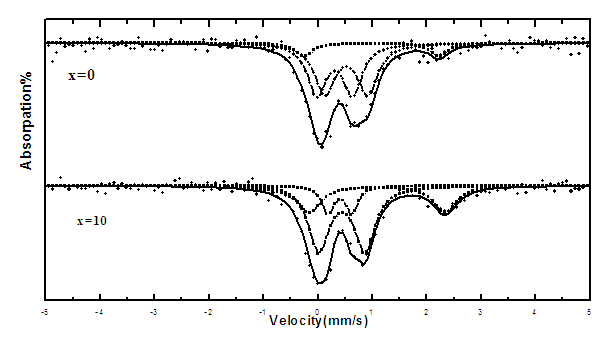 | Figure (1). The obtained Mossbauer spectra of the samples containing 0 and 10 mol% Bi2O3, as representative spectra |
|
3.2. Electrical Transport Properties
- In this section the dielectric properties as well as the dc and ac electrical conductivities of the studied glasses were thoroughly investigated.
3.2.1. Dielectric Properties
- The temperature dependence of the dielectric constant (ε′) of the sample containing 7.5 mol% Bi2O3 can be shown in Figure (2), at four different frequencies (0.12, 1, 10 and 100 kHz) and generally, all samples show similar behavior. From this figure, it can be noticed that at low temperature (below 430 K) the dielectric constant appeared to be temperature independent, while at high temperature (above 430 K), it increases gradually as the temperature was increased such that the rate of increase is inversely proportional to the frequency. This behavior can be attributed to the fact that the orientational polarization is related to the thermal motion (vibration) of the molecules [24] and/or to the space charge polarization due to the bonding defects in the network structure [25].
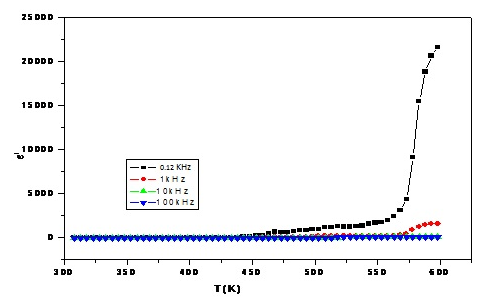 | Figure (2). The dielectric constant (ε′) temperature dependence at four different frequencies for the sample containing 7.5 mol% Bi2O3, as representative curve |
3.2.2. Pseudo Cole-Cole Diagram
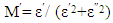
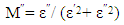
- Pseudo Cole-Cole diagram had been suggested, instead of the conventional Cole–Cole plot between ε″ (ω) and ε′ (ω), at fixed temperature [26], such that ε″ (T) and ε′ (T) can be plotted at a fixed frequency. In the present work, pseudo Cole-Cole diagram was obtained by plotting the imaginary part of the electric modulus (M″ (T)) against its real part (M′ (T)) at constant frequency, where M1 and M2 are calculated from equations (1) and (2) respectively.
 | (1) |
 | (2) |
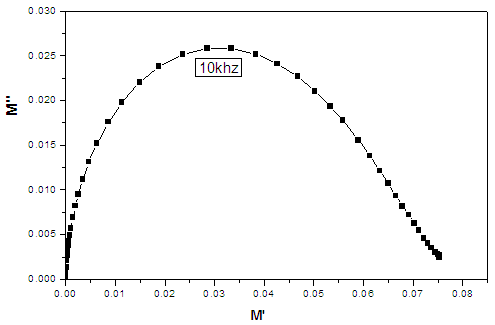 | Figure (3). Pseudo Cole-Cole diagram at 100 KHz for the sample containing 7.5 mol% Bi2O3, as representative curve |
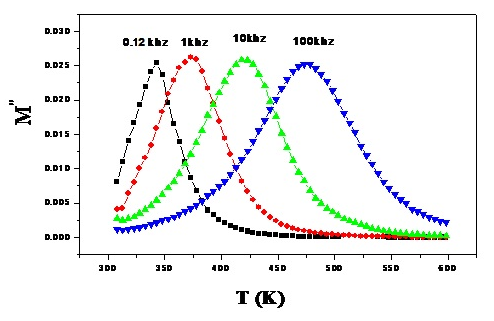 | Figure (4). The variation of M″ with temperature at four different frequencies for the sample containing 7.5 mol% Bi2O3, as representative curve |
3.2.3. D.C. Conductivity Calculation
- The dc conductivity has been obtained from the extrapolation of the frequency independent plateau region of the (ln σt verses ln ω) plot according to equation (3),
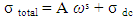 | (3) |
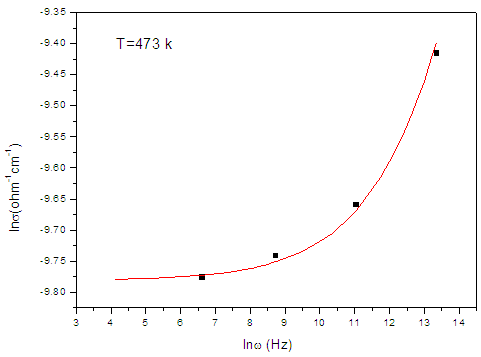 | Figure (5). The frequency dependent conductivity of the sample containing 7.5 mol% Bi2O3, as representative curve |
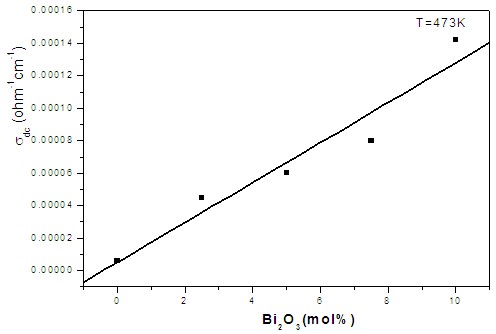 | Figure (6). The dc conductivity as a function of Bi2O3 content at a fixed temperature (473 K) |
3.2.4. A.C. Conductivity
- The ac conductivity of all amorphous materials and glasses follows the universal power law of the form (equation (4)),
 | (4) |
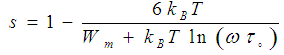 | (5) |
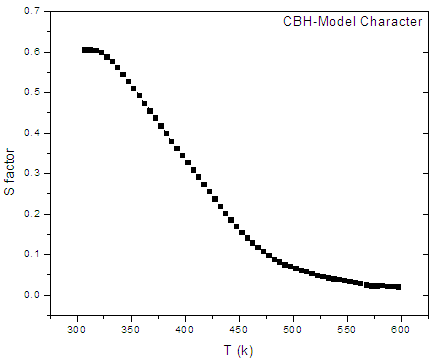 | Figure (7). The variation of the s-factor with temperature for the sample containing 7.5 mol% Bi2O3, as representative curve |
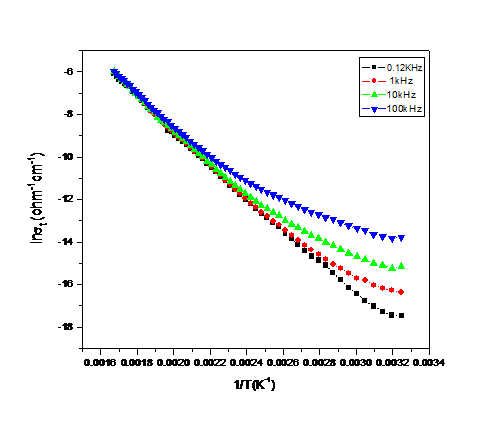 | Figure (8). The variation of ln σt verses the reciprocal of temperature at four different frequencies for the sample containing 7.5 mol% Bi2O3, as representative curve |
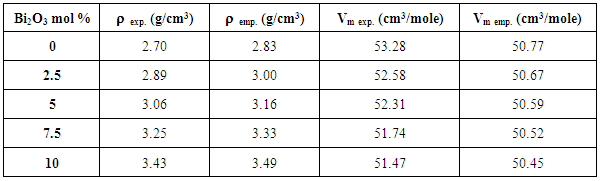
3.3. Density and Molar Volume
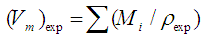
- The experimental density values (ρexp) were measured applying Archimedes method, using toluene as an emersion liquid, applying equation (6),
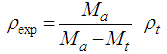 | (6) |
 | (7) |
 | (8) |
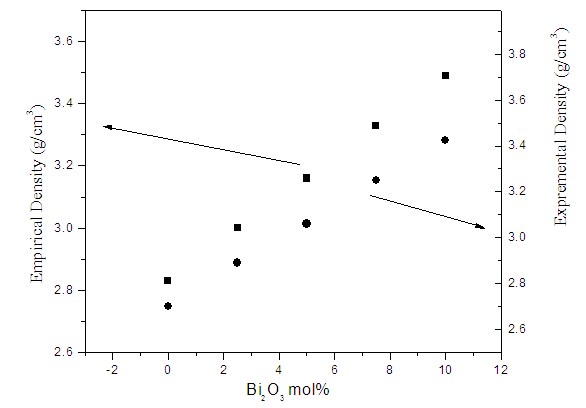 | Figure (9). The variation of the experimental and empirical densities as a function of Bi2O3 content |
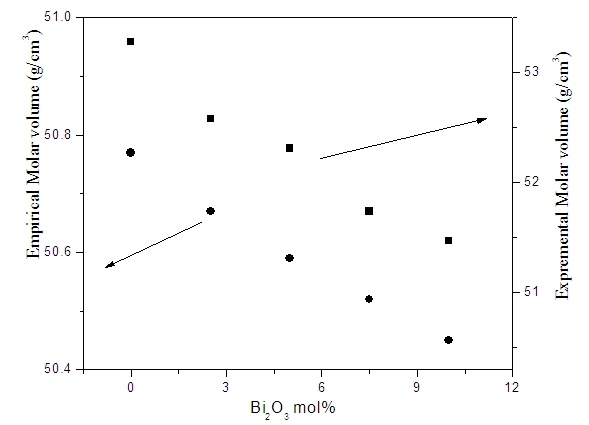 | Figure (10). The variation of the experimental and empirical molar volume values as a function of Bi2O3 content |
|
3.4. The Gamma-ray Attenuation Coefficients
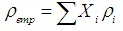
- The gamma-ray mass attenuation coefficients (µ/ρ)m have been calculated using Win X-COM program (based on the mixture rule) at energies equal to 356 KeV (that of 135Ba), 662 & 1173 KeV (those of 60Co) and 1332 KeV (that of 137Cs) as low energy γ-ray, using equation (9) [31],
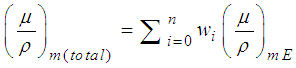 | (9) |
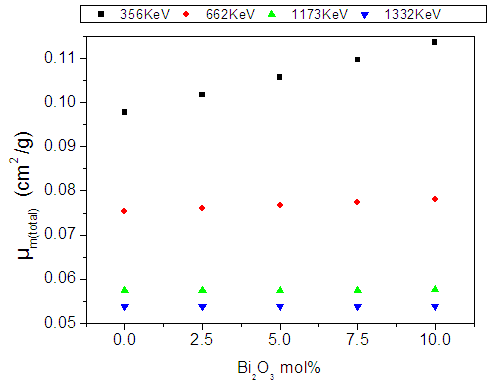 | Figure (11). The mass attenuation coefficient of the studied glasses versus Bi2O3 content for different low gamma–ray energies |
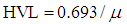 | (10) |
 | Figure (12). The HVL values of the studied glasses versus Bi2O3 content for different low gamma–ray energies |
4. Conclusions
- According to the obtained results and the supposed discussion, it can be concluded that all the investigated glasses appeared in good homogenous glassy phase. All Fe2+ ions occupy the tetrahedral coordination symmetry, but some Fe3+ occupy the tetrahedral coordination while the rest occupy the octahedral coordination state. In addition, the introduced Bi cations occupy the GNM positions and hence forced the Fe cations that occupy the octahedral coordination, acting as GNM to transfer to the tetrahedral symmetry to act as GNF. The increase in the electrical conductivity depends strongly on the introduced Bi3+ cations, since they act to open the glass structure and to increase the amount of Fe2+ at the expense of Fe3+, which in turn act to ease the mobility of Na+ cations and to increase the electron hopping in the glass networks. The CBH model is the predominant conduction mechanism. The change in the dielectric constant with the temperature does not show any peak, indicating that there is no change in the ferroelectric behavior of these glasses in the applied temperature range. The calculated electric modulus showed a relaxation peak shifted to the higher temperatures as the frequency was increased. Pseudo Cole-Cole diagram for all samples showed only one semicircle arc indicting a single relaxation process. Also the introduced Bi2O3 act to increase the density and to decrease the molar volume values.It can be concluded also, from the study of (µ/ρ)m, that as Bi2O3 was gradually increased the gamma-ray mass attenuation coefficient increased while the HVL decreased, and the sample containing 10 mol% Bi2O3 can be used as good shielding material for low gamma-ray and x-ray photon energies.