-
Paper Information
- Next Paper
- Paper Submission
-
Journal Information
- About This Journal
- Editorial Board
- Current Issue
- Archive
- Author Guidelines
- Contact Us
Journal of Nuclear and Particle Physics
p-ISSN: 2167-6895 e-ISSN: 2167-6909
2015; 5(4): 75-78
doi:10.5923/j.jnpp.20150504.01
Design and Deployment of a Portable Platform for Remote Urban Pollution Monitoring
 Abstract
 Reference
 Full-Text PDF
 Full-text HTML
A. Jahangiri , F. Faghiri , H. Akhavan , M. Ghoranneviss , A. Salar Elahi
Plasma Physics Research Center, Science and Research Branch, Islamic Azad University, Tehran, Iran
Correspondence to: A. Salar Elahi , Plasma Physics Research Center, Science and Research Branch, Islamic Azad University, Tehran, Iran.
| Email: |  |
Copyright © 2015 Scientific & Academic Publishing. All Rights Reserved.
A low cost portable air-monitoring system is designed and deployed to allow the use of novel gas sensing technologies. It connects to an Android device and presents gas sensing factors in real time. This will lead us a step forward towards a mesh-based cloud for measuring pollution in urban and industrial environments.
Keywords: Remote Urban Pollution
Cite this paper: A. Jahangiri , F. Faghiri , H. Akhavan , M. Ghoranneviss , A. Salar Elahi , Design and Deployment of a Portable Platform for Remote Urban Pollution Monitoring, Journal of Nuclear and Particle Physics, Vol. 5 No. 4, 2015, pp. 75-78. doi: 10.5923/j.jnpp.20150504.01.
Article Outline
1. Introduction
- In today’s society, transport and heating are the main contributors to air pollution in urban environments [1]. Taken for granted, the air we breathe is one of the most critical – and also at risk – resources of an urban environment [2]. The negative impacts of pollution include an elevated risk for cardiovascular complications, which is particularly a problem for the elderly and young [3] [4]. Governments and private sectors all over the world have taken drastic measures to reduce emissions and curb pollutions in the air we breathe. Yet without a thorough and practical assessment, the effectiveness of these methods remains questionable. It is in light of this that they are relying on quantitative data to help them combat this situation [5] [6]. One of the common tools in their arsenal is weather stations. Recent advances in microelectronics and gas sensing technology has opened up the scene for low-cost portable air pollution stations, capable of measuring air pollution factors in real time. Even though many low-cost calibration protocols have been introduced, they generally require the use of time and CPU extensive resources such as Principle Component Analysis which must be performed independently for each unit [7]. The main challenge facing the widespread use of new technologies is the void of a practical interface. PZT, carbon nanotube and conjugated polymers are some of the technologies that have made breakthroughs in gas sensing technology. Compared to electrochemical sensors, they do not require a heating element, which reduces the power consumption greatly and their durability makes them more suitable for adverse environments. Here we present a low cost portable air monitoring system. This system can be connected to an Android device. Hence potentially accessible to a majority of population, it presents air pollution factors in real time.
2. Design, Implementation, and Scientific Background
- The portable gas sensor consists of three modules namely, MOS (metal oxide semiconductor) gas sensors, digital sensors (pressure and temperature) and microcontroller unit. Communication is achieved via a Bluetooth module.The gas levels are sensed by the MQ-2, MQ-5 and MQ-135 sensors (smoke, LPG and air quality respectively) and is sent to the microcontroller shown in figure 1a. The sensed analog values are then converted to digital data for further processing via the internal ADC in the ATMEGA328 [8]. Together with digital data from the BMP180 pressure sensor and DS18B20 temperature sensor, they are sent via the HC-05 Bluetooth module to the Android device. The communication is achieved through the UART protocol. The Android device performs data parsing on this data which then displays it visually to the user. The block diagram of the proposed system is shown in Figure 1a.
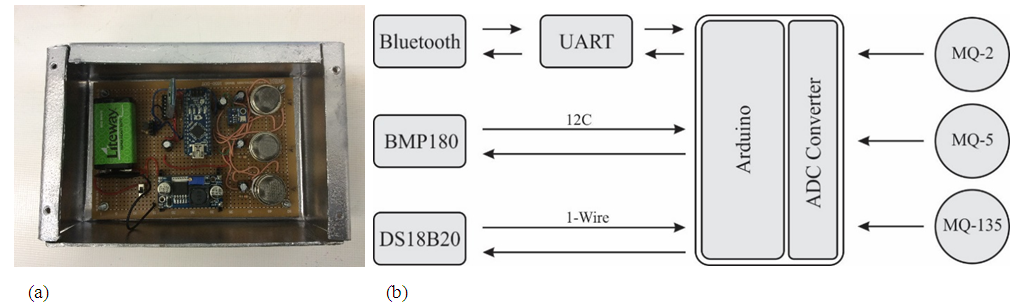 | Figure 1. (a) Picture and (b) Schematic of Gas Sensor Board |
2.1. MOS Gas Sensors
- The MQ-2 [9], MQ-5 [10] and MQ-135 [11] gas sensors use the Metal Oxide Semiconductor (MOS) technology for detecting various gases. The gas sensitive film containing tin oxide
 changes the resistance when subject to pollutants [12]. These economical sensors are produced on a large scale and are in a common place in industrial applications. Table 1 lists the detection range and sensitivity of each MQ sensor.
|
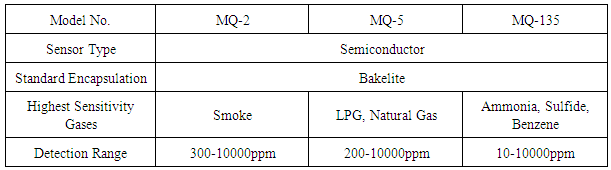
 element to various gases. Prior to application in circuit, each senor was preheated for at least 24 hours. This one-off errand is necessary to achieve stable readings. Otherwise, the MOS sensor achieves stable readings after 5 minutes.
2.2. Digital Sensors
- Two digital sensors provide additional environmental data:a) Pressure SensorThe BMP180 is a pressure sensor module IC, designed for measuring barometric pressure. Specifically, a MEMS (Microelectromechanical system) device. It consists of a piezo-resistive sensor (see figure 2a), an A2D converter and a control unit with EEPROM. Communication is achieved through a serial I2C interface. The calibration data for each unit is saved into the EEPROM at the factory.The BMP180 is shielded from light to ensure accurate measurements. It also performs temperature measurement on the side, but only has an accuracy of
 . The operating voltage and logic of the BMP180 IC itself is 3.3V. The 3.3V LDO (low-dropout) regulator can source current from either the 5V regulator on the Arduino Nano or 3.3V from the FTDI chip. Note that the FTDI chip can only supply a maximum of 50mA, but this is not a problem for the BMP180 since it has a low power consumption (5microamps in standard mode, 0.1microAmps in standby). Even though the microcontroller runs at 5V, it is safe to connect the BMP180’s SDA and SDL pins to the Atmega328’s I2C port, thanks to the onboard pullup (4.7k) resistors [14]. The BMP180 IC also provides SPI (Serial Peripheral Interface) connectivity via pins 1, 4 and 6 – CSB, SDO and SDI. The SDA pin acts as the SPI input (SDI) when communication is assigned to the SPI protocol. SPI communication is generally faster. However, communication between 5V and 3.3V devices via the SPI protocol is not possible without additional hardware. Figure 2b shows the circuit for the BMP180.b) Temperature SensorThe internal temperature sensor of the BMP180 is adequate for temperature compensation. Yet the DS18B20 digital temperature sensor [15] gives us vital access to temperature data with an even greater precisionless than 0.5°C. While the DS18B20 is capable of operation in both parasitic and normal operation modes, we choose normal operation for increased stability.
 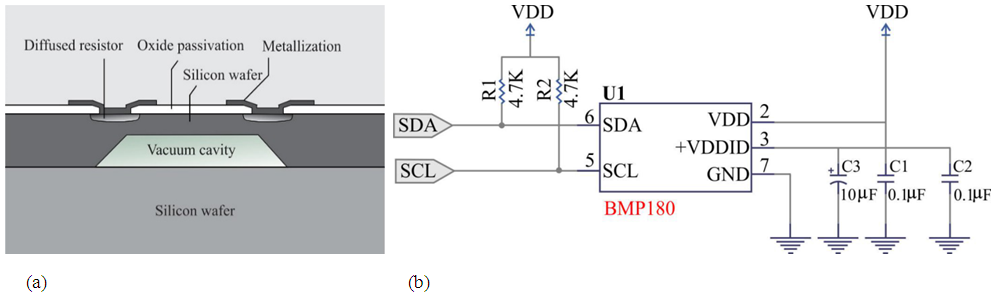 | Figure 2. (a) Side view of MEMS pressure unit altered from [13] and (b) schematic diagram for the BMP180 module |
2.3. Communication
- A high-level UML diagram is shown in Figure 3a. The data from the sensors (gas, pressure and temperature) are aggregated and stored as a single string. A hash (#) sign is used to signal the start and a tide (~) is used to signal the end of string to the Android device. Data is transmitted over the serial UART protocol. The data transmission rate of the HC-05 Bluetooth module was altered using from the default 9600bps to a much higher 384000bps via AT commands. This speed strikes a balance between speed and reliability. To further ensure data reliability, parity bit was enabled.Two activities namely Main Activity and Bluetooth make up the Android application. The Bluetooth activity handles the pairing and initiates the communication between the HC-05 module and the Android hardware. Upon connecting, a SPP (Serial Port Profile) is initiated which facilitates a serial connection between the Arduino and the Android device. Effectively, it acts as a pass through for the UART connection (see figure 3b). The Android programming was performed in Android Studio.
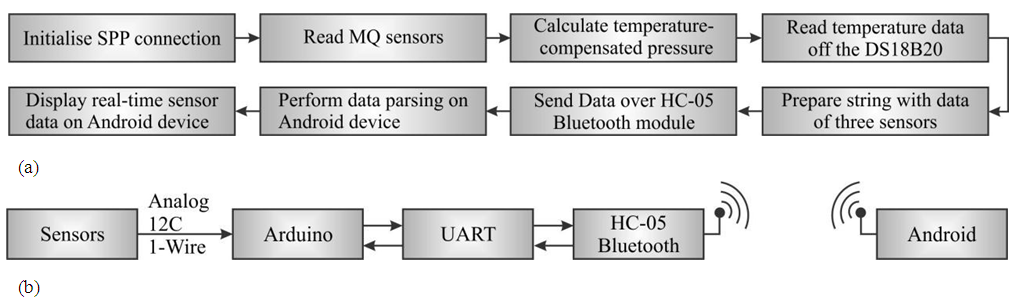 | Figure 3. (a) UML Diagram and (b) communication between Android and sensors |
3. Results and Discussion
- The proposed design was utilized to measure LPG, Ammonia and Smoke. To evaluate the effectiveness in sensing various gases, we evaluate the responses of the various MQ sensors to Butane. After allowing for the initial values to become stable, a lighter – with the flame off – was placed in close proximity to each MQ sensor in turn. The results were recorded to a CSV file via the Gobetwino software and saved for further analysis.Even though figures 4a-c show different sensors subject to the same condition, they all have different responses. The MQ-5 shows a clear and fast response, while the MQ-2 shows only a subtle increase. The MQ-135, identified as a general air quality sensor, only shows a minute increase in voltage. It should be noted that the load resistor
 on each sensor was set to
  . The recovery rate is important for real-time data collection. Figure 4c shows the response of the MQ-2 when subject to butane several times. The recovery rate is less than 10 seconds for the value of the sensor to return to within 10% of its initial value.
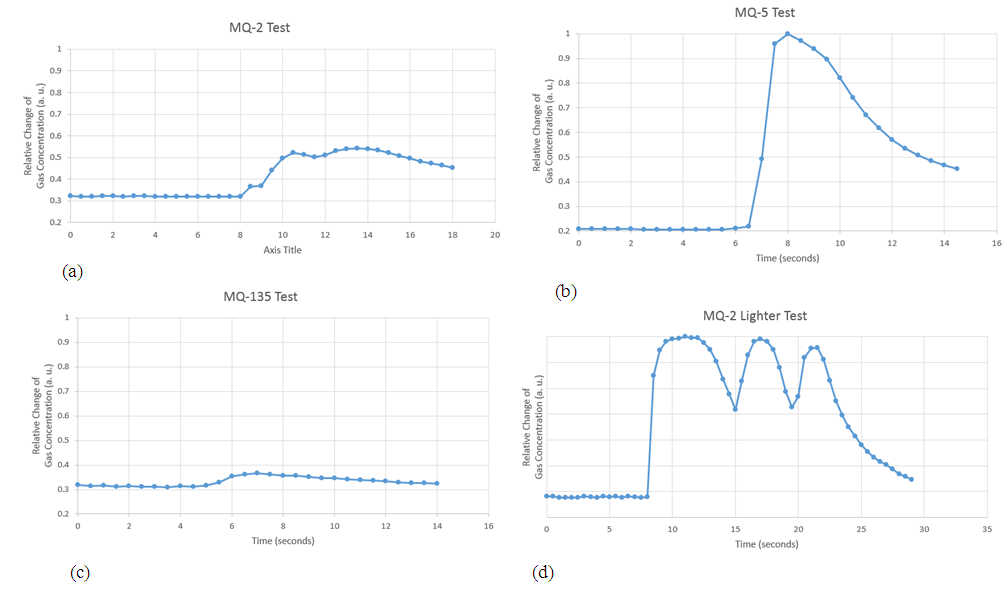 | Figure 4. Reading-Time graph for the (a) MQ-2 (b) MQ-5 and (c) MQ-135 in response to Butane. (d) shows the response of the MQ-2 sensor when it is subject to butane several times |
4. Conclusions
- A practical solution to wide scale pollution monitoring using an IoT (Internet of Things) enabled platform is presented. The approach will facilitate the widespread adoption of the MQ range for economical and effective municipal and industrial pollution monitoring. We believe that this work will also pave the way for the use of novel sensing technologies such as PZT, carbon nanotubes and conjugated polymers in consumer products. Further citywide studies are underway at various locations in Tehran. Use of this platform for gas analysis and monitoring for Waste Plasma Gasificationat the Plasma Physics Research Center is under evaluation.