W. I. Zidan
Nuclear and Radiological Regulatory Authority, Nuclear Safeguards and Physical Protection Department, Cairo, Egypt
Correspondence to: W. I. Zidan, Nuclear and Radiological Regulatory Authority, Nuclear Safeguards and Physical Protection Department, Cairo, Egypt.
| Email: |  |
Copyright © 2015 Scientific & Academic Publishing. All Rights Reserved.
Abstract
Mathematical modeling of radiation detectors using Monte Carlo (MC) method is an important tool in radiation spectroscopy. Its importance arises from the fact that the calibration process of radiation detector is independent of radioactive standard sources. However, employing such a tool necessitates the availability of some detailed and precise information, not only about the used detector, but about the measured material and experimental setup configuration as well. In many cases, the required information is obtained from the manufacturers, the certificates or via certain measurements. The accuracy of the constructed MC model depends strongly on how far this information is precise. In this work a mathematical model for a HPGe detector has been designed and refined. All factors and parameters affecting the model accuracy have been investigated. A method for model refinement is suggested and validated. The method is applied for verifying the mass content of some Nuclear Material (NM) samples with an accuracy of about 1%.
Keywords:
HPGe detectors, Mathematical modeling, MCNP, Dead layer, Hole depth
Cite this paper: W. I. Zidan, Refining of a Mathematical Model for a HPGe Detector, Journal of Nuclear and Particle Physics, Vol. 5 No. 2, 2015, pp. 30-37. doi: 10.5923/j.jnpp.20150502.02.
1. Introduction
Measurements on radioactive materials are performed through three methods, namely, relative, absolute and semi-absolute ones. Although the most accurate results are usually obtained using relative methods, the absence of radioactive material standards represents the main problem in this regard. Whenever radioactive standards are not available or having different characteristics than the assayed materials, absolute or semi-absolute methods are considered. In this case, factors and parameters which affecting the measurements have to be determined. The type and the number of factors and parameters required for assaying the radioactive material depend mainly on the aim of the activity. If the aim is to characterize the material under investigation, all factors affecting the assayed material have to be determined. On the other hand, if the aim is to verify the material (i.e., to investigate the correctness of acertain provided information), only the data related to detector design and experimental setup configuration must be determined. In both cases, the detailed characteristics of the detector is the most important and difficult information to be obtained. Usually, information about detector design is obtained from the manufacturer. However, such information is not usually sufficient enough to allow accurate modeling. Consequently, and before start modeling, efforts should be spent for accurate detector characterization. Simulation of gamma ray radiation detectors using MC Calculations has been started many years ago [1-3]. It has been considered by many authors taking into account different factors and difficulties affecting the simulation process. This includes, for example, detector simulation for generating calibration equation [4], compute efficiency and coincidence summing corrections [5], calculations at different energy ranges [6, 7], detector types [8, 9], geometry factors [10] and other applications [11-12]. Among all factors and difficulties, the inactive part of the detector (detector dead layer) was the most important and effective one [13-15]. The current work aims to investigate the effect of uncertainties in the detector dimensions component provided by the manufacturer on the created mathematical model. An approach to optimize detector dimensions is proposed.
2. Methodology
Designing of a mathematical model for a radiation detector with an acceptable accuracy is a main target for many of gamma ray spectrometer’s users. The approach for achieving such target is important, since many factors should be included while reaching the optimized model. Optimization of detector model to give accurate values for the efficiency at specific gamma ray energy may interrupt the detector response at other energies. This effect could be clarified while dealing with the dead layer thickness of the detector since the attenuation effects are larger for smaller gamma rays energies. Other factors such as source-to-detector (S-D) distance may not have the same effect (especially at relatively large S-D values), since the effect of such factor does not depend on the energy of the measured radiation but rather on the geometrical setup. Therefore, the approach for constructing the optimized model is to investigate the main and most effective parameters and construct the model with minimal variations for the data provided by the manufacturer.Basically the mass of a specific isotope in a certain radioactive sample measured by a detector could be estimated as follows: | (1) |
where: mass of the assayed isotope “i” [g];
 count rate of the detector of a certain gamma ray due to isotope “i” [s-1];
 fraction of the specific gamma ray absorbed in the active detectormaterial estimated using MC calculations;
 physical constant for the specific gamma energy (specific activity of the assayed isotope and the branching ratio of the gamma ray) [g.s-1].Although the equation shows that the mass is simply estimated if the count rate is measured and the factor “F” is calculated, efforts should be concentrated on generating accurate “F” values.Estimation of “F” using MC calculations includes all factors affecting the measurements. This will include gamma rays attenuation due to all media through which radiation transport, geometry factors (setup configuration), and detector efficiency. The detector characteristics which are provided by the manufacturer include: the material, geometry and dimensions of the detector and its components (detector housing, detector holder, end cap-to-detector distance, dead layer .. etc). Usually, such details in addition to other detector components are not precisely provided by the manufacturer. Hence, the generated simulation model might not represent the typical detector although it gives accurate results for specific adapted cases. In addition, some provided information may change with time (e.g. thickness of the dead layer) which necessitates re-characterization of the detector [13].Each of the detector components must be investigated separately. Then the most effective ones are selected to optimize the detector model. Studying the effect of each part of the detector is performed via slightly changing its dimensions and recognizing its effect on the “F” factor. In order to avoid uncertainties due to other factors than the detector design a set of standard NM samples was used to perform some experimental measurements. The obtained results were used for optimizing the detector model.
3. Experimental Work and Calculations
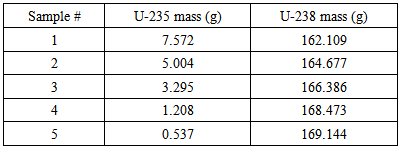
A set of certified NM standards, with cylindrical shapes, was used to optimize the mathematical model of the HPGe detector. The specifications and characteristics of the NM samples are given in Table (1). The samples contain different quantities and ratios of U-235 and U-238 isotopes. The mass content of these isotopes were estimated using Eqn. (1), where the count rates of the 185.7 and 1001.03 keV gamma lines due to the U-235 and U-238 isotopes, respectively, are measured using the HPGe detector. While the fractions “F” were calculated using the general MC Code (MCNP5). The used HPGe is a Microspec ORTEC with a relative efficiency of 40%.Table (1). Specifications of the certified NM standards
 |
| |
|
The NM samples were located where the axis of symmetry of each sample is collinear with that of the detector. The samples were measured at different S-D distances and with different measuring life times in order to minimize electronic losses (dead time less than 0.1%) and to keep statistical errors always minimum (less than 0.1%). MC calculations were performed using the general MC code (MCNP5) to calculate the fraction “F” in Eqn. (1). The MCNP input files were created using the NM samples certificates while the data provided by the manufacturer (Fig. (1)) were first used for creating the detector model. The fraction “F” was calculated using the pulse height tally card “F8” with suitable parameters for cone source biasing variance reduction technique depending on the S-D distance value. 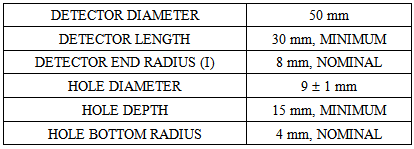
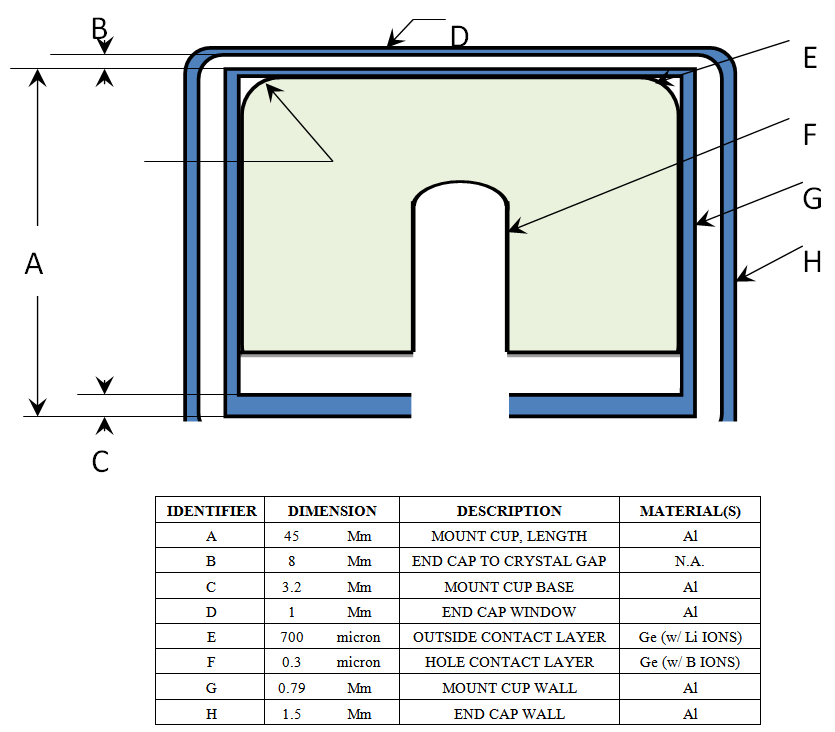 | Figure (1). Characteristics of HPGe detector as provided by the manufacturer |
The MCNP detector model, as drawn by the MCNP visual editor, including surfaces and cells is shown in Fig. (2). | Figrue (2). Model of detector as drawn by MCNP visual editor |
4. Results and Discussion
The direct use of detector dimensions and components, as provided by the manufacturer, resulted in negatively biased uranium isotopic masses (about 5% lower than the certified values). As an example, the estimated isotopic masses for sample #1 were 7.25g and 154.98g, for the U-235 and U-238 isotopes, respectively. Eqn. (1) shows that such biased values could be resulted due to larger values of the calculated fraction “F”. This means that as “F” is gradually reduced (i.e., the fraction for gamma rays absorbed by the detector becomes smaller) the estimated masses will approach the expected certified values. The value of “F” is a function of many factors such as S-D distance, detector geometry (including the depth of the detector hole) and detector dead layer. Other factor such as material types and densities are expected to be precise enough and hence will not be considered.
4.1. Effect of S-D Distance
The total S-D distance is composed of two distances, the sample-to-detector aluminum end cap and the detector surface-to-end cap. The earlier distance could be precisely adjusted within an uncertainty of one millimeter. In this case, the uncertainty in the estimated isotopic mass was calculated to be less than 0.8% for sample #2, which is still far from the negatively biased values (5%). Therefore, the second component of the S-D distance (detector surface-to-end cap) was considered to be the dominant one while investigating the effect of S-D distance.Since the detected fraction of gamma rays is inversely proportional to the S-D distance, the value of “F” is reduced as the S-D increased. The reduction percent of the calculated “F” values will not depend on the energy of gamma ray, since it is a pure geometry-dependent effect. The question is “to what extent this factor could be responsible for the non-accurate “F” values?”. The effect of S-D distance on mass calculations is investigated by calculating “F” fractions at different S-D values using the MCNP5 code. The results of U-235 mass calculations for sample #2 are illustrated in Fig. (3).As shown in Fig. (3), it was found that the S-D distance must be reduced about four millimeters in order to generate U-235 mass value of accuracy better than 0.1%. Since the S-D distance is adjusted with an uncertainty not exceeds one millimeter and the data provided by the manufacturer is also not expected to exceed such uncertainty, hence the effect of S-D distance on mass calculations was excluded.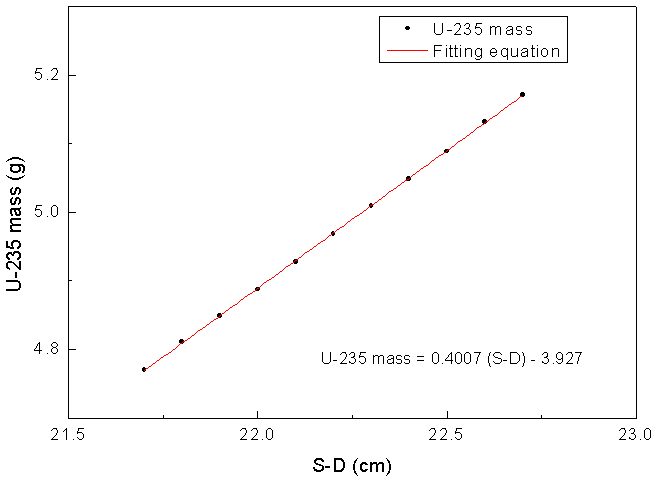 | Figure (3). Results of U-235 mass estimation as a function of S-D distance |
4.2. Effect of Detector Hole Depth
The hole depth of the detector is not only a geometry factor but it affects the efficiency of the detector as well, since the active volume of the detector is changed with it. Moreover, as the hole depth is changed, the response of the detector changes differently with different gamma ray energies. The reason for this could be understood based on the fact that gamma rays with relatively higher energies are absorbed at deeper locations in the detector body than those with relatively lower energies. At such locations the effect of detector hole is not the same. Fig. (4-a & b) shows the variation of the calculated U-235 and U-238 masses with hole depth.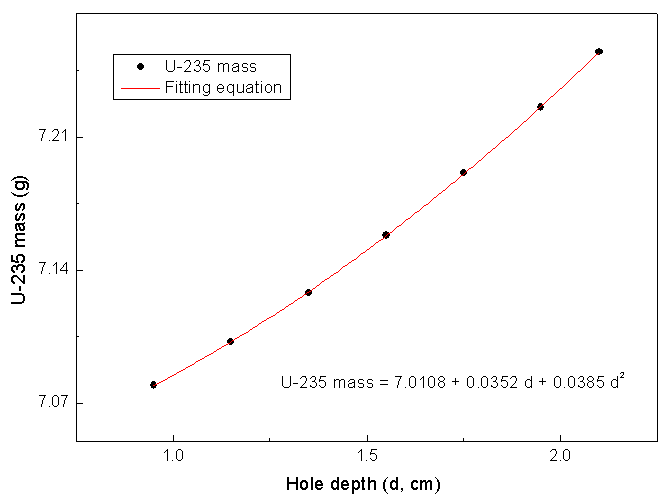 | Figure (4a). Variation of estimated U-235 mass with hole depth of the detector |
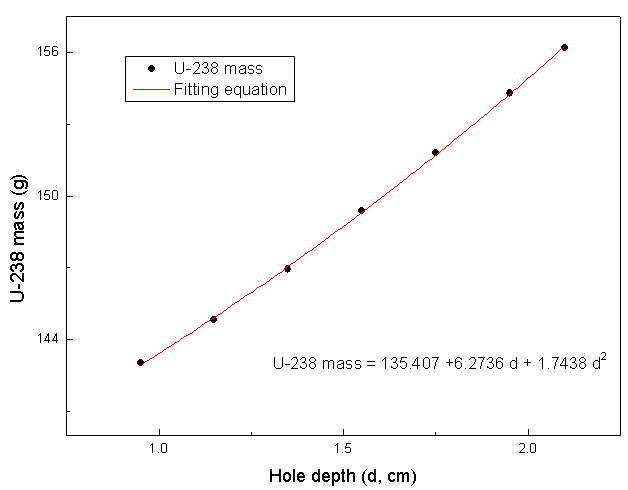 | Figure (4b). Variation of estimated U-238 mass with hole depth of the detector |
From the calculations it was found that the estimated U-235 and U-238 masses varies differently with the hole depth. The changes in the estimated masses are affected more for higher gamma ray energies. As shown in Fig (4), as the hole depth increased from 0.95 to 2.1 cm, the estimated variation in U-235 mass was about 2.3%, while it was about 8.3% for U-238 mass. The whole variation in hole depth (1.15 cm) is considered only for studying the effect of hole depth on the detector response. However, the uncertainty in the hole depth provided by the manufacturer are not expected to be such wide. Therefore, changes in hole depth could be considered only for fine adjustments.
4.3. Effect of Dead Layer
The effect of dead layer was expected to be the most effective component of the detector since it affects the active volume of the detector and has a relatively high density (5.32 g/cm3). It attenuates all incident radiation with energy-dependent fractions and may vary non-homogenously over the detector body. Variations of the estimated uranium isotopic masses with the dead layer of the detector are illustrated in Fig. (5-a& b). As shown in the figure, a small fraction of millimeter (0.1 mm) results in changes in the estimated U-235 and U-238 masses by about 2% and 1.5%, respectively.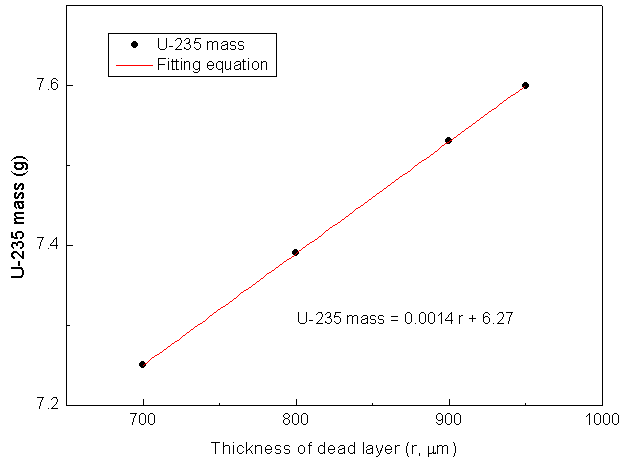 | Figure (5a). Variation of the estimated U-235 mass with the thickness of the detector dead layer |
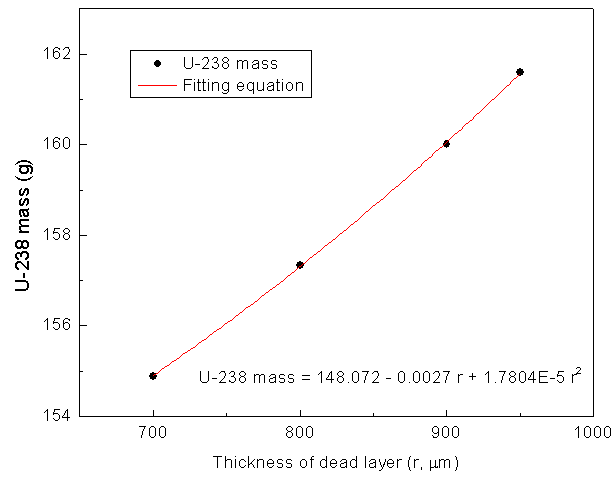 | Figure (5b). Variation of the estimated U-238 mass with the thickness of the detector dead layer |
This shows that small changes in the thickness of the detector dead layer would improve the accuracy of the model. As the thickness increased, the value of the factor “F” decreases, hence, the negative bias in the estimated isotopic masses is eliminated. However, the improvement in U-235 mass is relatively better than that for the U-238 mass – as shown in Figs. (4-a & b). At a specific thickness value of the dead layer, another factor has to be introduced, by which, the rate of improvement in the estimated mass of the U-238 isotope should be higher. The factor could be the hole depth.Fig. (6) illustrates the combined effects of the dead-layer thickness and the hole depth on the absorbed fractions of gamma ray inside the detector body. The figure shows a mapping for the absorbed fractions as a function of the depth of the detector. It is obtained via segmentation of the detector into layers and calculating the absorbed fraction in each layer using the “F8” pulse height tally of the MCNP code. The detector is split into two halves representing the absorbed fractions of the gamma ray signatures of the U-235 (185.7 keV) and U-238 (1001.03 keV) isotopes.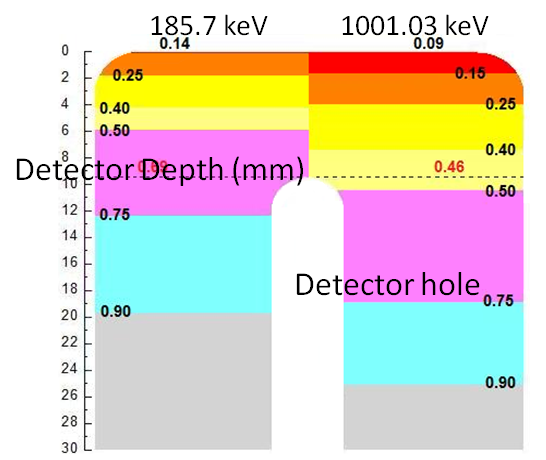 | Figure 6. Mapping of fraction of gamma ray absorbed at different layers in the detector for 185.7 keV (left side) and 1001.03 keV (right side) gamma ray energies |
As shown on the figure, about 14% of the incident 185.7 keV radiation is absorbed in the dead-layer (900 microns) of the detector, while 9% of the 1001.03 keV are absorbed in the same dead-layer thickness. Up to 9.4 mm of the detector depth (beginning of detector hole), 69% of the 185.7 keV are already absorbed against 46% of 1001.03 keV radiations. About half of the 1001.03 keV fractions are absorbed inthe upper part of the detector (before hole starting). It is clear from the figure that the effect of hole depth on the absorbed fraction will be greater for the 1001.03 keV gamma rays. Consequently, the effect of dead layer will be larger for the 185.7 keV gamma rays, while the effect of hole depth is greater for the 1001.03 keV ones. From the obtained results it is clear that the most effective factor which could be adjusted to optimize the detector model is the thickness of the dead layer of the detector. In addition, the detector model has to be re-adjusted with a complementary factor in order to optimize the model. This could be achieved by refining the model via slight changes in the hole depth of the detector. In view of the variation of the estimated uranium isotopic masses at different detector hole depths and thicknesses of the dead layer, the most accurate results were obtained at hole depth of 20.5 mm and a dead layer thickness of 900 microns. Table (2) shows the estimated mass values obtained using the optimized model of the detector. The estimated relative standard deviations in U-235 masses are due to uncertainties in counting rates and MC calculations.Table (2). Uranium isotopes mass values estimated using the optimized model
 |
| |
|
The obtained results are accepted for such category of NM according the international standards [16].
5. Conclusions
A mathematical model for a HPGe detector has been created and refined using the general MC Code (MCNP5). Different factors and parameters affecting the model accuracy have been investigated. The two factors which found to have the main effect and which could be used to adjust and refine the model are the thickness of the dead layer of the detector and its hole depth. An approach for model refinement is considered. The approach depends on the variation of detector response with respect to dead layer thickness and hole depth of the detector. The optimized model could be used to accurately verify NMs for safeguards purposes.
References
| [1] | N.V. de Castro and R.J.A. Lévesque, Nuclear Instruments and Methods, 46 (1967) 325. |
| [2] | B. Lal and K.V.K. Iyengar, Nuclear Instruments and Methods, 79 (1970) 19. |
| [3] | Takashi Nakamura, Nuclear Instruments and Methods, 131 (1975) 521. |
| [4] | Sunita Kamboja and Bernd Kahn, Radiation Measurements, 37(2003) 1. |
| [5] | Octavian Sima, Applied Radiation and Isotopes, 68 (2010) 1403. |
| [6] | P.P. Malekaaand M. Mauecec, Nuclear Instruments and Methods in Physics Research (A),538 (2005) 631. |
| [7] | S. Hurtadoa, M. Garcia-Leon and R. Garcia-Tenorio, Applied Radiation and Isotopes, 61 (2004)139. |
| [8] | R. Berndt and P. Mortreau, Nuclear Instruments and Methods in Physics Research (A), 694 (2012) 341. |
| [9] | B. Blanka, J. Souina and P. Aschera, Nuclear Instruments and Methods in Physics Research (A), 776 (2015)34. |
| [10] | Joel Gasparroa, Mikael Hult, P.N. Johnston and Hamid Tagziria, Nuclear Instruments and Methods in Physics Research (A), 594 (2008)196. |
| [11] | Shakeel Ur Rehman, S.M. Mirza, N.M. Mirza and Muhammad Tariq Siddique, Annals of Nuclear Energy, 38(2011) 112. |
| [12] | W. El-Gammal, Nuclear Instruments and Methods in Physics Research (A), 570 (2007) 446. |
| [13] | J. Ródenas, A. Pascual, I. Zarza, V. Serradell, J. Ortiz and L. Ballesteros, Nuclear Instruments and Methods in Physics Research (A), 496 (2003) 390. |
| [14] | E. Chhama, F.P. Garica and T. El Bardouni, Applied Radiation and Isotopes, 95 (2015) 30. |
| [15] | N.Q. Huya, D.Q. Binhb and V.X. Ana, Nuclear Instruments and Methods in Physics Research (A), 573 (2007) 384. |
| [16] | IAEA (2010), “International Target Values 2010 for Measurement Uncertainties in Safeguarding Nuclear Materials", STR – 368, Vienna, Nov. 2010. |


 mass of the assayed isotope “i” [g];
 count rate of the detector of a certain gamma ray due to isotope “i” [s-1];
 fraction of the specific gamma ray absorbed in the active detectormaterial estimated using MC calculations;
 physical constant for the specific gamma energy (specific activity of the assayed isotope and the branching ratio of the gamma ray) [g.s-1].Although the equation shows that the mass is simply estimated if the count rate is measured and the factor “F” is calculated, efforts should be concentrated on generating accurate “F” values.Estimation of “F” using MC calculations includes all factors affecting the measurements. This will include gamma rays attenuation due to all media through which radiation transport, geometry factors (setup configuration), and detector efficiency. The detector characteristics which are provided by the manufacturer include: the material, geometry and dimensions of the detector and its components (detector housing, detector holder, end cap-to-detector distance, dead layer .. etc). Usually, such details in addition to other detector components are not precisely provided by the manufacturer. Hence, the generated simulation model might not represent the typical detector although it gives accurate results for specific adapted cases. In addition, some provided information may change with time (e.g. thickness of the dead layer) which necessitates re-characterization of the detector [13].Each of the detector components must be investigated separately. Then the most effective ones are selected to optimize the detector model. Studying the effect of each part of the detector is performed via slightly changing its dimensions and recognizing its effect on the “F” factor. In order to avoid uncertainties due to other factors than the detector design a set of standard NM samples was used to perform some experimental measurements. The obtained results were used for optimizing the detector model.


 Abstract
 Reference
 Full-Text PDF
 Full-text HTML
