M. Moshiur Rahman1, Najmun Naher1, Sattajit Ghosh2, M. Moinul Islam2
1Department of Physics, Jahangirnagar University, Savar, Dhaka
2Bangladesh Atomic Energy Commission
Correspondence to: M. Moshiur Rahman, Department of Physics, Jahangirnagar University, Savar, Dhaka.
| Email: |  |
Copyright © 2014 Scientific & Academic Publishing. All Rights Reserved.
Abstract
The Efficiency calibration of a spectrometer (HPGe detector) was performed to measure radionuclide concentrations in milk powder. A calibration standard (Eu-152) was used, and counting has been taken for two different positions and a procedure of analyzing milk powder samples was established with a relative error of about 2 to 5%. The geometrical and self-absorption effects, as well as the density dependence of milk powder samples, were investigated. Self-absorption was measured for the activity calculation of the 120 keV-1408 KeV lines of the Eu-152 standard, in powder milk samples. The activities for different samples were ranging from 163.595 Bq/gm to 400.425 Bq/gm and no variation of activity was found due to different detection systems. The variation of efficiency occurred due to different sample matrix, detection system and detector’s relative efficiency. It is observed that the efficiency is inversely proportional to the energy. The acquired information would be useful for making an appropriate radiation control limit which could be imposed on milk powder for public consumption in Bangladesh. The experimental result obtained in this study would be useful for future reference.
Keywords:
HPGe Detector, MCA, Radionuclides, Activity Concentration, Eu, etc
Cite this paper: M. Moshiur Rahman, Najmun Naher, Sattajit Ghosh, M. Moinul Islam, Efficiency Calibration of Gamma Spectrometry for Powdered Milk Sample Using Cylindrical Geometry, Journal of Nuclear and Particle Physics, Vol. 4 No. 4, 2014, pp. 117-122. doi: 10.5923/j.jnpp.20140404.01.
1. Introduction
High Purity Germanium (HPGe) detector with computer based MCA is the most significant instrument both for qualitative and quantitative analysis of radiation or the concentration of radionuclide in environmental samples. Chemical composition in environmental samples may ranging in density from near 0 to about 2.0 gm/cm3 [1]. However, this measurement system for different types of matrix sample is not applicable due to the measurement error, sample counting error as well as similar types of standards. It is necessary to develop a new and efficient method. The accurate measurement of the efficiency concentration of the sample is very much significant to determine activity concentration. The efficiency is a function of the gamma ray energy, sample composition, density, sample size, detection system and detector’s relative efficiency [2, 3, 4, 5]. Another significant effect among them is self absorption for large volume. The detector efficiency would be determined by count rates per second for corresponding full energy peak. The work presents a method of measuring radionuclide concentrations in milk powder samples by a low background HPGe spectrometer at the range of 120KeV to 1410 KeV gamma photo-peak. In order to measure the efficiency, the milk powder sample of the same density taken in different geometrical cylinder for spectroscopy analysis. The counting time for each sample was set to 10000 seconds. A calibration standard (Eu-152) was used for preparation of the standard sample. The error (%) of the homogeneity of the primary standard sample matrix was (1-3)%. The procedure of analyzing milk powder samples was established with a relative error of about 2 to 5%. In this work, the spectra were obtained from two HPGe detectors having different relative efficiency (20% & 40%). The efficiency of HPGe detector is a product of geometric efficiency, intrinsic efficiency and sample efficiency [6]. For efficiency calculation, counting has been taken by keeping the samples at two different positions which were at the end cape of the detector and zero to 10 cm from the surface for both detectors. Efficiency as a function of energy is usually fitted by polynomial function of the 2nd degree.
2. Methods and Materials
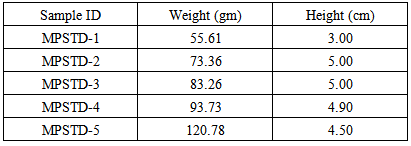
HPGe detector technology is capable to provide sufficient information to identify radionuclide’s from their passive gamma ray emissions accurately and reliably. The HPGe detector has 20-30 times better resolution than the NaI detectors [7].Materials and ReagentsFor this study plastic container, 100ml, 150ml, 200ml, 250ml, 300ml and Eu-152 standard solution were used. Milk powder samples were collected from the local market. The energy calibration of gamma ray spectrometer in accordance with the IAEA recommendation (IAEA, 1989).Table 1. The sample description
 |
| |
|
Sample PreparationThe milk powder sample is prepared by injecting 0.52gm of EU-152 standard solution into the container of 10gm milk powder sample. The sample was carefully mixed before taking count rates to ensure the homogeneous distribution of EU standard source with milk powder sample. Then the activated 2gm of milk powder sample of same weight and height was taken into three 100mL container and detector count was taken. The detector count rates of three containers were same which indicates that the EU-152 standard was homogeneously mixed up. By this process, MPSTD-1 sample was prepared. Similar procedure was used to prepare the other samples, MPSTD-2, MPSTD-3, MPSTD-4 and MPSTD-5. The weight and height of five samples of five different containers were not same. But the density of the samples of each container was same, and it was 0.55gm/cm3. The containers were sealed tightly and wrapped with thick vinyl tapes around their screw necks. Then the samples were kept for a preset periods of time and then gamma spectrometry was performed. Gamma spectra were collected three times for each measuring point.
3. Results and Discussion
Efficiency calibration and measurement of self-absorption correction for milk powder sample was carried out by using cylindrical container of different volume. Efficiency Calibration were carried out for source energy at 121.74, 244.69, 344.27, 411.11, 443.91, 778.89, 963.38, 1085.78, 1112.02, 1407.95 KeV. Counting times for all types of samples were 10000 seconds for each energy. The activity of a source at any time from the day of its primary activity Ao can be calculated by using the radioactive decay equation as | (1) |
Where, Ao is the initial activity of the standard source at t = 0, At is the activity of the source after time t and t1/2 is the half life of the source.Table 2. Specification of the Standard γ - Ray Sources
 |
| |
|
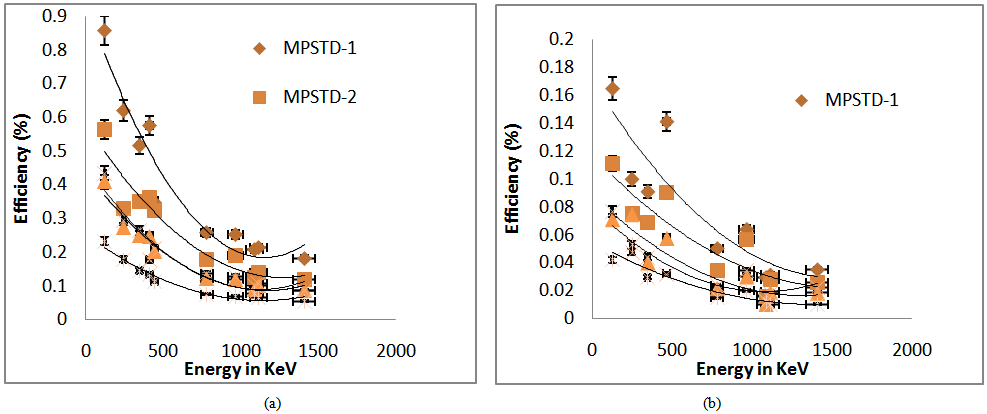 | Figure 1. Efficiency versus energy graph (a) at end cap position (b) at 0 to 10 cm distance from detector surface for the detector of relative efficiency 40% |
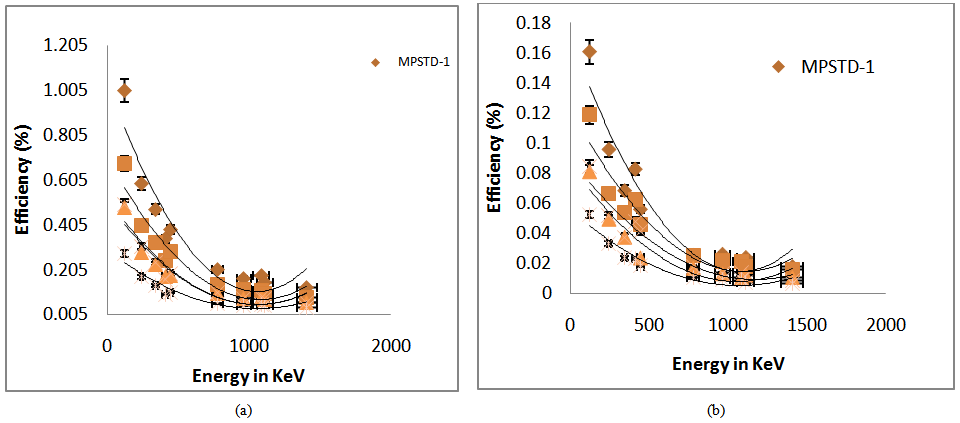 | Figure 2. Efficiency versus energy graph (a) at end cap position (b) at 0 to 10 cm distance from the detector surface for the detector of relative efficiency 20% |
 | Figure 3. At end cap position for detector (relative efficiency 40%) |
 | Figure 4. At 0 to 10cm distance from detector surface for detector (relative efficiency 40%) |
Efficiency calibrationEfficiency calibrated at end cap position of the detector and 0 to10cm distances from the detector surface for detector (relative efficiency 40%) & detector (relative efficiency 20%).From the above figure, the efficiency curve is falling in nature. There is a sharp decrease of the efficiency (%) with the increasing energy. At higher energy range, the decreasing rate is small. The efficiency (%) is not same at two different positions of detector 1 (relative efficiency 40%). Similar nature shows for detector 2(relative efficiency 20%). The efficiency variation (%) between the end cap position & 0 to 10cm distance is about 72%-80% for each energy. We have also determined the efficiency values at same position for two detectors for identical sample that are different. It can be inferred that detector itself is a factor for efficiency determination. The height & volume of the five samples were different. The volume of the MPSTD-1 is greater than MPSTD-2, but the height of the MPSTD-1 is less than MPSTD-2. In this case, the efficiency value of MPSTD-1 is greater than MPSTD-2 for two detectors and also for two different positions. So it is another factor for self absorption. Efficiency variation occurred with sample weight for particular energy range is shown in the graph for two detectors with sample at end cap position & at zero to 10cm distance from detector surface.These graphs represent that the efficiency values decrease with increasing weight of the sample for each particular energy range. So the weight of the samples is an important factor for efficiency determination. In order to search a relationship between the efficiencies (%) and the energy values, an effort has been made here to obtain a polynomial, power series or exponential relationship. The following trial equation was chosen. | (2) |
Where, y = efficiency, x = energy in KeV and, A & B are constants.The fitting efficiency was calculated from the equation (y=Ax-B) for the milk powder sample MPSTD-1, MPSTD-2, MPSTD-3, MPSTD-4, MPSTD-5. The variation (%) between experimental efficiency (%) and fitting efficiency (%) is not so high, about 3-10 % variation occurred for both at end cap position & zero to 10 cm distance of two detectors. The fitting efficiency curve also can be determined from fitting efficiency values. Using efficiency value we find out the activity of milk powder sample for two detectors at two different positions.Similar calculation was repeated for each sample and activity of different samples are varies from 163.595 Bq/gm to 400.426 Bq/gm. This variation occurs for different height, weight of the samples and different size of the containers.We find that the measured activity of detector 1 and detector 2 are same at the position of end cap of the detector and zero to 10cm distance of the detector for each sample. So the activity does not vary for detection system and the detector geometry. If we use end cap efficiency value to measure activity keeping sample at zero to 10 cm distance, the activity variation occurred. Similarly, we use distance efficiency to determine the activity at end cap of the detector. The activity variation (%) shown in table. So efficiency determination is essential to determine activity concentration.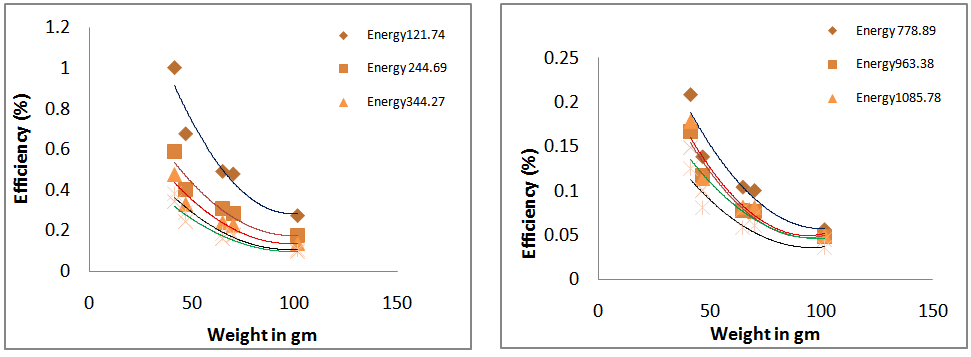 | Figure 5. At end cap position for detector (relative efficiency 20%) |
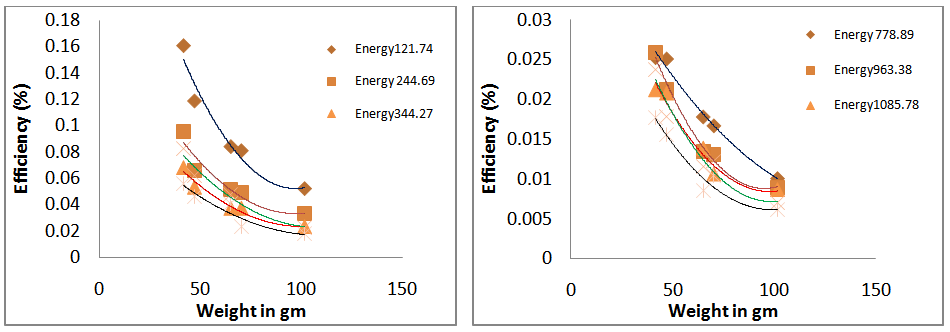 | Figure 6. At 0 to 10cm distance from detector surface for detector (relative efficiency 20%) |
 | Table 3. Value of constant A & B at different sample matrix |
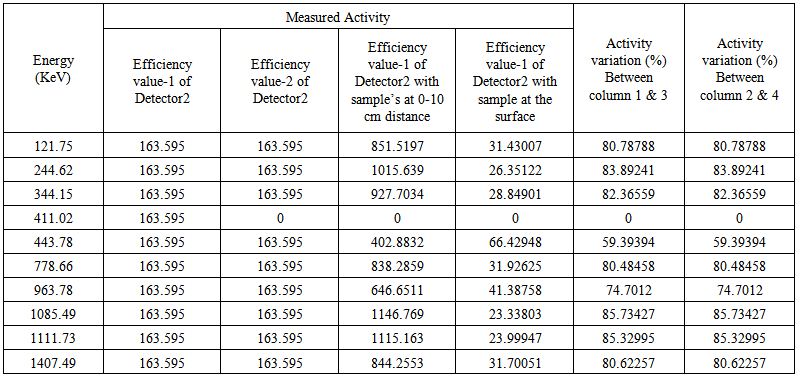 | Table 4. Activity of milk powder sample (MPSTD-1) for detector 1 |
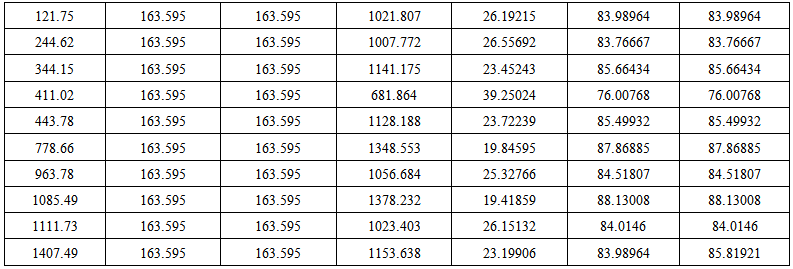 | Table 5. Activity of milk powder sample (MPSTD-1) for detector 2 |
4. Conclusions
The efficiency calibration of HPGe detector was performed by changing the sample’s positions for two different detectors. From the results, the efficiency variation occurred due to different sample matrix, detection system and detector relative efficiency. The identical shape of the curves represents the accuracy of the calibration. Experimental result shows that the efficiency is inversely proportional to the energy. The variations of efficiency with position indicate the importance of the geometry during the gamma spectrometry of unknown samples. That is identical geometry should be maintained during the calibration of the detector and counting of unknown samples. The activity of the each sample was justified by using a different set of calibration. Each time the activity has been changed with changing of calibrated efficiency for same samples. The result indicates that the efficiency of the detector is not universal or intrinsic. Efficiency depends on the physical density and chemical composition of the materials. It also depends on the geometry of the performance. In conclusion, it can be said that the efficiency calibration of HPGe detector is a vital factor and should be performed with the similar standards at the beginning of gamma spectrometry as of the samples.
References
| [1] | P. Patnaik “handbook of environmental analysis” (2009). |
| [2] | G. Hasse, D. Tait and A. Wiechen “ determination of full energy peak efficiency for cylindrical volume sources by the use of a point source standard in gamma spectrometry” Nuclear Instruments and Methods in Physics Research A 361 (1995) 240-244. |
| [3] | J. P. Pérez-Moreno, E. G. San Miguel, J.P. Boliıvar, J. L. Aguado “A comprehensive calibration method of Ge detectors for low-level gamma-spectrometry measurements” Nuclear Instruments and Methods in Physics Research A 491 (2002) 152–162. |
| [4] | Z. B. Alfassi, N. Lavi “The dependence of the counting efficiency of Marinelli beakers for environmental samples on the density of the samples” Applied Radiation and Isotopes63 (2005) 87–92. |
| [5] | F. J. Hernandez “Optimization of environmental gamma spectrometry using Monte Carlo methods” Ph.D. thesis, Uppsala University, Sweden. 2002. |
| [6] | I. Vukasinovic, D. Todorovic, D. Popovic “the dependence of Ge detectors efficiency on the density of the sample in gamma-ray spectrometry” Nuclear Technology & Radiation Protection (2/2007) 58-74. |
| [7] | ARC Seibersdorf (2001), ITRAP, Illicit Trafficking Radiation Detection Assessment Program., Final report. |


 Abstract
 Reference
 Full-Text PDF
 Full-text HTML
