Moses E. Emetere
Department of Physics, Covenant University, Canaan land, P.M.B 1023, Ota-Nigeria
Correspondence to: Moses E. Emetere, Department of Physics, Covenant University, Canaan land, P.M.B 1023, Ota-Nigeria.
| Email: |  |
Copyright © 2014 Scientific & Academic Publishing. All Rights Reserved.
Abstract
Uranium is vital to nuclear power generation. Its hazard is a formidable threat to life forms. A small portion of a regional land mass - not known for uranium mining was analyzed to examine the risk of future environmental pollution when the proposed nuclear plant is cited in the country. The bye product of the spot deposition of uranium over the environs of Ewekoro was theoretically examined. Though the radioactive pollution within the region is normal compared to other regions of Nigeria, constructing a nuclear power plant without acknowledging the radioactive data could be suicidal for the life forms in any part of the country.
Keywords:
Uranium, Health Hazard, Gamma, MATLAB, Energy
Cite this paper: Moses E. Emetere, Theoretical Forecast of the Health Implications of Citing Nuclear Power Plant in Nigeria, Journal of Nuclear and Particle Physics, Vol. 4 No. 3, 2014, pp. 87-93. doi: 10.5923/j.jnpp.20140403.01.
1. Introduction
Uranium is the heaviest radioactive element that can be naturally present in some rocks and ground-water. Recently, a research work conducted by Olukorede et al. [1] in Ewekoro, south-west Nigeria, confirmed the presence of Uranium and other radio nuclei in the soil about Ewekoro up to a distance 25Km from their reference point(cement factory). The danger of uncontrolled deposition of uranium can be enormous, for example, studies have shown that drinking water with uranium levels above 30 ppb may increase the risk of kidney failure, liver malfunction, anemia, lung cancer among other notable cancerous infection [2, 3]. Elevated concentrations of uranium in well water often indicate high levels of radon in the home [4]. The radon gas generation is proportional to the amount of uranium in the underlying ground water, rocks and soils. Aside radon gas, Uranium (238U) emits beta and gamma rays which forms a significant portion of the external radioactive pollution on the earth. Uranium emits radioactive particle which can be ingested, inhaled or penetrating the skin. After coal, the uranium fuels are the second most abundant sources of electric energy in the world [5]. As at 2006, a total of 435 nuclear power plants were in operation in the world and about 29 nuclear power plant under construction [6]. In other words, nuclear power generation is a globally accepted means of electricity generation. Uranium deposits were discovered in six states of Nigeria by the Atomic Energy Division of the Geological Survey of Great Britain. The six states includes: Liruai hills in Kano state, Kigo hills in Plateau state, Adamawa, Cross River, Taraba and Bauchi. The actualization of an African state- embarking on nuclear power generation came alive when Nigeria’s Federal government signed an energy accord with a Russian company, Rosatom Corp, to work on mining uranium, building and testing atomic power plants and sharing knowledge. It is therefore logical to think of mining the uranium before constructing the power station. In the eighty's, the Nigeria Uranium Mining Company (NUMCO) was established though it was short live. After NUMCO, there had been illegal uranium mining in various parts of the affected states. The risk of uranium mining is enormous on the public health and natural environment. According to International Atomic Energy Agency (IAEA), the natural environmental risk includes: the risk of environmental degradation, contamination, reduced ecosystem viability and biodiversity, aesthetics, public amenities, access to land, and quarantining of land for future beneficial land use. The uranium contamination of water resource by the toxic chemicals in the separation of the uranium ore, mismanaging of uranium disposal waste from leaching ore, uranium mill tailings amongst others are vital waste disposal problems must be put into consideration for the smooth running of a uranium mining mill and nuclear generating power plant in developing countries. The initial environmental state of the area must be put into consideration before projecting into nuclear power generation. In this paper, we considered the spot deposition of uranium in a small portion of a region not known for large deposition of uranium. We compared the results to other regions where there are mining of uranium and we projected our findings into the futuristic danger in other parts of the country (Nigeria). This objective of the work is to investigate to ascertain if waste disposal from uranium power plant could be managed in developing countries.
2. Theoretical Background
The geoaccumulation index is defined as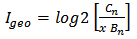 | (1) |
where  is the concentration of the chemical element n in fine grained fraction of the sediments concerned;
  is the geochemical background concentration in the clay fraction of sediments (average clay value);
  is the adjustment factor which provides for local litho logical background values. The total dose from internal intake of uranium as summarized by World Health Organization [7] is represented mathematically as
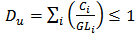 | (2) |
where  is the measured activity concentration of radionuclide
  , and
, and  is the guidance of radionuclide i, at an intake of 2 L/day1 for 1 year, which will result in an effective dose of 0.1 mSv/year. The specific activity (in Bq kg−1),
  , of a nuclide
  and for a peak at energy E, is given by
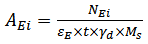 | (3) |
where  is the Net Peak Area of a peak at energy Ε,
  is the detection efficiency at energy Ε, t is the counting lifetime,
  is the number of gammas per disintegration of this nuclide for a transition at energy E, and
  is the mass in kg of the measured sample. The annual dose equivalent is given by Marilyn et al., [8]
  | (4) |
Where D is the annual absorbed dose rate in micro Sievert per year, σ is the absorbed dose rate in micro Sievert per hour. μ is the occupancy factor which is given as 0.2 and t is time in hour.Equations (1-4) gave rise to the governing equations (5-8)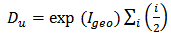 | (5) |
Where 
 | (6) |
 | (7) |
From the dispersion of contaminants discussed by Emetere et al., [9, 10] equation (7) can be written as | (8) |
Equation [3] therefore transforms to | (9) |
3. Methodology
A virtual laboratory was developed using MATLAB to analyze the mathematical implications of the mathematical expression given in equation (5). The assumption is that uranium concentration in the ground water, soil and rocks decays under the catalyst of natural factors which is a source of partial emission of gamma into the atmosphere. Equations (8 & 9) is the rate of dispersion of gamma emission into the atmosphere which is expressed as the ‘geoaccumulation index’. Theoretically, we narrow the work to Ewekoro as seen in figure (1) below.
4. Results and Discussion
The parameter for the dispersion was analyzed at various hazard levels. This was only possible by comparing equations (7) & (8) as  | (10) |
 | (11) |
In order to transform equation (11) to the Klein–Nishina, we introduced the acceleration due to gravity (g).  | (12) |
is the volume of the dispersed gamma radiation. We therefore differentiate both sides with respect to  | (13) |
From the Klein–Nishina, as  vanishes, it is evident that equation (13) reduces to
 | (14) |
The gamma radiation dispersion analysis was carried out under five conditions i.e.  ,
,  ,
,  ,
,  ,
,  as shown in figure [1] below. The dispersion analysis truly was in agreement with experimental results. Line 'a' represents the geoaccumulation index at 0.1, presently no region of the country falls within the group a. Line 'b' represents the geoaccumulation index at 0.2, the experimental field work of Olukorede et al. [1] shows that Ewekoro, south west Nigeria belongs to group 'b'. Avwiri et al., [10] field work also showed that Onne, south-south Nigeria also belongs to the group 'b'. Line 'c' represents the geoaccumulation index at 0.3, the experimental field work of Arabi et al. [12] shows that Kundiga and Yimirdallang, North east Nigeria belongs to group 'c'. Line 'd' represents the geoaccumulation index at 0.4, the experimental field work of Jwanbot et al., [13] and Laar [14] shows that Barkin Ladi, Jos Plateau, north central Nigeria belong to group 'd'. Line 'e' represents the geoaccumulation index at 0.5. Low geoaccumulation index was chosen because it is assumed that the gamma dispersion is not from the uranium mill but from the rocks, soil and ground water within. The result below shows that the increase of the geoaccumulation index beyond 0.5 is eminent. This may be detrimental to the health of the people in such area. Also, the higher the volume of radioactive pollution, the intense it is for life forms. At this low geothermal index, cases of kidney malfunction alongside cancer in both adult and children have increased in hospitals [15, 16, 17]. The good thing is that the higher volume of gamma dispersion do not travel very far (as shown in figure (2)) unlike pollution from anthropogenic sources [10].To confirm the results in figure (1), we investigate the Net Peak Area at a distance range 0- 25km. We adopted Olukorede et al. [1] distances to see the variation difference between theoretical and experimental data in order to know the accuracy of our model. We assumed a detection efficiency of 20% and acceleration due to gravity around the cement factory to be 9.81m/s2. The volume were tested at 0.01m3, 0.1m3, 10m3 and 100m3.The general feature of figures (3-6) seems alike. The detail of each figures corroborate with the findings in figure (2). First, figures (3-6) shows that the dispersion of gamma radiation is dependent on the net peak area. Second, it shows that gamma pollution is localized. This means that far neighboring communities from affected zone may be safe. Third, a random directional movement of dispersion is noticed which might be as a result of the atmospheric deflection force known as the Coriolis force. The distinct difference in the features of figure (3-6) is the decrease in the Net peak area as the volume of gamma dispersion decreases.
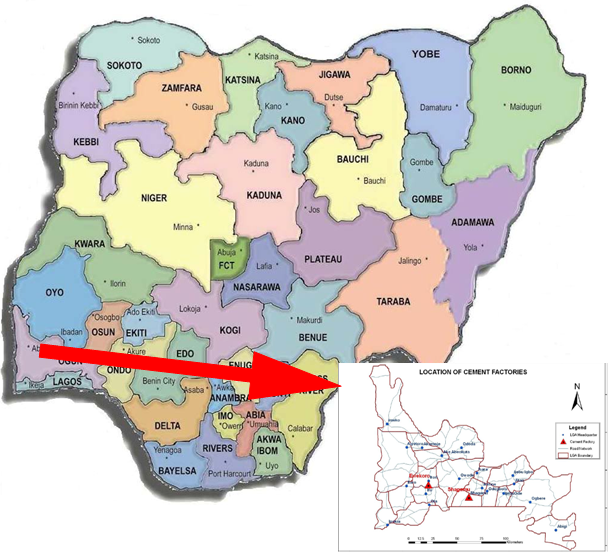 | Figure 1. Study area- Ewekoro, south west, Nigeria |
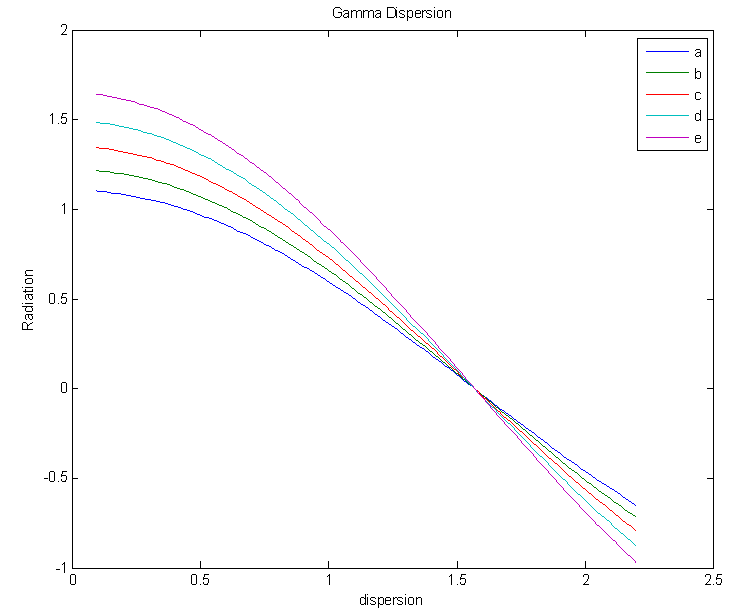 | Figure 2. Gamma radiation dispersion within an energy range of 0 - 2.5KeV |
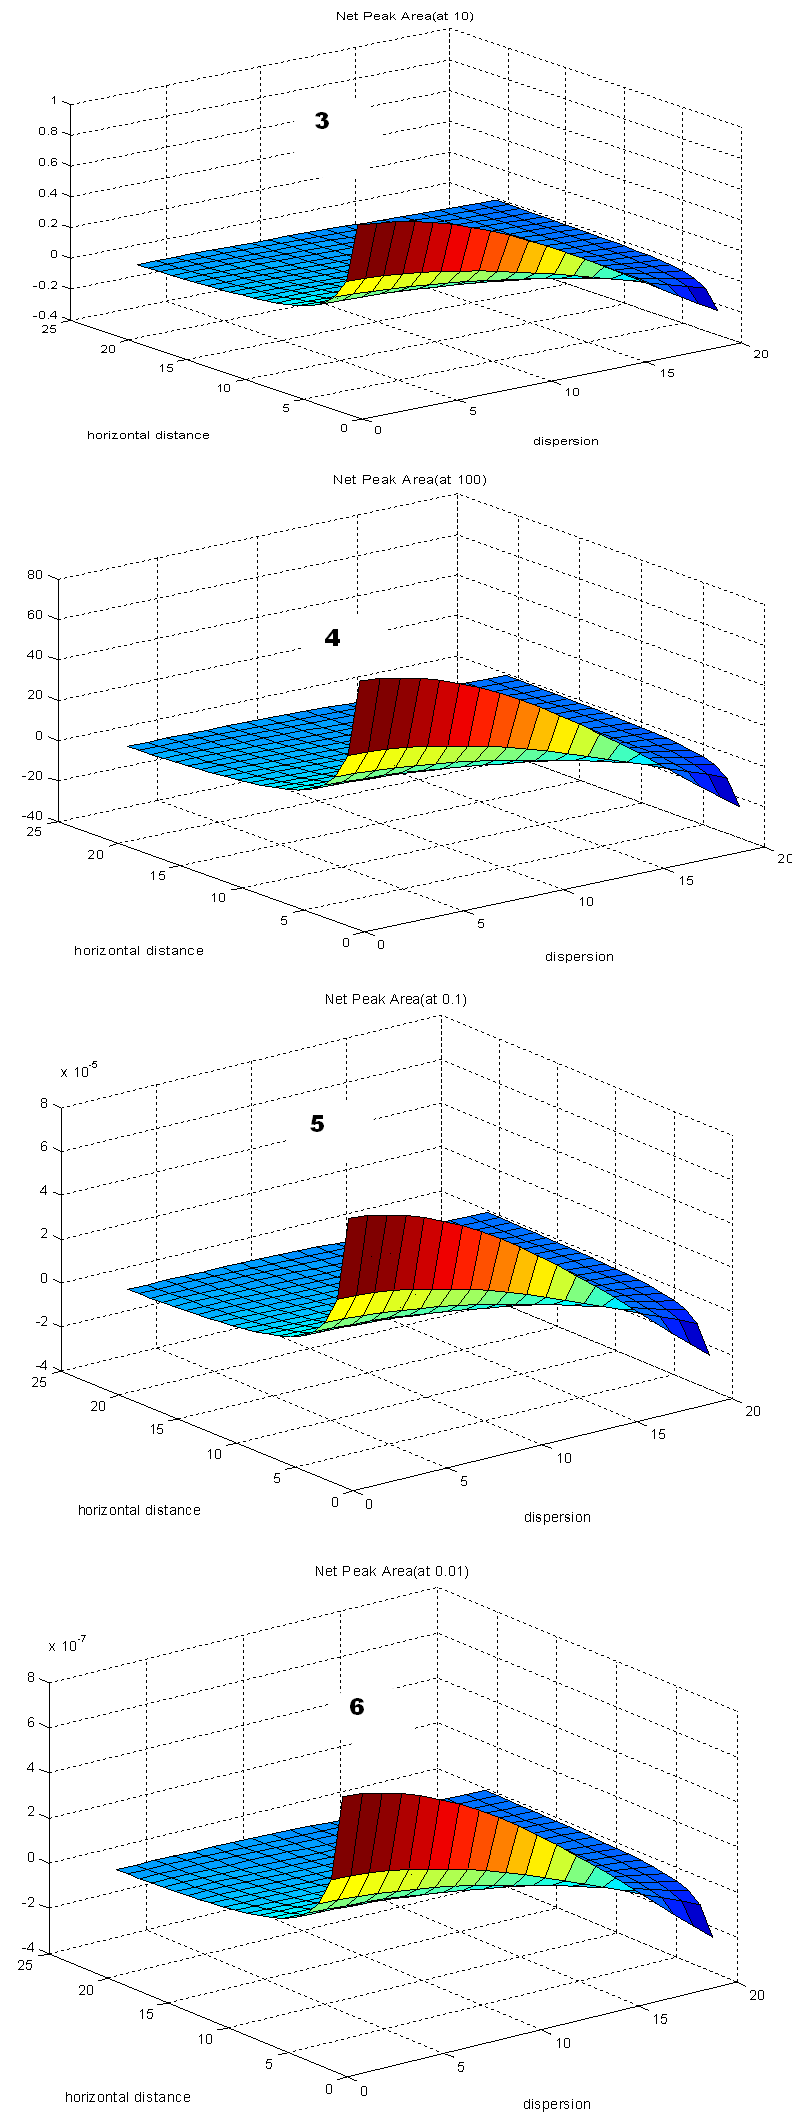 | Figure (3-6). Net Peak Area analysis at varying distances |
5. Conclusions
The dispersion of the bye-products of uranium (gamma and radon gas) is directly proportional to the Net Peak Area and inversely proportional to the propagating distance. The spread of both the radon gas and gamma ray seem to be localized. The investigation into spot deposition of uranium in parts of Nigeria and its effect on other regions with heavy uranium deposition has shown that developing country may not be matured to control future radioactive pollution from nuclear power station. Already, through illegal mining of uranium, some parts of the country are already suffering. The first step towards constructing a nuclear station is to holistically examine the safety parameters in air, water and land of all the regions of the country.
References
| [1] | Adewole O. Olukorede & Ewumi T. Olubunmi(2011) Radiological Impact Survey Of Sites Around Two Cement Producing Factories: Wapco And Purechem, Ewekoro, Southwestern, Nigeria. Report and Opinion. 3(2) 37-42. |
| [2] | Orloff, K.G., K. Mistry, P. Charp, S. Metcalf, R. Marino, T. Shelly, E. Melaro, A.M. Donohoe, and R.L. Jones. (2004). Human exposure to uranium in groundwater. Environmental Research 94:319-326. |
| [3] | Rogel et al., Lung cancer attributable to indoor radon exposure in France, impact of the risk models and uncertainty analysis. Environment and Health perspectives 2006; 114(9):1361-6. |
| [4] | Butler, A.H., and B. Kahn. 1995. Radon-222, radium-226, and uranium in Georgia Piedmont well water. Proceedings of the Georgia Water Resources Conference (1995). K.J. Hatcher, ed. P. 401-404. |
| [5] | Vitaliy A. Yatsenko, Panos M. Pardalos and Steffen Rebennack. (2009)Critical States of Nuclear Power Plant Reactors and Bilinear “Energy Systems,” vol. 1, Springer, pp. 149-166, International Atomic Energy Agency. Annual Report 2006. |
| [6] | International Atomic Energy Agency Annual Report (2006) http:// www.iaea.org/ Publications/ Reports /Anrep2006/nuclear_power. |
| [7] | WHO Water Quality and Health Strategy 2013-2020, http:// www. who. int/water sanitation health/dwq/GDW9rev1and2.pdf. retreived 23rd July, 2013. |
| [8] | Marilyn, E.N. and G.Q. Maguire Jr., (1995). Radiation Protection in the Health Sciences. 1st Edn. World Scientific Publishing, Singapore, pp: 296. DOI10.4028/www.scientific.net/ AMR. 367.801. |
| [9] | Moses E Emetere and M.L Akinyemi (2013). Modeling Of Generic Air Pollution Dispersion Analysis From Ewekoro Cement Factory. Analele Universitatii din Oradea–Seria Geografie 231123-628, pp 181-189. |
| [10] | Moses E Emetere (2013). Modeling Of Particulate Radionuclide Dispersion And Deposition From A Cement Factory. Annals of Environmental Science,7(6) 71-77. |
| [11] | Avwiri, G.O, Alao, A.A, Onuma, E.O. Survey Of Terrestrial Radiation Levels Of Onne Seaport, Rivers State, Nigeria.Asian Journal Of Natural & Applied Sciences.Vol. 1. No. 3. September 2012 pp 107-114. |
| [12] | Arabi, S. A. Funtua, I. I. Dewu, B. B. M. Alagbe, S. A Kwaya, M. Y. Garba, M. L. Baloga, A. D. J Radioanal Nucl Chem (2013) 295:135–142. |
| [13] | Jwanbot, D.I. Izam,M.M. Nyam G.G. and N.H. John. Investigation of the Uranium Content In Some Soil Samples from Barkin Ladi LGA, Plateau State – Nigeria. Journal of Natural Sciences Research. Vol.2, No.8, 2012pp 61-67. |
| [14] | Lar Uriah Alexander, Trace elements and health: an environmental risk in Nigeria, Earth Science (2013; 2(3): 66-72. |
| [15] | Chukwuonye II, Oviasu E.The Plight of Chronic Kidney Disease Patients in Nigeria.IOSR Journal of Dental and Medical Sciences.2( 2)( 2012), PP 52-55. |
| [16] | Etuk IS, Anah MU, Ochigbo SO, Eyong M. Pattern of paediatric renal disease in Inpatients in Calabar, Nigeria. Trop Doct 2006; 36(4): 256. |
| [17] | Isaac E. Ocheke, Selina N. Okolo, Fidelia Bode-Thomas, Emmanuel I. Agaba. Pattern of Childhood Renal Diseases in Jos, Nigeria: A Preliminary Report. Journal of Medicine in the Tropics (2010) 12: 52-55. |
 Abstract
 Reference
 Full-Text PDF
 Full-text HTML