-
Paper Information
- Next Paper
- Paper Submission
-
Journal Information
- About This Journal
- Editorial Board
- Current Issue
- Archive
- Author Guidelines
- Contact Us
Journal of Nuclear and Particle Physics
p-ISSN: 2167-6895 e-ISSN: 2167-6909
2014; 4(2): 47-57
doi:10.5923/j.jnpp.20140402.01
Study of Fractality and Chaoticity in 28Si+Emusion Collisions at Energy 14.6A GeV
 Abstract
 Reference
 Full-Text PDF
 Full-text HTML
M. Ayaz Ahmad1, Mir. Hashim Rasool2, Shafiq Ahmad2, Jamal H. Madani1
1Physics Department, College of Science, University of Tabuk, P.O. Box 741, Tabuk-71491, Saudi Arabia (K.S.A.)
2Physics Department, Aligarh Muslim University, Aligarh 202002, India
Correspondence to: M. Ayaz Ahmad, Physics Department, College of Science, University of Tabuk, P.O. Box 741, Tabuk-71491, Saudi Arabia (K.S.A.).
| Email: |  |
Copyright © 2012 Scientific & Academic Publishing. All Rights Reserved.
An approach has been made to study the fractality and chaotic behaviour of relativistic charge particles produced in the collisions of 28Si beam (projectile) + nuclear emulsion (fixed target) at an energy (14.6 28) ≈ 409 GeV by using new parameters named as entropy index, μq. The distributions of Scaled Factorial Moments (SFMs) are measured and referred a scaling behaviour which supported to chaoticity or spatial fluctuations in relativistic heavy-ion collisions at high energies. The values of entropy indices (μq) are calculated which indicates the chaotic nature of multiparticle production system with a specific self-similar structure. Finally, the present experimental results have been compared with the predictions of Ultra-relativistic Quantum Molecular Dynamics (UrQMD) model and find a good agreement between the experimental and theoretical data.
Keywords: Dynamical fluctuations, Fractality and chaoticity, Nuclear emulsions experiment
Cite this paper: M. Ayaz Ahmad, Mir. Hashim Rasool, Shafiq Ahmad, Jamal H. Madani, Study of Fractality and Chaoticity in 28Si+Emusion Collisions at Energy 14.6A GeV, Journal of Nuclear and Particle Physics, Vol. 4 No. 2, 2014, pp. 47-57. doi: 10.5923/j.jnpp.20140402.01.
Article Outline
1. Introduction
- The interest in the study of high-energy nuclear matter has increased many folds due to the possibility of studying unstable states of nuclear matter under extreme condition of high energy density and high temperature. Physicists are very keen to see its outcomes as they expect that it would throw its flashes towards the evolution of the universe and deconfined state of freely interacting quarks and gluons known as quark-gluon plasma (QGP) [1-3], which is believed to have existed in the form of QGP for few microseconds after the Big Bang. It is also interesting to study about the strong forces present between the quarks and gluons in the hadronic matters. It is believed that shortly after the creation of the Big Bang all matters were in a state called the QGP. Due to rapid expansion of the universe, this plasma went through a phase transition to form large number of hadrons like pions, protons and neutrons etc. Such a new phase of matter might be produced experimentally in heavy ion collisions at ultra-relativistic energies. A variety of possible signatures for the transient existence of a deconfined state of matter in nucleus-nucleus (A-A) collision has been proposed theoretically and studied experimentally by various workers [4,5]. The experimental observation of large rapidity fluctuations [6] has provided interest and excitement about their nature and origin. Bialas and Peschanski [7] have suggested that a power law scaling behaviour of normalized SFMs
 on the bin size and described the phenomenon as “intermittency”, a term coined from hydrodynamic turbulence [8]. The SFMs method cannot only predicts the existence of large non-statistical fluctuations but it could also investigate the pattern of fluctuations and their origin. It is generally believed that through the heavy ion collisions at ultra-relativistic energies big systems with very high energy density [9] might be produced. In these systems novel phenomena, such as colour deconfinement [10], chiral-symmetry restoration [11], discrete-symmetry spontaneous-breaking [12], etc., are expected to be present and different events might be governed by different dynamics. In recent, the event-by-event (E-by-E) studies of multiplicity fluctuations in high-energy collisions have much more attraction and also give more attention to recognize the dynamics of multiparticle production [13]. As it is already stated before that, the power law dependence of SFMs referred to as the intermittency [7,8] has been extensively used to investigate fluctuations and chaos in multiparticle production in high-energy hadronic and heavy-ion nucleus-nucleus collisions [14,15]. On the basis of E-by-E the values of scaled factorial moments,
  , are envisaged to help disentangle some interesting and very much useful informations about the chaotic behaviour of multiparticle production. A few moments of
  distribution, for example, the normalized moments
  are likely to serve the purpose. If
  shows a power law behaviour then such behaviour is referred to as erraticity [16,17]. It may be stressed that erraticity analysis would like into account simultaneously the spatial as well as the E-by-E fluctuations beyond the intermittency. Studies involving erratic fluctuations in hadronic and heavy-ion collisions, carried out so far [18,19] are not conclusive. It was, therefore, considered worthwhile to examine erraticity behaviour in relativistic nucleus-nucleus collisions. Attention is focused on the behaviour of erraticity exponents and erraticity spectrum, which are likely to provide maximum informations on self-similar fluctuations [16,17]. Hence in the present work an exercise has been made to perform the study of (E-by-E) spatial fluctuations of relativistic shower particles produced in the collisions of 28Si+Em at energy 14.6A GeV in 1-D and 2-D phase spaces of -variable. The findings are compared with the predictions of Ultra-relativistic Quantum Molecular Dynamics (UrQMD) model [20,21].
 2. Experimental Procedure
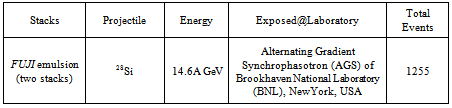
- The details of stacks of nuclear emulsion detector used in the present work are given in the Table 1. Some other relevant informations in about the dimensions of pellicles, incident flux of the beams, etc. are given in our earlier publications [22-25]. The dimensions of stacks used are the order of 16 10 0.06 cm3 and the quality of beam in terms of nature of incident beam flux is the order of ∼ 3.0103 ions/cm2. The emulsion used in the experiment is Fuji emulsion whose density, (ρ) is ~ 3.60 gram/cm3 for Fuji ET 7B. Generally, the density of Fuji emulsion is somewhat low in comparison with Ilford emulsion (ρ ~ 3.8 gram/cm3). The composition of the Fuji emulsion might change due to low density. It is appropriate to compare the results with Fuji emulsion only, but in literature no such result at different energies is available for comparison with this type of emulsion. Therefore, it is not possible to study any change in the results due to different compositions in the emulsions.
|
2.1. Angular Measurements
- The line scanning method was adopted to pick up events of interest, which was carried out using Japan made NIKON (LABOPHOT and Tc-BIOPHOT) microscopes with 40X objectives and 10X eyepieces. By measuring directly projected angle (θp) with the help of “Gonio-meter” of microscopes and dip (up/down) with the Z-motion of microscopes first we have calculated dip angle (θd) and then we get the space angles (θs) for each track by calculations.
2.1.1. Projected Angle (θp)
- To measure the space angle of a track with respect to the primary direction, its projected angle (θp) in X-Y plane (i.e. plane of emulsion) with respect to the primary direction was measured. The projected angle was directly measured with the help of gonio-meter of microscope having a least count of 0.25 under high magnification power. The vertex of the star (event) was focused at centre of crosswire of gonio-meter and then the secondary tracks were aligned one by one with the other reference line and the gonio-meter reading was taken for the projected angle θP with respect to the forward direction of primary particle.
2.1.2. Dip Angle (θd)
- The angle between the directions of emitted particle with X-Y plane is known as dip angle and represented by θd. If ΔZ is the difference between the Z-coordinate at two points on the track separated by a distance ΔX, then the dip angle θd of a track in the unprocessed emulsion was calculated and the dip angle is generally written as:
 | (1) |
2.1.3. Space Angle (θs)
- The angle of emission of a particle is determined by finding the space angle (θs) of the corresponding tracks with respect to the primary. Since the direct measurement of the space angle is not possible, therefore knowing the projected angle (p) and the dip angle (d) of particular track, one can easily, determines its value by the following relation [22-25]:
 | (2) |
 | (3) |
 | (4) |
2.1.4. Azimuthal Angle ( )
)
- In order to study the intermittency, multifractality, anisotropic flow and other related phenomena in relativistic nuclear collisions in two dimensions, the measurement of azimuthal angle is taken into account. This is the angle between the projections of secondary track in the Y-Z plane with respect to Y-axis. The azimuthal angle,
 , is determined by the following relation:
 | (5) |
2.2. Rapidity Variable
- Study of the angular characteristics of the relativistic charged particles produced in high-energy heavy ion collisions are carried out in terms of rapidity variable ‘Y’ of relativistic charged secondaries. The rapidity (Y) of a shower particle in the laboratory frame is defined as:
 | (6) |
 are respectively the total energy and longitudinal momentum of the outgoing particle in the lab frame. At high energies,
  , where m and
  respectively denote the mass and transverse momentum of the secondary particle. The expression for rapidity reduces to:
 | (7) |
 is the angle of emission of the shower particles in the laboratory frame with respect to the direction of the primary tracks,
  is termed as pseudorapidity of the particles. It has been found that it is not always possible to measure the energy and momentum of a particle experimentally and hence the rapidity distribution and other related topics are generally studied in terms of pseudorapidity variable,
  , instead of the rapidity variable, Y. Using the technique of erraticity moments,
  , this analysis has been taken out for three samples of total data of 951 events from the total events 1255 to understand the dependence of the erratic behaviour on the mean multiplicity of relativistic shower particles. Some low multiplicity events have been excluded due to statistical noise. And also the interactions due to beam tracks making an angle < 2° to the mean direction and lying in emulsion at depths > 35 μm from either surface of the pellicles were included in the final statistics. For this purpose all the necessary mathematical tools regarding the erraticity moments, we will be explain in the next section.
2.3. Classification of Tracks
- All charged secondaries in these events were classified, in accordance with the emulsion terminology, into the following groups [26]:(i) Black track producing particles (Nb):Tracks with specific ionization g* >10 (g* = g/g0, where g0 is the Plateau ionization of a relativistic singly charged particle and g is the ionization of the charged secondary) have been taken as black tracks. These correspond to protons of relative velocity β < 0.3 and range in emulsion L < 3.0 mm.(ii) Grey track producing particles (Ng):Tracks with specific ionization 1.4≤ g* ≤10 corresponding to protons with velocity in the interval 0.3 ≤ ≤ 0.7 and range L 3.0 mm in nuclear emulsion are called grey tracks.(iii) Shower tracks producing particles (Ns):Tracks with specific ionization g* < 1.4 corresponding to protons with relative velocity β > 0.7 are classified as shower tracks. These tracks are mostly due to relativistic pions with small admixture of charged K-mesons and fast protons.
3. Mathematical Tools
- In order to perform a meaningful analysis of chaoticity, normalized cumulative variables,
 and
and  were used to reduce the effect of non-uniformity in single charged particle distributions. To get the new variables
  and
and , the values of pseudo rapidity
  of relativistic shower particles in present nuclear collisions were used in two different phase spaces (
 -space and
  -space or azimuthal plane). The
  variable is for the rapidity values in
  -space and the same
  is azimuthal angle values so called
  -space. In terms of new scaled variables,
  and
and , the single particle density distribution is always uniform in between X= 0 and 1 and both “vertical” and “horizontal” averaging of scaled factorial moments should produce the same result. The cumulative variable in the phase space (say
 ) is defined as [27]:
 | (8) |
 is the single particle pseudorapidity density of shower particles and
  is the minimum (maximum) value of
  . Similar relation as Eq. (8) was used to calculate
  . Though our entire analysis on scaled factorial moments will henceforth be performed taking
  as the basic variable, we shall continue to call the corresponding space
  -space.Various experimental efforts have established the existence of the empirical phenomenon of “intermittency” in multiparticle production using normalized scaled factorial moments. On the basis of bin averaging the normalized scaled factorial moments of the order of q is defined in vertical form as:
 | (9) |
 | (10) |
 , and also bracket
  of Eq. (10) indicates the average over all events in the whole data sample.Using the normalized scaled factorial moments,
  an increasing trend in non-statistical self-similar fluctuations with decreasing bin size is representation of an intermittent behaviour, which leads to a power law expressed by:
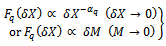 | (11) |
 is the intermittency exponents, and
  is bin size, which is defined as:
  or
or 
 .This analysis in a single phase-space dimension in
  and spaces respectively was extended to two dimensions
  -space. In order to use above formulism in two dimensions, a rectangle in the
  -space was considered, which was divided into
  bins of each size
  with
with  , where the sum now extends over
  bins in Eqs. (10-11) and
  is the number of particles in the
  bin in the
  -space. The pseudorapidity interval,
  , is divided into M bins of uniform width
  .Recently, Cao and Hwa [16] first introduced to measure the spatial pattern of particles in an event using normalized factorial moments associated with it. In contrast to the horizontally averaged vertical moments,
  and vertically averaged horizontal moments,
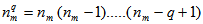
  of the qth order, they define event factorial moments as:
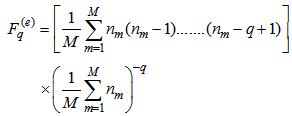 | (12) |
 , fluctuates from event-to-event, and the degree of fluctuation can be estimated from the probability distribution
  over all events. One can obtain a distribution
  for the whole sample of events. In the given situation, a normalized factorial moment of a single event is defined as:
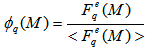 | (13) |
 | (14) |
 is the number of events in a sample and
  represents the event factorial moment describing the spatial pattern of an event. It is important to mention that the SFMs introduced to study the intermittency or fractality in multiparticle production is only an estimate of the mean of the distribution
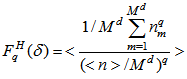
  . It should be realized that the simple mean procedure, apart from its clear advantages, suppresses a lot of important information about the fluctuations of spatial patterns of final state of multiparticle production. In particular, some interesting effects present only in a part of sample of events produced in high-energy collisions, may be lost. A possible example of this kind is the quark-gluon plasma. In order to quantify the degree of the fluctuations, a new normalized moment related to the chaotic nature of the system is defined as [16,17,19,28]:
  | (15) |
 exhibits a power law dependence on the number of bins M as:
  | (16) |
 is called the erraticity exponent and is obtained from the slope of graph plotted between
  vs.
vs.  . The information contained in the scaling function
  can be alternatively displayed through the entropy index,
  , which is given by [29,30]:
 | (17) |
 at
at  also describes the width of the fluctuation. It has been shown by Z. Cao et al., [29,30] that the entropy index,
  , can be used as a measure of chaoticity in the systems, where only the spatial patterns could be observed and the presence of chaos in the system could be experienced for positive value of
  .The new parameter which is related to
  , defined in the event space and is also known to the entropy as given:
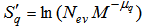 | (18) |
 is the number of events. Eq. (18) tells us that on increasing the value of entropy index,
  , i.e., the event-by-event fluctuations of the scaled factorial moments, the values of
  will decrease. For better understanding of this postulate, Hwa [16,19, 29-30] gave an illustrative example. One can consider two extreme cases: (a) if
  is the same for every event, then
  ; (b) if only one event has
  , and
, and  in all others, then
  . Thus, case (b) is more ordered in the event space than (a), that is, it is more disordered to spread out an observable (
 in this case) over all events than to confine it to a few events having non-zero values (analogous to the increase of entropy of an expanding gas). Thus,
  decreases when there is more events with
  , signifying more order in the event space. From Eq. (17), it is now obvious thus
  is a measure of that decrease which in turn implies more fluctuation in
  .
.4. Analysis and Results
4.1. Frequency Distribution of Single Event Factorial Moments
- The frequency distributions of single event normalized scaled factorial moments,
 has been shown in Fig. 1 (a-c) in
 ,
,  and
and  - phase spaces respectively. The above calculation has been performed for the number of bins M = 2-30 in the interactions of 28Si nuclei with nuclear emulsion at 14.6A GeV along with UrQMD prediction. The entire range of values of single event factorial moments for a particular partition number M has been divided into a number of smaller groups, and the frequency distributions are obtained. Though majority of the values of
  are confined within a limited range, large values of
  are also encountered in significant numbers in each case. It tells us that, these fluctuations in event space can be quantified in terms of the erraticity moments and can be related to the chaotic nature of multiparticle production phenomena and/or its dynamics.
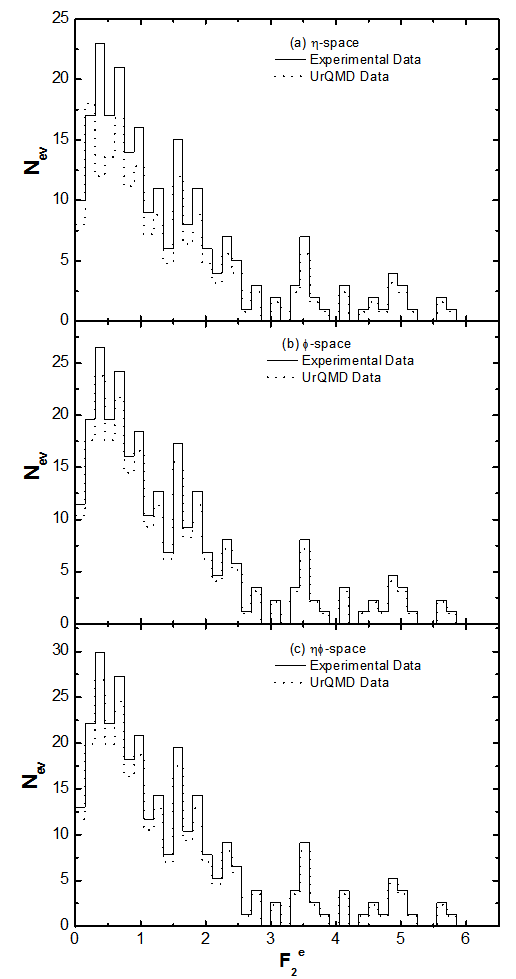 | Figure 1(a-c). Frequency distribution of single event factorial moments for M = 2-30 and q = 2 in the collisions of 28Si+Em at energy 14.6A GeV |
4.2. Dependence of  on
on 
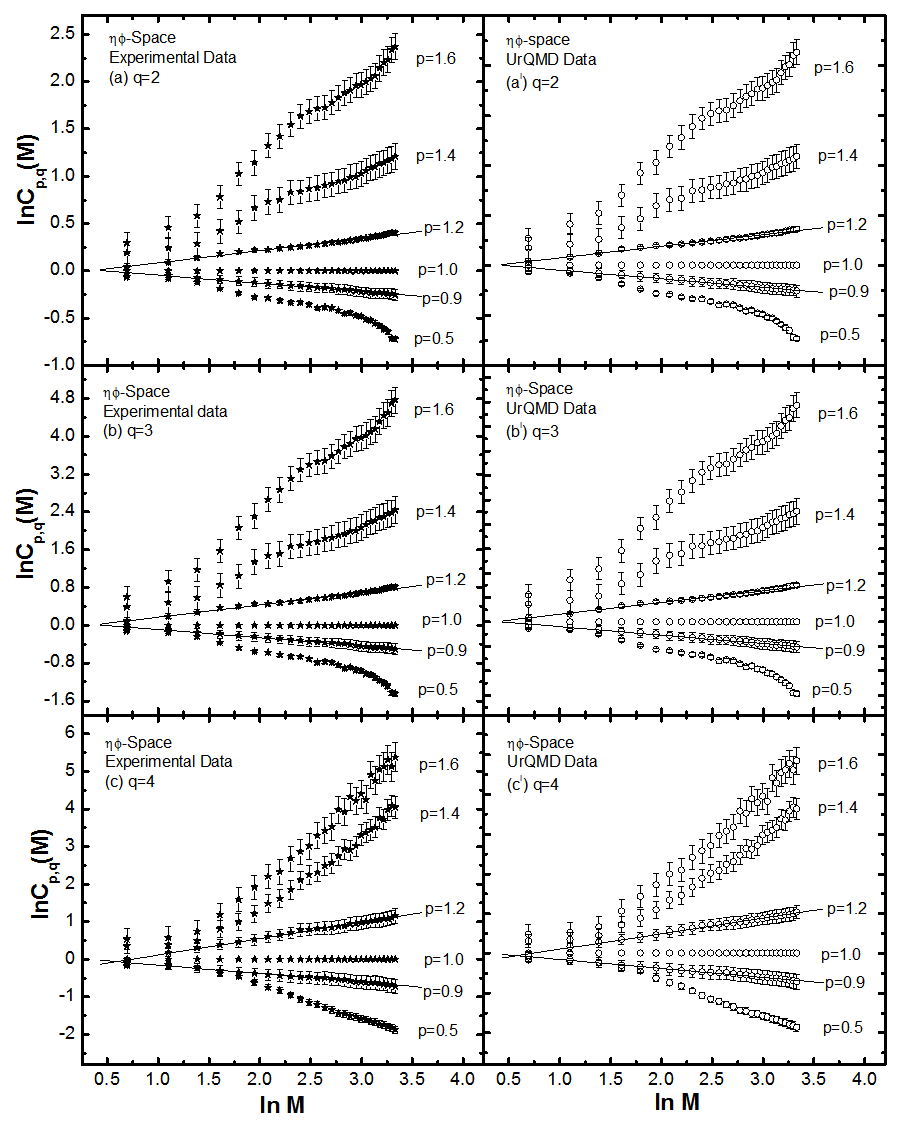
- The erraticity moments,
 , have been calculated with the knowledge of relation (6) for order of moments q = 2-4, and for p = 0.5, 0.9, 1.0, 1.2, 1.4 and 1.6 for the present experimental data of nucleus-nucleus collisions. The findings in the forms of the pictorial graphs have been plotted between the natural log of normalized erraticity moments
  as a function of
  in Figs. 2 (a-c) to 4 (a-c) for
  ,
,  and
and  - phase spaces respectively at energy 14.6A GeV. For the sake of comparison purpose the plots of corresponding UrQMD predictions are also shown in the same figures. From these graphs one may conclude the following:It is evident that the erraticity parameters can all be derived from the variation pattern of the erraticity moments in the neighbourhood of
  , the analysis has been performed and the plots are shown only for that regime. In general, a non-linear dependence of
  with
with  can be observed, a feature that is more prominent for moments with
  than for moments with
  . For higher values of order of moments and for
  , saturation effects in the values of
  , could be seen from Figs. 2 (a-c) to 4 (a-c) in the higher M region. This feature can be attributed to a finite number of particles in an event, because with increasing bins lesser number of events contributes to the higher order of q. A few kinks are seen in these plots, which are probably due to large E-by-E fluctuations in a particular bin. For each order of moments, q, the type of errors are standard statistical, which are due to E-by-E fluctuations of the SFMs associated with experimental data points and are shown only for the maximum and minimum values of p. The simulated data using UrQMD prediction show the same pattern as experimental data. The dependence of
  as a function of
  for UrQMD is high and low similar to that of the experiment, but the magnitudes of erraticity moments are always significantly less in comparison to the experimental values.
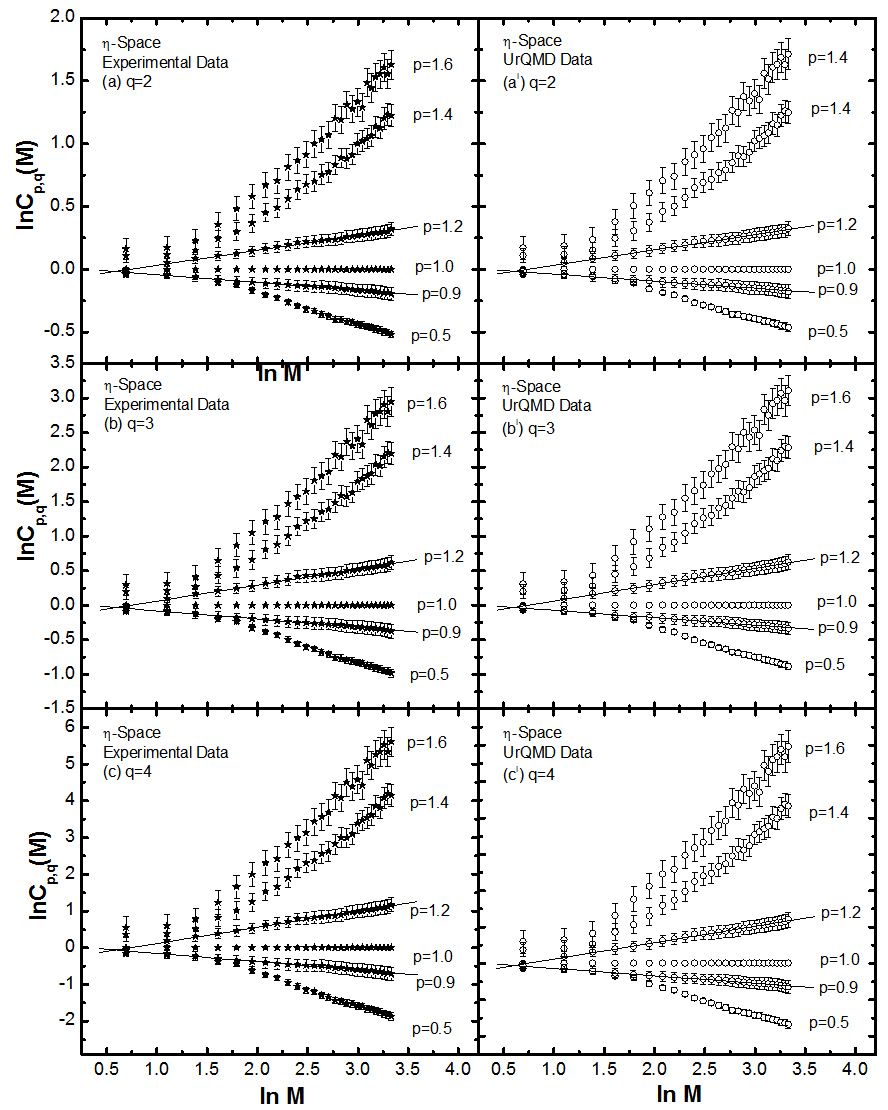 | Figure 2(a-c). Variations of lnCp,q(M) as function of ln M in η-space (1D) in the collisions of 28Si+Em at energy 14.6A GeV |
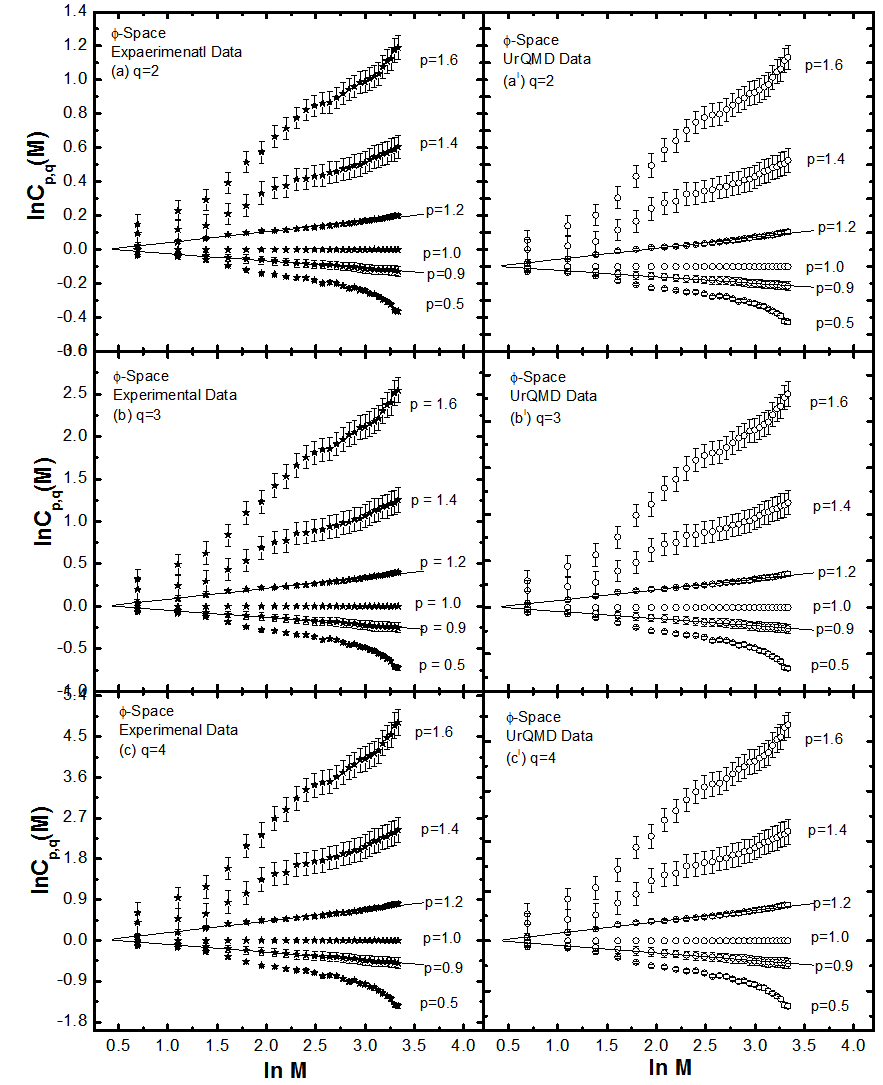 | Figure 3(a-c). Variations of lnCp,q(M) as function of ln M in -space (1D) in the collisions of 28Si+Em at energy 14.6A GeV |
 | Figure 4(a-c). Variations of lnCp,q(M) as function of ln M in η-space (2D) in the collisions of 28Si+Em at energy 14.6A GeV |
4.3. Nature of Erraticity Exponent 
- The spatial fluctuations on E-by-E multiplicities are more prominent than the fluctuations on the bin-by-bin multiplicity. So the linear dependence of erratic moments,
 on
on  has been assumed in spite of the non-linearity observed from a graphical representation of the present experimental data. By making a linear fitting in Figs. 2 to 4 for p = 0.9 and 1.2, the values of erraticity exponents,
  have been obtained for q = 2-4. With the knowledge of
  , the values of entropy index,
  has been calculated for the total data in
  ,
,  and
and  phase spaces along with UrQMD prediction. These values are depicted in Table 2. The values of
  in
in  -space are consistently higher than its value in
  -space. It is also observed that the entropy index is not independent of the phase space variable. The values of
  in
in  -space are even higher than its value in η and
  -space. The values of
  in all spaces using the UrQMD predictions are much less than experimental values. This indicates that the erraticity effect is more effective in
  -space rather than in
  or
or  phase space. The observation of experimental results clearly supports a stronger chaoticity in
  -space. With the help of the slopes of Figs. 2 (a-c) to 4 (a-c) and according to the Eq. (9), the erraticity exponent,
  for p = 0.9 and 1.1 have been obtained and shown in Table 2. To measure the degree of event-by-event fluctuation in the analysis of event factorial moments,
  , for q = 2-4, the values of entropy index,
  , are calculated with the knowledge of Eq. (10) and are also depicted in Table 1. It is evident from the table that
  increases with q for present data and UrQMD predictions in
  ,
,  phase spaces, whereas; in
  space the difference in the values of
  are more. These values of entropy indices,
  , for q = 2-4 are in good agreements with the results reported by other workers [28-30].
|
 and entropy index,
  , in the collisions of 28Si+Em at energy 14.6A GeV along with UrQMD prediction
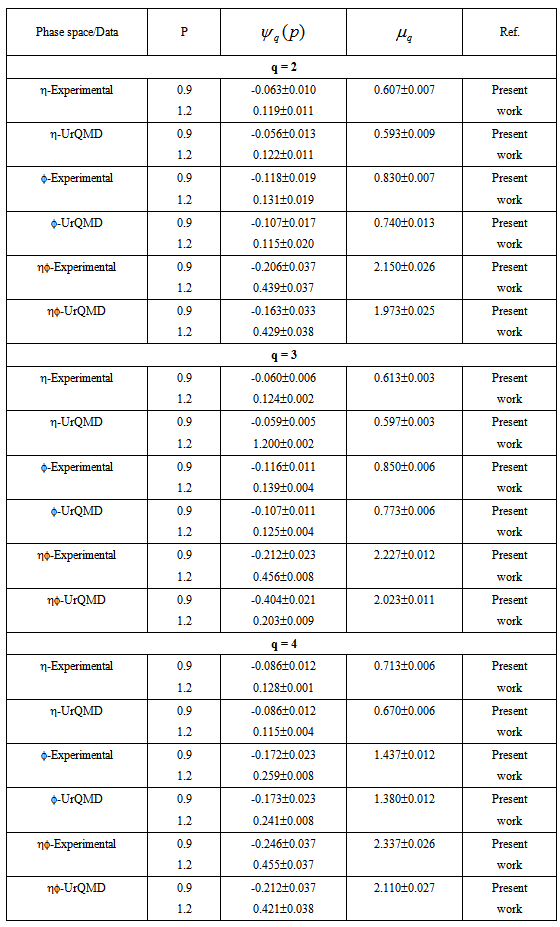
 , have been plotted as a function of order of moments, q, in Fig. 5 (a-c) for total experimental data along with the UrQMD data. It is inferred from the figure that the values of
  , increase with the order of q for total data and UrQMD data in
  ,
, and
and  spaces. It also follows that the pattern of variations of
  with q observed experimentally are nicely reproduced by UrQMD data in
  and
and  spaces, whereas in
  -space the difference between two values are more. Since higher values of
  corresponds to smaller entropy and show more chaotic behaviour. [33] It may be concluded that the present experimental data clearly exhibits the chaoticity in multiparticle production in nucleus-nucleus collisions at high energies. Similar results are reported by other workers[28-32].
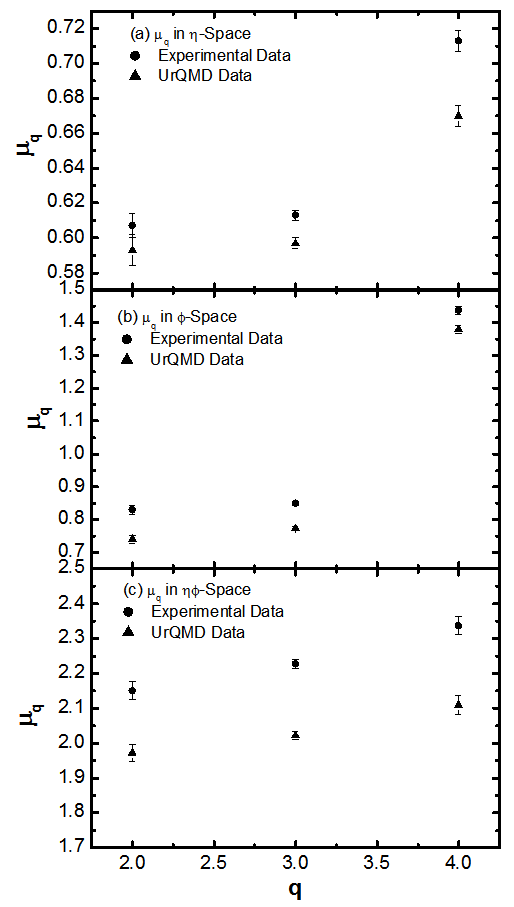 | Figure 5(a-c). Variation of entropy index, μq, as a function of q for the collisions of 28Si+Em at energy 14.6A GeV in η, and η phase spaces respectively |
5. Conclusions and Final Remark
- Some significant results have been obtained from the analysis of event-by-event fluctuations of produced charged particles in heavy ion collisions at 14.6A GeV. One can draw the following conclusions on the basis of present work: Our experimental results exhibit the power law behaviour of normalized moments,
 , which indicates the erratic fluctuations. The variation of
  with q agrees with the predictions of UrQMD model in
  and
and  -spaces (1D) and also
  -space (2D). This behaviour indicates chaoticity in the multiparticle production system. It is demonstrated that like multifractal spectral through the multifractal moments (
 -moments), erraticity spectrum may also be constructed, which will help to extract maximum information on self-similar fluctuations in nucleus-nucleus collisions at high and ultra-high energies. Erraticity may also give useful information regarding the entropy and chaotic nature of particle in heavy ion collisions. It is believed that these fluctuations may be a weak signal of QGP formation in such experiment. Further, evidence of these fluctuations has also been observed in low energy nuclear collisions, whereas the formation of QGP is not expected. Even in target fragmentation process, where the QGP phase transition is most unlikely, some physicists have reported evidence of dynamical fluctuations in earlier work. So far, QGP phase transition cannot be the only reason for the fluctuations observed in present experimental data. It may be possible that the observed fluctuations may have more remarkable explanation.
ACKNOWLEDGEMENTS
- We would like to express our thanks and appreciation to Professor Gurmukh Singh, Department of Computer and Information Sciences, SUNY at Fredonia, Fredonia, NY 14063, U.S.A. for providing the exposed and developed nuclear emulsion plates / stacks. And the author Dr. Mohammad Ayaz Ahmad also gratefully acknowledges that this work is supported in a part by Deanship of Scientific Research of University of Tabuk / Ministry of Higher Education, Kingdom, Kingdom of Saudi Arabia with project number S-1424-0035/15-02-1434 for the kind financial assistance.