A. I. Oludare1, M. N. Agu2, P. O. Akusu2, 3
1Nigerian Defence Academy, Department of Physics, Kaduna
2Nigeria Atomic Energy Commission, Abuja, Nigeria
3Ahmadu Bello University, A.B.U., Zaria, Nigeria
Correspondence to: A. I. Oludare, Nigerian Defence Academy, Department of Physics, Kaduna.
| Email: |  |
Copyright © 2012 Scientific & Academic Publishing. All Rights Reserved.
Abstract
Multiple regression analysis is applied on twenty-four (24) typical nuclear reactor design models, each having sixteen (16) major design input parameters. An empirical expression for “Safety Factor”, Ỳ, as a function of the sixteen major design input parameters is obtained. Further statistical analyses suggest that this empirical expression is acceptable as the calculated values of Ỳ is in good agreement with known typical values. 78.95% of the “Safety Factor”, Ỳ, is observed from the sixteen major design input parameters at significant level of 5%. This shows that the regression analyses techniques may be applied as an effective tool for optimization of the stability margin in nuclear power reactor design models.
Keywords:
Multiple regression analysis, twenty-four (24) typical nuclear reactor design models, sixteen (16) major design input parameters, safety factor, Ỳ, optimization, stability margin in nuclear power reactor design models
Cite this paper: A. I. Oludare, M. N. Agu, P. O. Akusu, Optimization of the Stability Margin for Nuclear Power Reactor Design Models Using Regression Analyses Techniques, Journal of Nuclear and Particle Physics, Vol. 3 No. 3, 2013, pp. 29-35. doi: 10.5923/j.jnpp.20130303.01.
1. Introduction
The nuclear power plant concept design process often embraces novel concepts and technologies that carry with them an inherent risk of failure in operation which may be due to their first-time application to energy generation of its kind or to the fact that their design concept are not well studied/understood. Some definitions of “risk” are given by Modarres[1], Molak[2] and Blanchard[3]; however, Wang[4] and Roush[5] define Engineering as “a profession of managing technical Risk.” It should be noted that “risk” is a physically measurable quantity. Wang and Roush define risk analysis as the quantification of potential failure. In nuclear industry risk is mostly taken as fear of accident occurring. The development of Ships, Aircrafts, Nuclear Power Plants and other System with risk factor implication pose concerns about their safety and this led to the development of the classical probabilistic risk analysis.In this work, Ordinary Least Square (OLS) methodology, which is largely used in nuclear industry for modeling safety, is employed. Some related previous works on the application of regression analysis technique include: “Stochastic Modeling of Deterioration in Nuclear Power Plants Components” by Xianxun Yuan[2007], “Polynomial Regression with Derivative Information in Nuclear Reactor Uncertainty Quantification” by M. Anitescu and co-workers [2009], and “Proportional Hazard Regression Models for Point Processes: An Analysis of Nuclear Power Plant Operations in Europe” by RAND[2011]. Others are, “Advanced Power Plant Modeling with Applications to the Advanced Boiling Water Reactor and the Heat Exchanger” by Prasanna Kumar Muralimanohar[2009],“Modeling Water Withdrawal and Consumption for Electricity Generation in the United States” Kenneth Strzepek et al,[2012] and Andrew F. Siegel[2002] Practical Statistic McGraw - HillThis work, “Optimization of the Stability Margin for Nuclear Power Reactor Design Models Using Regression Analyses Techniques”, provides an a mathematical expression for predicting “Safety Factor”, Ỳ, (dependent variables) given the values of independent variables or input parameters for any nuclear reactor design model. Moreover, the mathematical expression can also be used to determine the contribution of each parameter (independent variables) to the nuclear reactor stability, given the value of dependent variable.
2. Research Approach
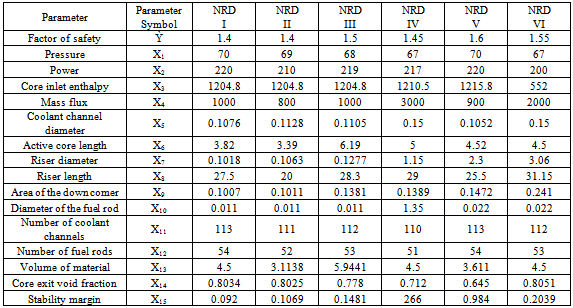
A general assessment of twenty four (24) typical nuclear reactor design models, each having sixteen major input parameters was done. The major input parameters, which are the measurable materials or measurable components in the design models of nuclear energy reactor include: Pressure, Power, Core-inlet enthalpy, Mass flux, Channel coolant diameters, Active core length, Riser diameter, Riser length, Area of the down comer, Diameter of the fuel rod, Number of fuel rods, Volume of materials, Core exist void faction, Number of coolant channels, Safety margin and Safety factor. The twenty four (24) typical nuclear reactor design models are coded: NRDI to NRDXXIV which stands for ‘Nuclear Reactor Design I’ to ‘Nuclear Reactor Design XXIV’. For each of these different design models, a linear regression analysis technique is applied using statistical software, NCSS (Number Cruncher Statistical Software). Furthermore, for the combined twenty four design models, a multiple regression analysis technique is also applied using the NCSS. The results give a model equation for each of the different design models and a general model equation for the combined twenty four designs which can be used to make prediction on the reactor stability in the design concept of each design and the combined twenty four designs. In Table 1a -1d, the values of the 16 major input parameters for the 24 nuclear reactor design models are presented:Table 1a. NRDI - NRDVI: The Values of 16 Major Input Parameters of 24 Typical Nuclear Reactor Design Models
 |
| |
|
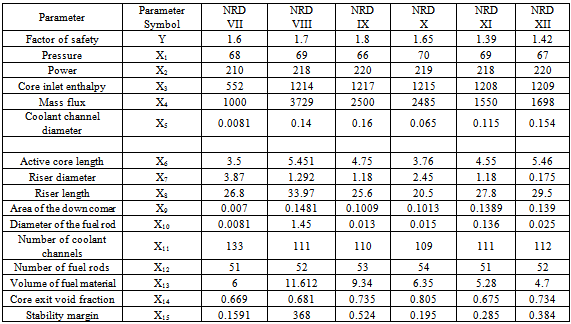
Table 1b. NRDVII -NRDXII
 |
| |
|
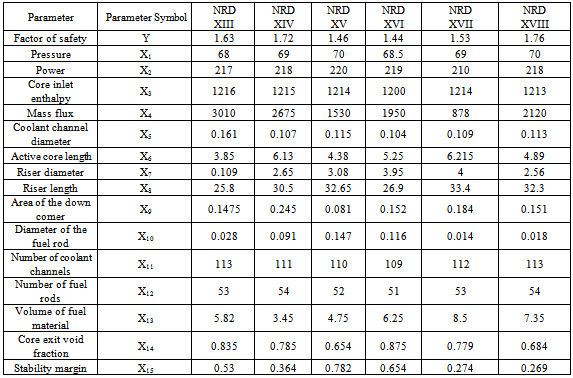
Table 1c. NRDXIII -NRDXVIII
 |
| |
|
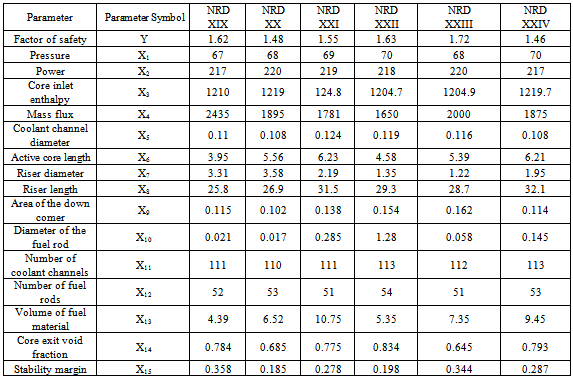
Table 1d. NRDXIX -NRDXXIV
 |
| |
|
In order to evaluate the models, the following tests were carried out as applicable to multiple regression analysis: Ø F-test which is the overall test of the designsØ t-test which is the test of the individual design Ø Autocorrelation (whether a present error(s) is/are dependent on the last error(s))Ø Testing the significance of regression coefficients, bi (i.e. the contribution or effect of each design input parameter on the reactor stability, assuming all other parameters are held constant).Ø Check for systematic bias in the forecast (where the average error is zero)Ø Normality test.
3. Results and Analyses
The results of the application of multiple regression analysis performed on the sixteen (16) major input parameters of twenty four (24) nuclear reactor design models contained in Table 1a-1b are presented as follows: This regression analysis was carried out with the use of statistical software known as Number Cruncher Statistics Software (NCSS).
3.1. Empirical Expression for Safety Factor, Ỳ
An empirical expression for the “Safety Factor”, Ỳ, as a function of the stipulated input parameters, Xi: I = 1,2,3,…,15, was obtained as: | (1) |
Where 0.3263 is a constant, the Xi’s represent major component design parameters of the nuclear power reactor design models as presented in Table 1a-1d. Equation (1) is an important design empirical equation which can be used to predict the value of the safety factor, Ỳ, from given values of Xi, which are the independent variables. Equation (1) can also be used to determine the contribution of each component Xi to reactor stability, given the value of Ỳ.
3.2. Multiple Regression Report on NRDI to NRDXXIV
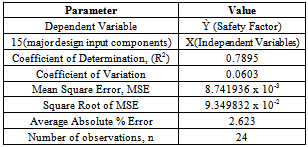
Here, F-test and t-test are employed to ascertain the validity of the model expressed mathematically in equation (1).(I) F-test Result (test of all the design models)The summary of the F-test report on the twenty four (24) nuclear reactor design models, NRDI to NRDXXIV, is presented in Table 2.Table 2. Summary of F-test Statistical Data on NRDI to NRDXXIV
 |
| |
|
Table 2 gives the coefficient of determination, R2, of the model which indicates goodness-of-fit of the regression and also indicates the percentage of the variation in Ỳ that could be accounted for by the sixteen (16) X variables. In this work, it is observed that 78.95% of the Safety Factor, Ỳ, could be accounted for by this sixteen (16) major input parameters, X; while, perhaps 27.05% could be explained by other factors.Siegel (2002) has shown that R2 can be used to test the validity of a model. A value of R2 = 0.7895 or 79% is obtained for the model equation (1) in this work. This is higher than the threshold value of R2= 0.673 or 67.3% for n=24 and k = 1,2,3,…,15, and promises an acceptable level of validity. Thus this model equation is significant at the given significant level of 5%.(II) t-test Result (test on the input parameters or independent variables)Table 3. t-test Statistical Data
 |
| |
|
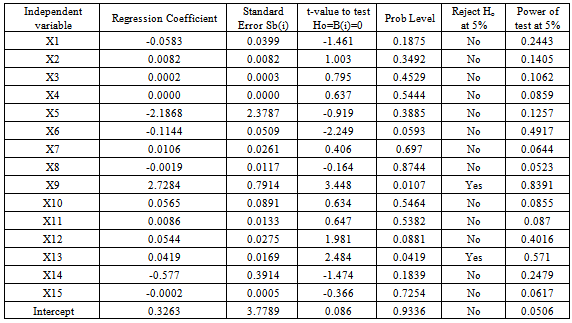
Table 3 below shows the values of the regression coefficients, b(i), and the t-values for every independent variable (input parameters), Xi. This gives the validity or acceptability of each of the input parameters (independent variables).Table 3 is used to investigate the contribution or the effect of each design input parameter, Xi, on the safety factor of the nuclear reactor design models, assuming all other parameters are held constant,. figure is the graphical representation of the t-value as a function of the major input parameters, Xi: i = 1,2,3,…,15.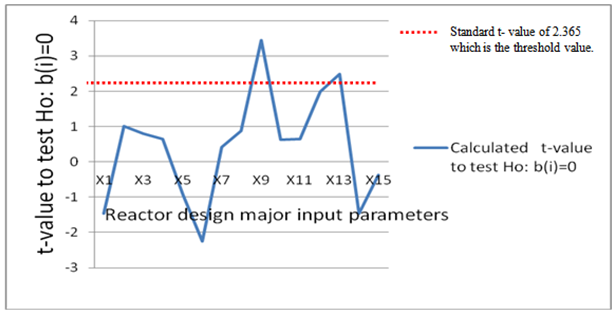 | Figure 1. t-value as a function of the reactor design major input parameters |
From Table 3 and Figure1, it could be seen that two parameters, the area of down comer, X9, and the volume of the fuel material, X13, have calculated t-values of 3.448 and 2.484 respectively, each being higher than the t-value of 2.365 which is the threshold value for the acceptability of the developed model. For acceptability, it is required that at least one of the t-values of the input parameters exceeds the threshold value; therefore, the developed model equation is acceptable by this t-test.Furthermore, the graphical representation of the regression coefficient, bi, as a function of the major input parameters, Xi: i = 1,2,…,15, is shown in Figure 2,: | Figure 2. Regression coefficient, bi, as a function of the reactor design major input parameters |
Since at least one value of bi is not equal to zero (0) i.e since the value of the regression coefficient, bi, for X9 is significantly greater than zero, the model could be accepted as being valid. Moreover, it suggests that the major input parameters or components, Xi, are linearly related to the Safety Factor, Ỳ.
4. Comparison of Safety Factor (Ỳ) Values
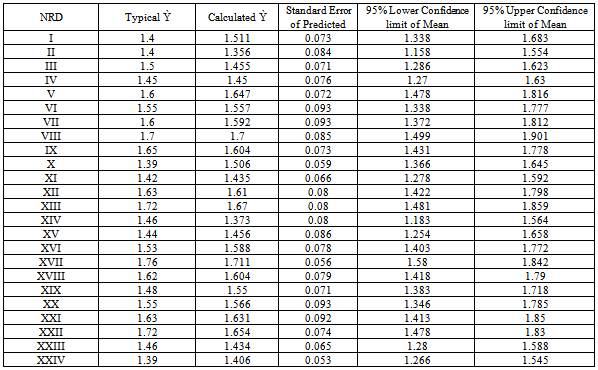
In Table 4 the typical Safety Factor values as well as the calculated Safety Factor values obtained are presented for comparison.It could be seen, by inspection of the Table 4, that the calculated values of the Safety Factor, Ỳ, generally agree with those of the typical Safety Factor, Ỳ, values.The plot in Figure 3 demonstrates clearly the agreement between the typical values of the Safety Factor (Ỳ) for the twenty four nuclear energy reactor design models and the calculated results on Safety Factor (Ỳ). Figure 3: clearly validates the use of the empirical expression given in Equation (1) for the calculation of Safety Factor, Ỳ.Table 4. Comparison of Typical and Calculated Safety Factors, Ỳ
 |
| |
|
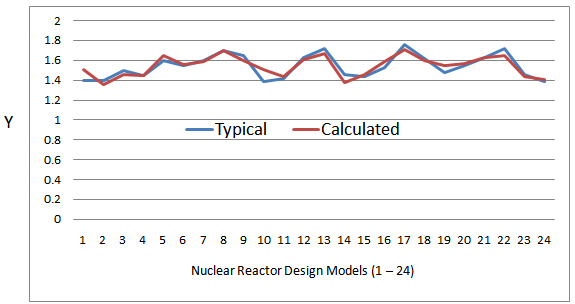 | Figure 3. Comparison of typical Safety Factor , Ỳ values with corresponding calculated Safety Factor , Ỳ values |
5. Summary / Conclusions
Multiple regression analysis has been applied on twenty-four (24) typical nuclear reactor design models, each having sixteen (16) major design input parameters. This produced an empirical expression for “Safety Factor”, Ỳ, as a function of the sixteen major design input parameters. F-test and t-test carried out on this model equation gives a promising level of acceptability or validity with the calculated values of Ỳ being in good agreement when compared to the known typical values. 78.95% or 79% of the “Safety Factor”, Ỳ, is observed from the sixteen major design input parameters, X; at significant level of 5%, while, perhaps 27.05% could be explained by other factors. Also, the empirical formular derived can be applied to any nuclear power reactor design model to test stability of the reactor as well as the contribution of each design component to the stability of the reactor.This shows that the regression analyses techniques may be applied as an effective tool for optimization of the stability margin in nuclear power reactor design models.
ACKNOWLEDGMENTS
We thank Nigerian Defence Academy (NDA), Kaduna, Nigeria for the material support during the research work.
References
| [1] | Modarres, M.1993. What Every Engineer Should Know About Reliability And Risk Analysis. Marcel Dekker, New York. |
| [2] | Molak, V. 1997, Fundamentals of Risk AC press, Lewis Publishers, Boca Raton. |
| [3] | Blanchard, B.S. 1998, System Engineering Management, John Wiley & Sons, New York. |
| [4] | Wang. J.X. and M.L. Roush. 2000. What Every Engineer Should Know About Reliability And Risk Analysis. Marcel Dekker, New York. Pp.3,4,11,13,15,47,50-52,55-59,69,77,81-95,122,137,139,143. |
| [5] | “Xianxun Yuan 2007. Stochastic Modeling of Deterioration in Nuclear Power Plants Components”. |
| [6] | M. Anitescu, O. Roderick, P. Fischer, W.S. Yang 2009. “Polynomial regression with derivative information in nuclear reactor uncertainty quantification”. |
| [7] | RAND, Santa Monica, CA. 05 June 2011. “Proportional hazard regression models for point processes: an analysis of nuclear power plant operations in Europe” Journal of Applied Statistics, Version of record first published in 05 June 2011. |
| [8] | Prasanna Kumar Muralimanohar 2009. “Advanced power plant modeling with applications to the advanced boiling water reactor and the heat exchanger”. |
| [9] | Kenneth Strzepek, Jonathan Baker, William Farmer and C. Adam Schlosser (June 2012). “Modeling Water Withdrawal and Consumption for Electricity Generation in the United States” Report No. 221, June 2012. |
| [10] | Andrew F. Siegel 2002 Practical Statistic McGraw – Hill 49. |
 Abstract
 Reference
 Full-Text PDF
 Full-text HTML