-
Paper Information
- Next Paper
- Previous Paper
- Paper Submission
-
Journal Information
- About This Journal
- Editorial Board
- Current Issue
- Archive
- Author Guidelines
- Contact Us
Journal of Nuclear and Particle Physics
2012; 2(4): 98-100
doi: 10.5923/j.jnpp.20120204.04
Investigation of Poloidal Phase Velocity of Floating Potential Fluctuations in the IR-T1 Tokamak Edge Plasma
 Abstract
 Reference
 Full-Text PDF
 Full-Text HTML
H. Abdolalizadeh 1, M. Ghoranneviss 1, R Shariatzadeh 2
1Plasma Physics Research Center, Science and Research Branch, Islamic Azad University, Tehran, Iran
2Department of Physics, Islamic Azad University, Kashan Branch, Kashan, Iran
Correspondence to: R Shariatzadeh , Department of Physics, Islamic Azad University, Kashan Branch, Kashan, Iran.
| Email: |  |
Copyright © 2012 Scientific & Academic Publishing. All Rights Reserved.
Tow pairs of poloidally spaced and radially movable Langmuir probes were used for measuring ion saturation current and floating potential in the edge plasma of IR-T1 Tokamak. Radial profile of the floating potential, it’s gradient , that is proportional to radial electric field Er ,and phase velocity of plasma fluctuations are determined. Results show that there is a naturally occurred velocity shear layer in the proximity of the last closed flux surface.
Keywords: Fluctuation, Phase Velocity, Langmuir Probe, Tokamak Plasma, Floating Potential, Ion Density
Article Outline
1. Introduction
- Study of plasma turbulence is essential for particle and energy confinement, since it is believed that plasma turbulence is the main cause of cross-field anomalous transport in magnetically confined plasma.[1] So, high losses of particle and energy are due to turbulence in the Tokamak edge plasma. Therefore, understanding of the phenomena occurring in the plasma edge is essential in order to rich particle and energy confinement.Among the different methods of plasma diagnostics, the Langmuir probes are the most reliable diagnostic tools allowing to measure edge plasma parameters withsufficiently high temporal and spatial resolution.In this paper, we present measurement of the radial profile of floating potential, ion density and poloidal phase velocity of the turbulence structures in the IR-T1 Tokamak plasma edge.
2. Method of Measurement
- The experiments were conducted on the IR-T1 Tokamak [2]. The IR-T1 is a small, air core Tokamak without copper shell and circular cross section plasma. The major radius is 45cm, the minor radius is12.5cm, the toroidal field (Bt) less than 1T, the plasma current (Ip) is about 40kA, the plasma discharge duration less than 40ms and ne~ni~ (0.7-3)×1013cm-3 . The IR-T1 diagnostics comprised Electron Cyclotron Emission (ECE), soft X-Ray, HCN Laser, Visible Spectroscopy, Mirnov Coils and Langmuir Probes.Basically, the electric probe consists of one small metallic electrode inserted into the plasma. In a single probe configuration (which is used in this paper), an array of probes are fabricated and inserted into the plasma to provide local measurements of the ion saturation current, floating potential and its fluctuations. This array consist of four single Langmuir probe, two sets of two probe each, mounted on a movable shaft and placed in the poloidal direction on two poloidal surfaces. To avoid shadowing on each other, the two probes located in the first surface are shorter in length than the other two probes located in the second surface (figure 1). Each probe tip (that is made of tungsten) is 0.6 mm in diameter and 3mm in length. In order to protect tungsten from the plasma, except for a short length of exposed tip, the rod is threaded into a thin ceramic tube. The distance between two probes at each surface is 2.6 mm.
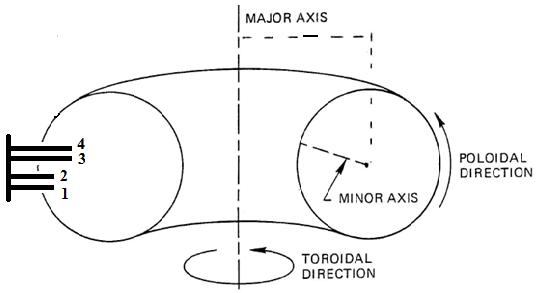 | Figure 1. The probe array configuration |
3. Experiments and Results
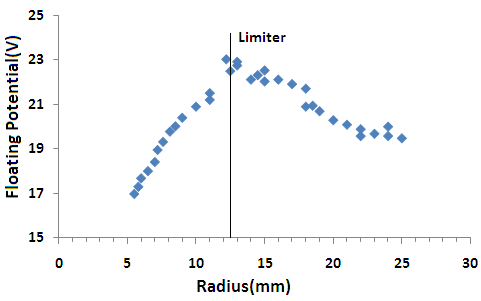
- The array of probe is connected to the power supply that has two modes of operations. In order to obtain ion density (ni) on the all four pins, the power supply was set up using the first mode. In the first mode (Ion Saturation Current measurement), by applying negative voltages we reach to Ion Saturation Current in less than -60V. According to the relation between Ion Saturation Current and ion density, ni can be determined. Figure (2) shows radial profile of ion density. Now, in the other mode (floating potential measurement) without applying any voltage to pins, floating potential is measured. Figure (3) shows the radial profile of this parameter. The maximum of the floating potential, corresponds to the position of the last closed flux surface (LCFS).[3]As it is obvious from figure (3), the sign of the gradient of the floating potential change at LCFS. So, direction of the radial electric field (Er), corresponding to
 ,change at LCFS. In combination with the toroidal magnetic field, a
  rotation in poloidal direction is formed. Since the poloidal rotation direction change in edge (inside LCFS) and Scrape off layer (outside LCFS), hence a natural velocity shear layer (VSL) is formed. This phenomena is also observed in other tokamaks and stellarators.[4,5,6]
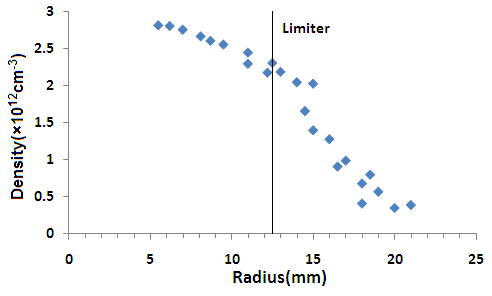 | Figure 2. Radial profile of ion density |
 | Figure 3. Radial profile of floating potential |
 Cross-correlation function of the two signals is employed to determine the time the turbulence structure takes to propagate from one probe to another.Figure (4) shows radial profile of poloidal velocity from floating potential. The position of the velocity shear layer (VSL) is corresponding to the position of the LCFS. Now, we consider if there is any influence of VSL and shearing rate on turbulence structure or not. By measuring sharing rate
 we have
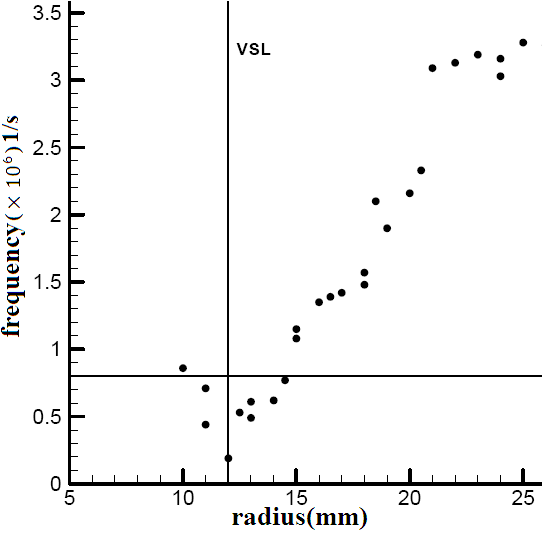
 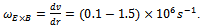 By means of autocorrelation function of signals, the characteristic frequency of plasma turbulence is determined. Figure (5) shows radial profile of the characteristic frequency of lifetime of the fluctuations. Comparing the shearing rate and characteristic frequency of turbulence show that shearing rate is slightly higher. So, this natural VSL has some impact on turbulent structure and reduce it.
 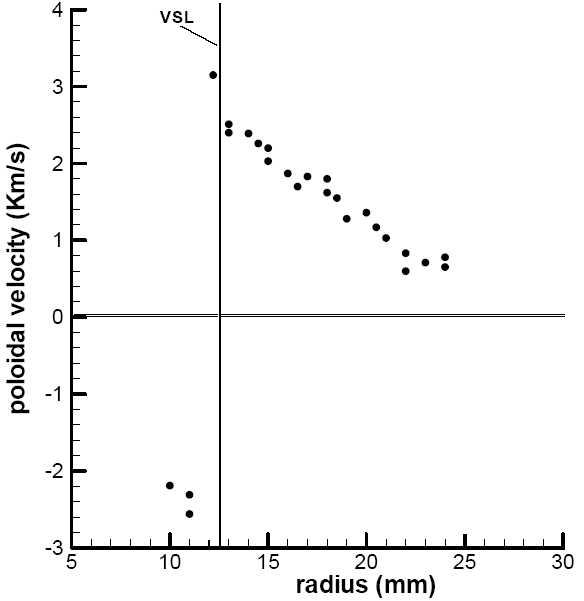 | Figure 4. Radial profile of the poloidal velocity |
 | Figure 5. Radial profile of the characteristic frequency of the fluctuations |
4. Conclusions
- In this paper, radial profile of ion saturation current (and so ion density) and floating potential is measured in the IR-T1 Tokamak edge plasma. The maximum of the floating potential corresponds to the position of the LCFS. As it is obvious from figure (3), the sign of the floating potential gradient (and so radial electric field) changes at the LCFS. Therefore in combination with strong toroidal magnetic field, a naturally velocity shear layer (VSL) is formed. The radial position of the VSL is agrees well with the radial position of the LCFS. The floating potential fluctuations are analysed using Fast Fourier-transform (FFT) technique and two pointcross-correlation technique. The cross-correlation is measured between two probes in the poloidal direction. Comparing the shearing rate in the proximity of the VSL and characteristic frequency of the plasma fluctuation show that the shearing rate is slightly higher, and so a reduction of fluctuation level at the VSL is occurred.
ACKNOWLEDGMENTS
- We are grateful to the IR-T1 Tokamak group for skillful technical assistance.