
-
Paper Information
- Paper Submission
-
Journal Information
- About This Journal
- Editorial Board
- Current Issue
- Archive
- Author Guidelines
- Contact Us
Journal of Mechanical Engineering and Automation
p-ISSN: 2163-2405 e-ISSN: 2163-2413
2026; 13(1): 24-32
doi:10.5923/j.jmea.20261301.03
Received: Sep. 4, 2026; Accepted: Sep. 25, 2026; Published: Sep. 29, 2026

An AI-Driven Graph-Based Architecture for Variant-Intensive BOM and Configuration Management in Passenger Seating Systems
 Abstract
 Reference
 Full-Text PDF
 Full-text HTML
Shuvdeep Bhattacharya
IT Director - Seating Engineering, Lear Corporation, 21577 Telegraph Road, Southfield MI 48033
Correspondence to: Shuvdeep Bhattacharya, IT Director - Seating Engineering, Lear Corporation, 21577 Telegraph Road, Southfield MI 48033.
| Email: |  |
Copyright © 2026 The Author(s). Published by Scientific & Academic Publishing.
This work is licensed under the Creative Commons Attribution International License (CC BY).
http://creativecommons.org/licenses/by/4.0/

Seat programs carry more configuration variability than almost any other vehicle subsystem, yet much of it never reaches the product structure. Color and trim content stays in illustration callouts, customer color-and-trim reports, and engineering-change records, so engineers read those documents, create or reuse an internal trim-color code, and hand the plant a spreadsheet, because product lifecycle management systems do not structure seat assemblies by color and plants cannot consume the engineering view directly. This paper proposes a graph architecture for that gap. One authoritative 150% engineering structure is held per seat family as a typed graph in which part usages, surface zones, color codes, features, plants, and revisions are separate nodes carrying bitemporal effectivity and provenance. Deriving a 100% engineering and manufacturing bill of material then becomes a resolution problem: deterministic predicates handle inclusion, exclusion, and cardinality; semantic closure carries implications a hierarchy cannot express; and a learned model scores the closed result and routes implausible configurations to engineering review with feature-level explanations. A versioned, plant-parameterized operator produces the manufacturing view. The paper contributes a seat-domain ontology, a resolution algorithm, and a measurable evaluation framework; validation is defined as a future instrumented pilot.
Keywords: Passenger seating systems, Bill of materials, Configuration management, EBOM-MBOM transformation, Knowledge graph, Variant management
Cite this paper: Shuvdeep Bhattacharya, An AI-Driven Graph-Based Architecture for Variant-Intensive BOM and Configuration Management in Passenger Seating Systems, Journal of Mechanical Engineering and Automation, Vol. 13 No. 1, 2026, pp. 24-32. doi: 10.5923/j.jmea.20261301.03.
Article Outline
1. Introduction
- A vehicle seat has to satisfy packaging, comfort, safety, feature, regional-market, and manufacturing requirements at once. Within one family, trim style, surface material, stitching, piping, hard- plastic color, comfort hardware, electronics, market content, and plant build strategy interact instead of varying independently, so a single family yields many buildable variants of which only a small subset is valid for a given vehicle line, model year, and plant. The theoretical end-product count is too large to hold as separate bills of material (BOMs), which is why mass-customization environments keep a generic superset structure [1], [5], and why variety is itself a cost driver [2]. Seat engineering has grown more quantitative over three decades [3], [4], but product- structure management has not kept pace.In production programs observed by the author at a Tier 1 seating supplier, assigning color to a part means moving between interior callout documents, engineering-change tabs, and PLM to establish which material applies where, then recording the answer in a form PLM will accept. A second workflow consolidates several customer color definitions from the color-and-trim report (CTR) into one internal trim-color code and rebuilds the result as a plant-facing spreadsheet, because the plant cannot read the engineering representation. Both depend on a few trim engineers who know each customer's conventions. The architecture proposed here holds one authoritative 150% engineering structure per seat family as a graph, with deterministic rules carrying documented constraints and machine learning recovering constraints never written down.A. ContributionsThe primitives used here are established: generic or 150% superset structures, predicate-based derivation, and ontology-linked configuration. No novelty is claimed for them. Three contributions are claimed. First, a seat-domain ontology in which SurfaceZone, ColorCode, MaterialFamily, and TrimStyle are constraining entities rather than part attributes, which makes color and trim logic computable. Second, treatment of document-sourced configuration semantics as a problem class of its own: configurator and product- line traditions assume configuration knowledge is authored inside the enterprise, whereas in seating much of it arrives from customers as documents that are late and repeatedly revised. What is claimed is the handling of extracted content as governing logic, carrying a confidence value and a provenance path. Third, a bitemporal view of that knowledge, with a resolution algorithm that keeps deterministic validation separate from learned assessment.B. Scope and AssumptionsFailure modes were identified from direct engineering and information-technology experience with production seating programs at a Tier 1 supplier, covering color-part configuration, EBOM-to- MBOM transformation, configurator variant-rule behavior, and change-impact analysis. Program, customer, supplier, and system identities are withheld, and no proprietary data or part numbers are included. No deployment results are reported. Five assumptions bound the work. A1: one authoritative 150% structure can be maintained per seat family. A2: enough released configurations exist to train a plausibility model. A3: source systems emit change events or can be polled. A4: CTR documents can be parsed to a recorded confidence level. A5: engineers retain release authority.A2 is the weakest. A front-seat family may hold several thousand theoretically buildable variants but only a few hundred released over program life, and the feature vector described in Section 5 is high-dimensional against that sample, so an autoencoder would memorize it rather than learn the manifold. Early deployment should use distance-based and rule-consistency detection and defer reconstruction models until a multi-program training set exists; the governance posture in Table 4 does not depend on the detector.
2. Background and Related Work
- Five streams of published work bear on seat BOM and configuration management, and each leaves a different gap. High-variety BOM structure supplies the generic bill of material, a product-family model held once as a parameterized superset from which specific bills are generated [5], later extended to routing so that engineering, ordering, and operations planning share one representation [6]; carmaker practice shows how constraints reduce a large alternative space to a buildable subset [1], [2]. This is the foundation of the 150% BOM used here, but it addresses neither color and trim semantics nor many-to-one customer-color mapping. Configuration research establishes how predicates derive a specific product from a generic model [7]-[10], and product-line engineering treats the same problem through feature models [11], [12].Enterprise- and plant-level work connects configuration to BOMs and downstream plans [13], supplies the commonality-versus-variety framing [14], recovers generic BOM structure from what was built [15], derives engineering and manufacturing views from one source [16], formalizes transformation for production planning [18], and retargets an EBOM to a maintenance BOM [17]. Graph-based lifecycle integration connects design, manufacturing, and quality artifacts through persistent identifiers [19], [21], where what is promoted to an addressable entity determines what can later be reasoned about [20], [24]; knowledge graphs have been applied to configuration [22], [23], and a graph BOM model couples product development with production planning [25]. No published work known to the author applies these primitives to a commodity in which trim and color drive variety.A. Capability Gap Versus Deployment GapIn the reference environment, saved variant rules can express a 100% BOM derived from a released 150% BOM, but when the 150% structure is revised there is no reliable way to identify every saved rule affected. That is an observation about one deployment, not evidence against the technology class. The narrower claim made here is that three capabilities were not available together: color and trim semantics as first-class constraints, configuration knowledge extracted from external documents with recorded confidence, and bitemporal state separating when a change applied from when the enterprise learned about it.
3. Problem Definition
- A seat variant combines several option spaces, each with its own structure and constraints. Table 1 multiplies the main dimensions of a representative front-seat family before left/right position, model year, or plant destination are considered.
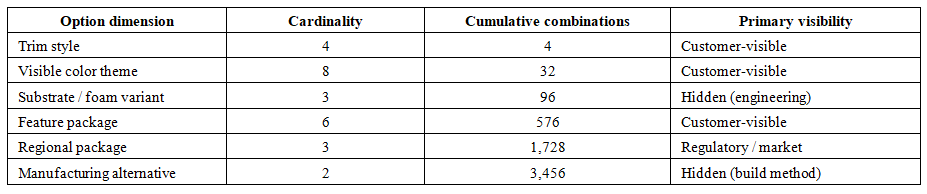 | Table 1. Representative option dimensions for a front-seat family |
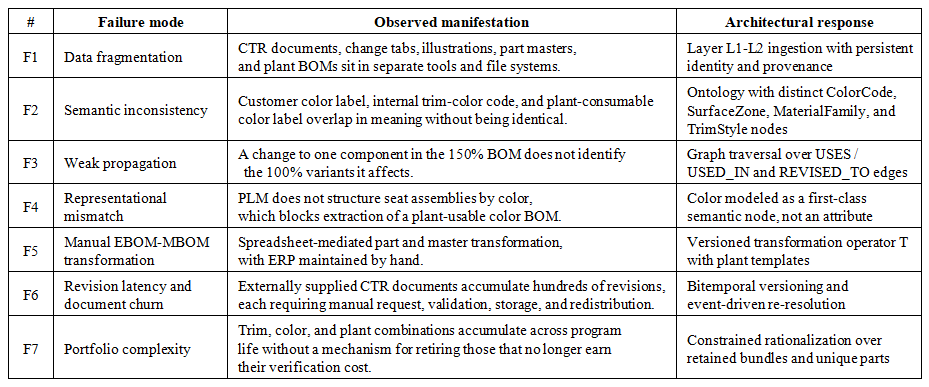 | Table 2. Current-state failure modes and their architectural response |
4. Proposed Architecture
- A. Design Principles and LayeringThe architecture keeps one authoritative 150% seat structure per product family and represents entities, constraints, and events directly as a graph, following the generic BOM and configuration literature [1], [5], [7], [13] and graph-based digital-thread work [19], [21], [25]. Layer L1 in Figure 1 ingests structured sources such as PLM part masters, released EBOMs, and saved variant rules, together with the semi-structured sources carrying most of the color logic. Layer L2 assigns each record a persistent graph identifier and a provenance tuple holding source system, source object identifier, source revision, ingestion timestamp, confidence, and validation flags. Versioning is bitemporal [27]-[29]: valid time records when content applies, transaction time when the platform learned it. External documents often arrive after the change they describe, so valid time alone cannot answer what the platform believed on a given date.
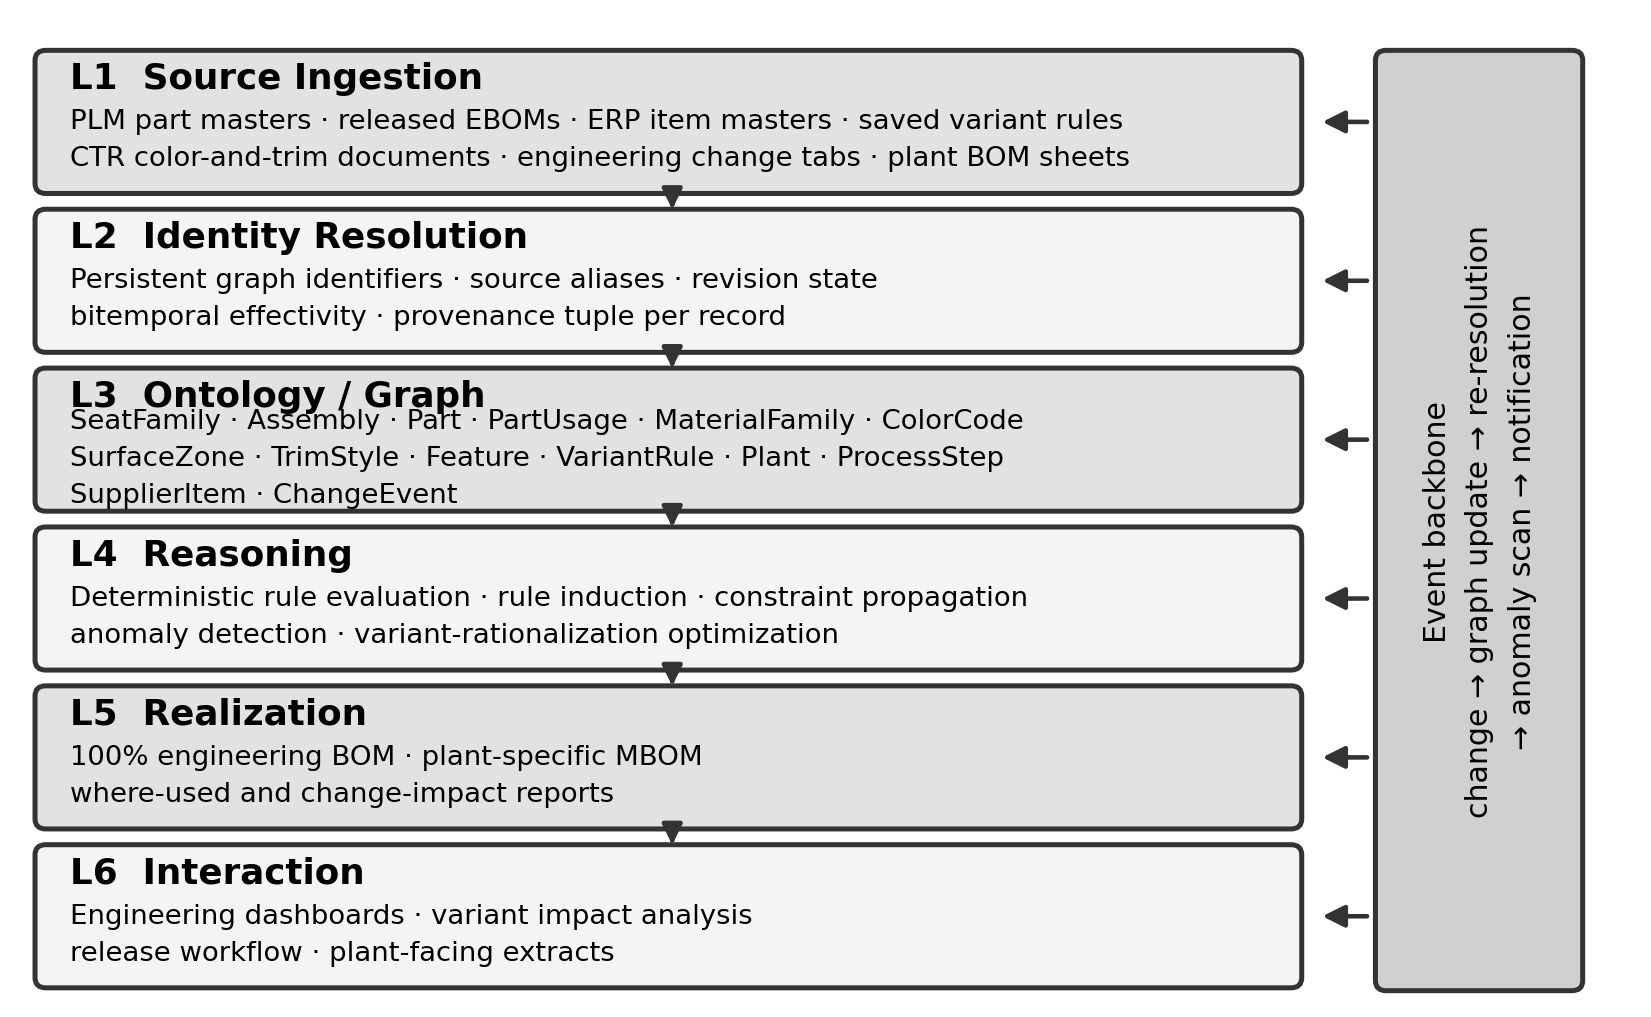 | Figure 1. Six-layer reference architecture. Sources are ingested and resolved to persistent identities, held in the seat-domain ontology of Table 3, reasoned over by rules and AI together, and materialized as engineering and manufacturing output |
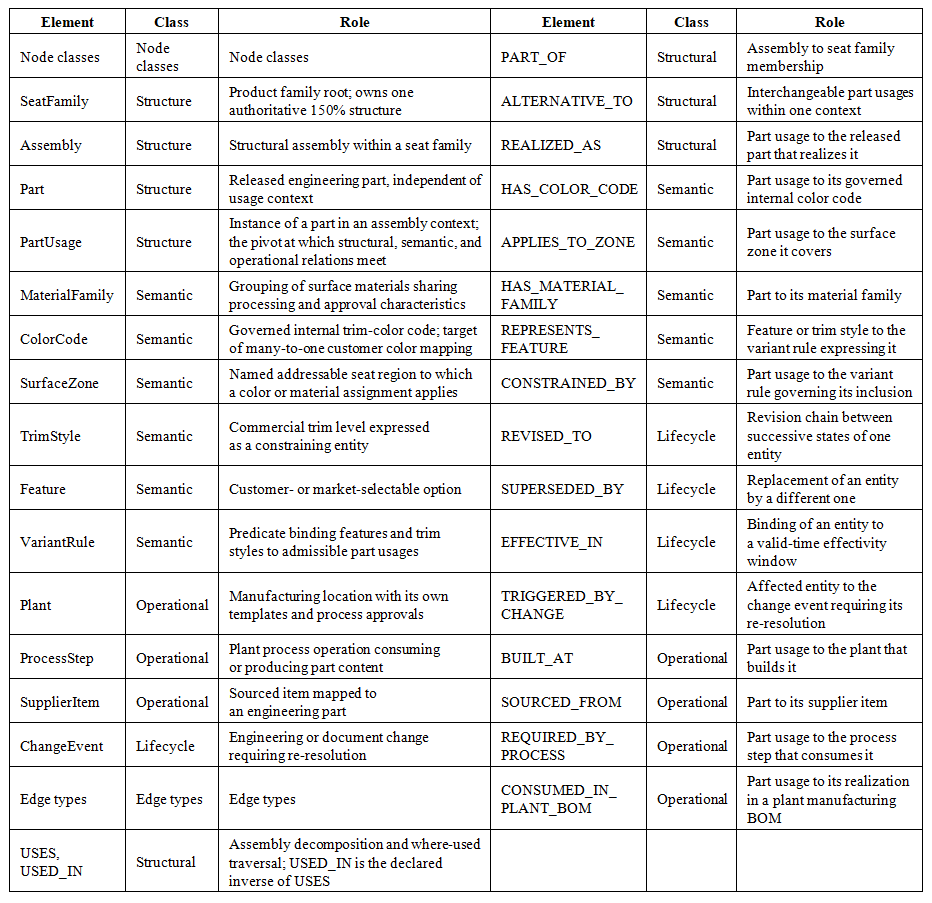 | Table 3. Canonical node and edge specification of the seat configuration graph |
5. AI and Analytics Methods
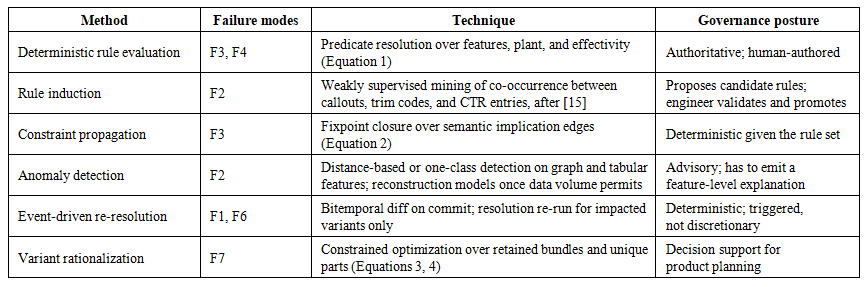
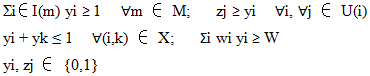
- Letting a model generate configurations directly is not defensible for a product structure carrying safety and quality obligations. Deterministic rules stay authoritative for mandatory inclusions, exclusions, and cardinality, and AI supports them. Table 4 identifies the analytics applied above the structural responses of Table 2, the failure modes they address, and the authority each is allowed.
 | Table 4. Analytics methods, target failure modes, and governance posture |
 | (1) |
 | (2) |
 | (3) |
 | (4) |
6. Deriving 100% BOMs from the 150% Structure
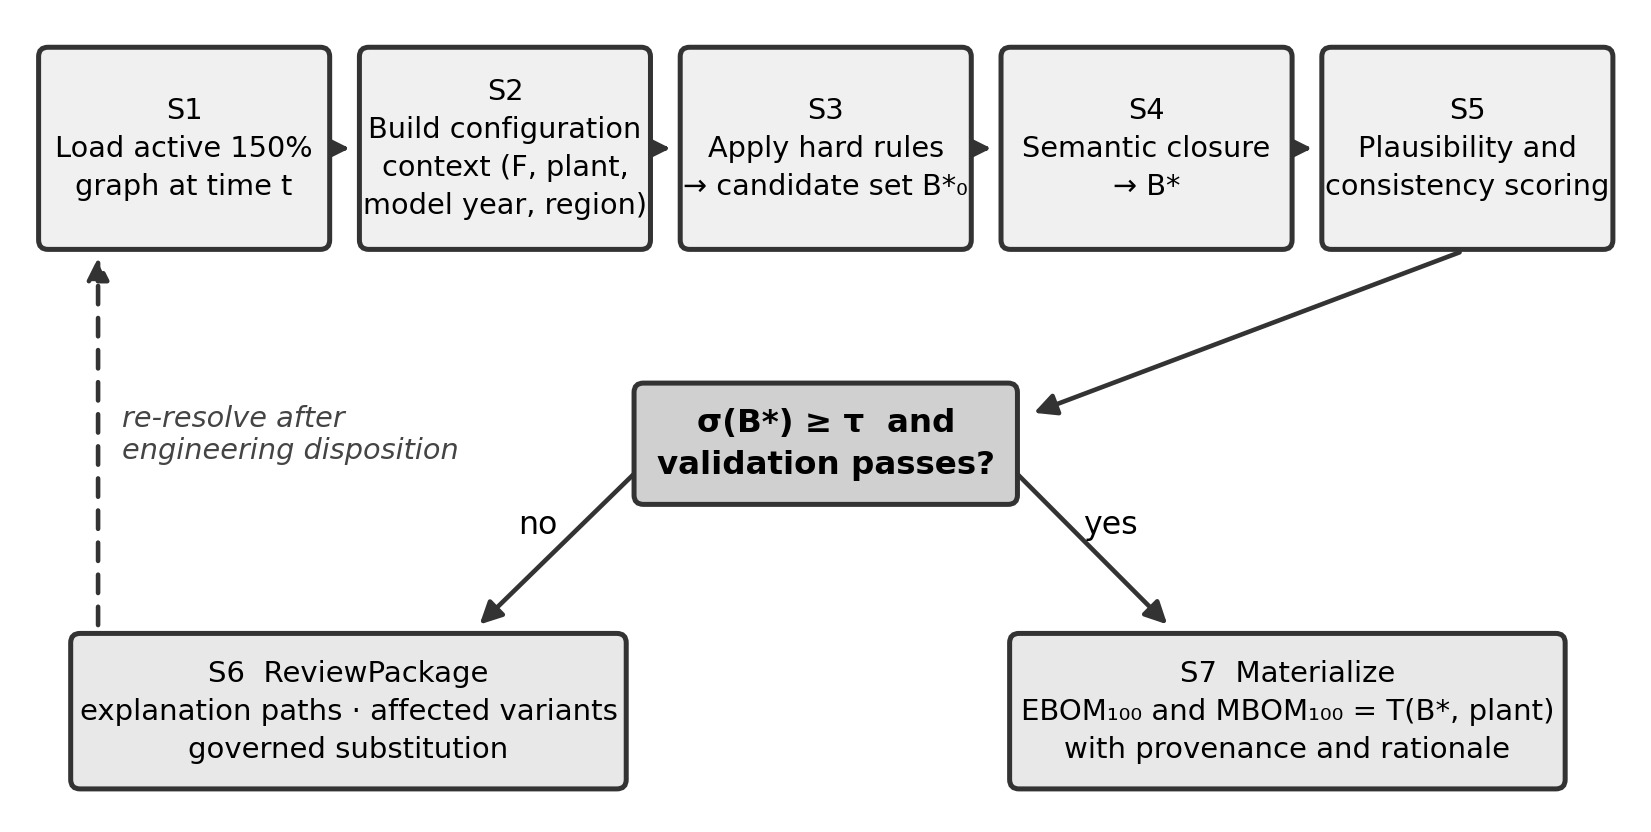
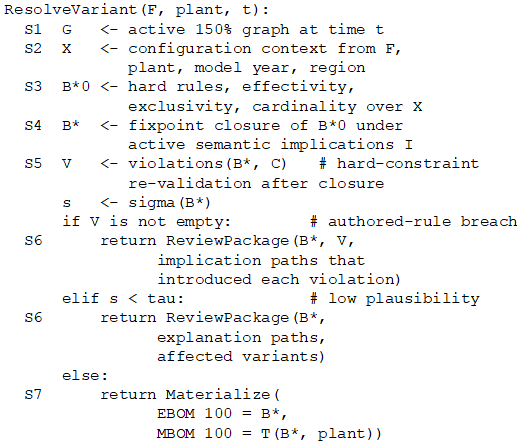
- Figure 2 shows the seven-stage resolution workflow, and Algorithm 1 states it.
 | Figure 2. Seven-stage resolution workflow. B* is scored before anything is materialized |
 | Algorithm 1. ResolveVariant |
 | (5) |
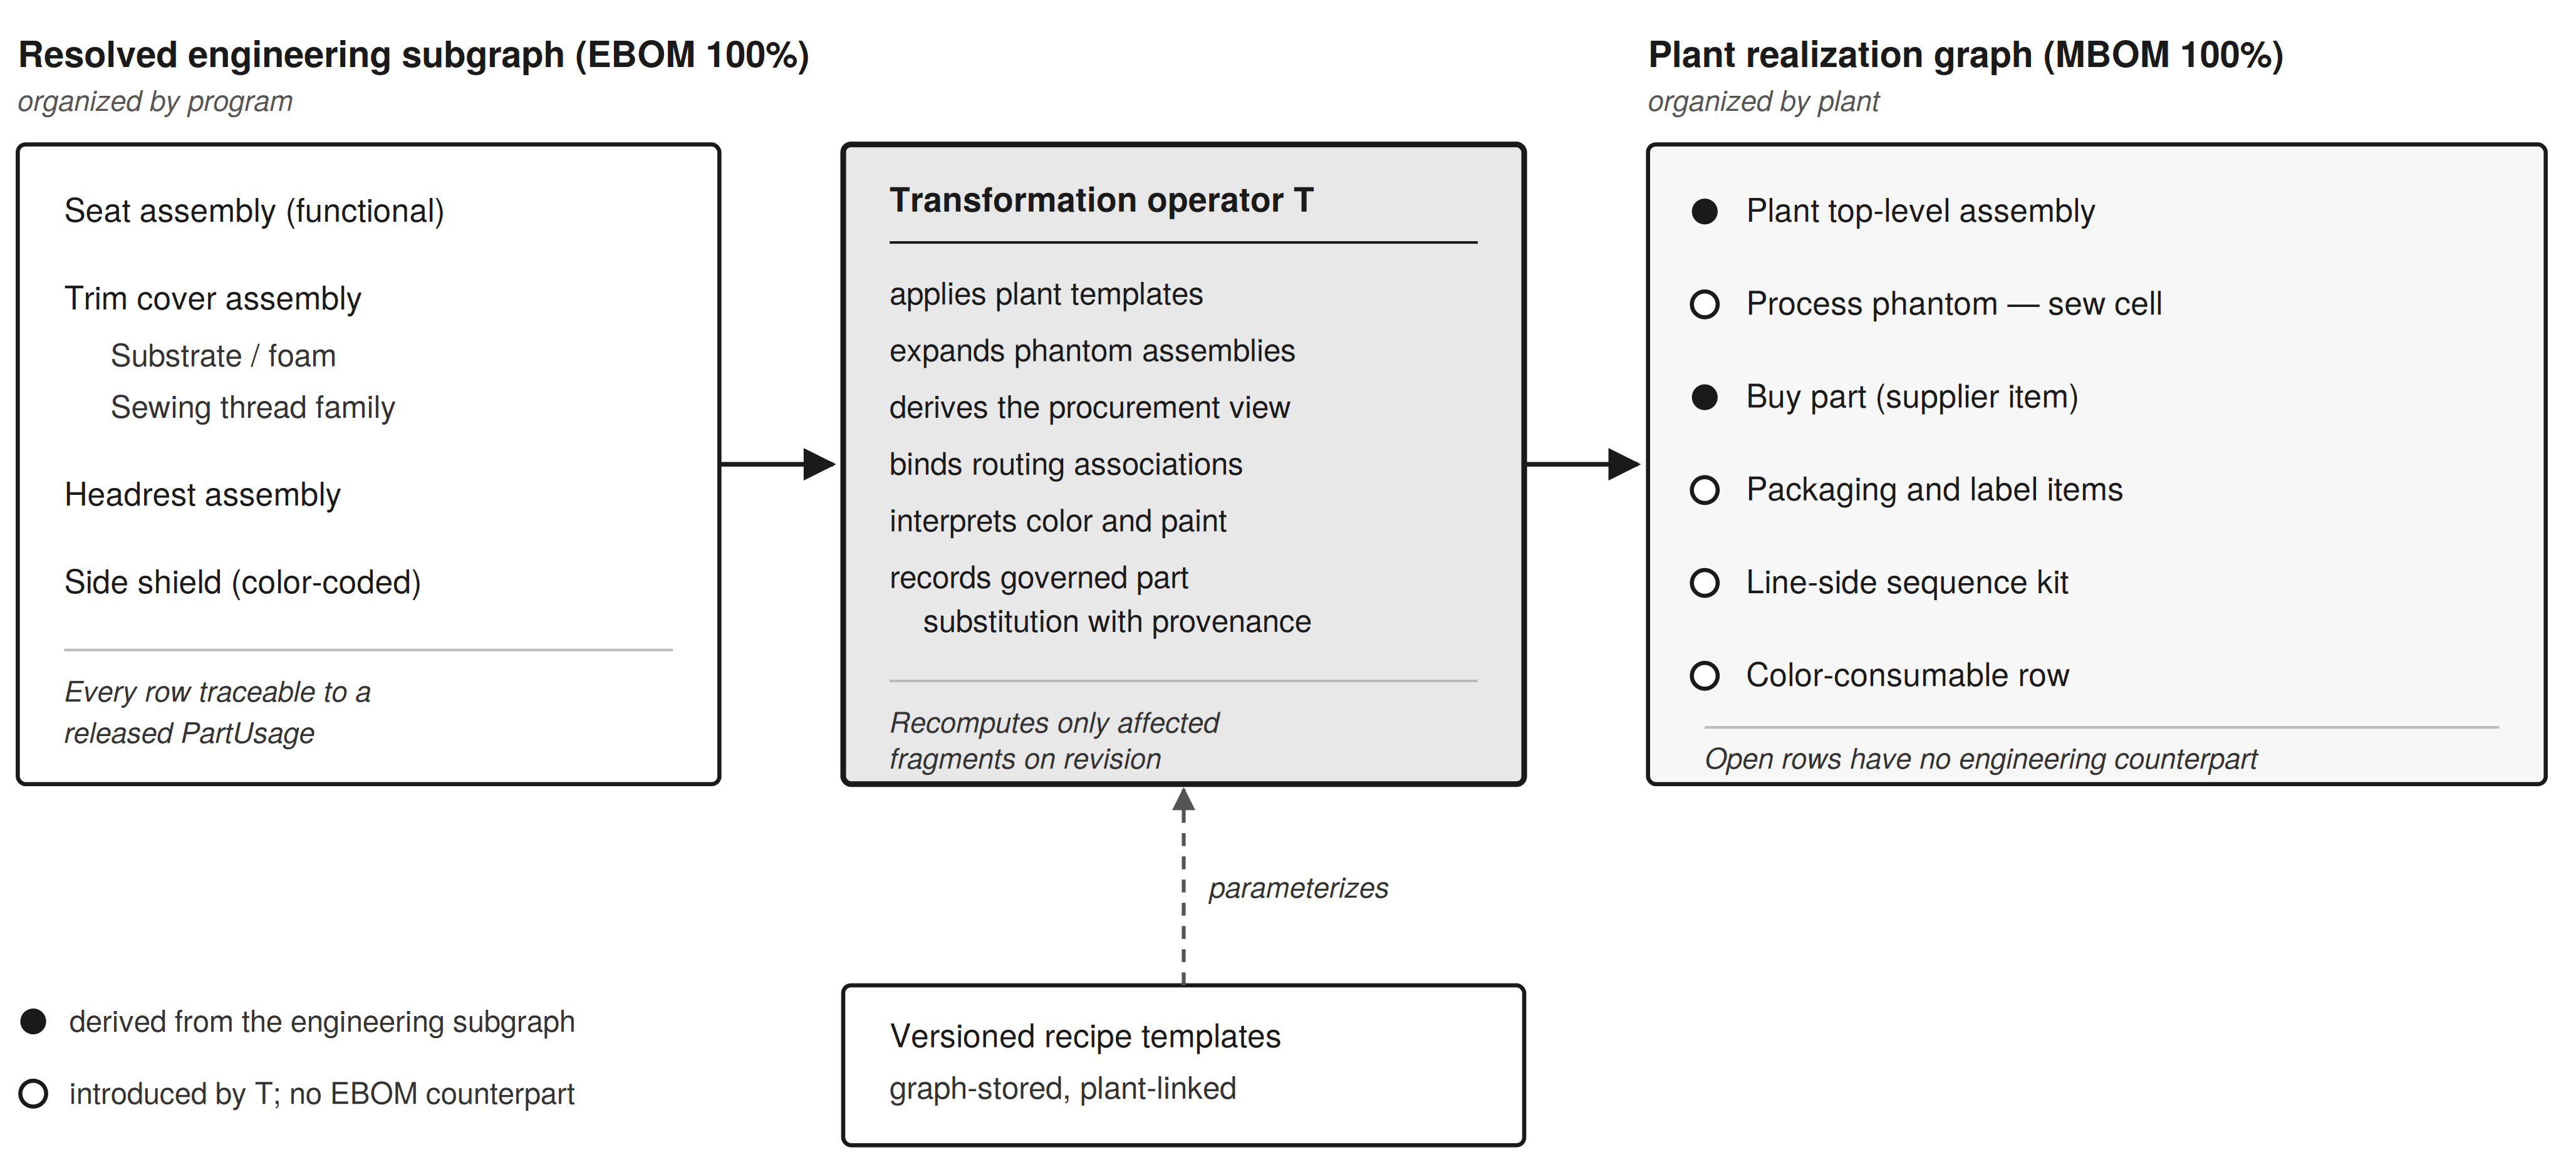 | Figure 3. EBOM-to-MBOM transformation. T is parameterized by versioned, plant-linked recipe templates, which makes every structural difference between the program view and the plant view explicit and attributable |
7. Application Scenario
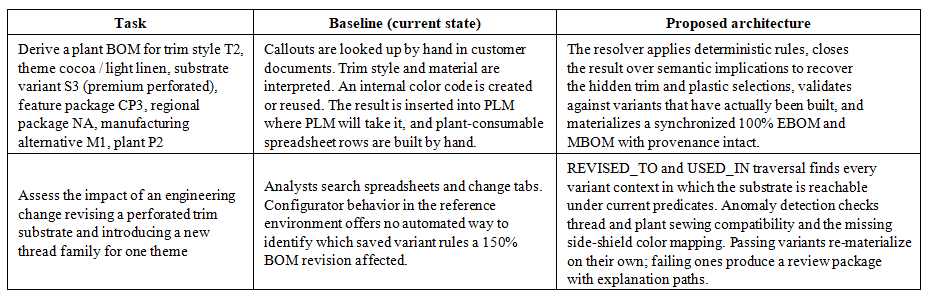
- Take the front-seat family of Table 1, built across 3 plant destinations. Trim covers, headrests, side shields, armrests, and cushions each carry color and material semantics the base PLM structure does not fully capture. Table 5 compares current and proposed handling of two representative tasks. In the proposed architecture, customer CTR rows, trim engineering outputs, PLM parts, and plant MBOM templates are all graph nodes; surface zones are named explicitly; and each customer color entry maps first to a semantic color entity and then to a governed internal color-code node.
 | Table 5. Baseline versus proposed handling of representative seat configuration tasks |
8. Discussion
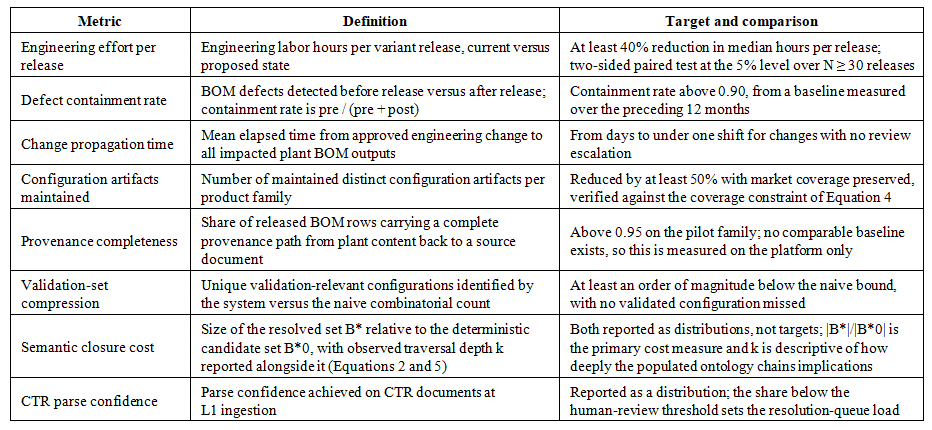
- None of the following has been measured. Anomalies and validation failures would surface before material reaches the plant, which is where BOM defects are usually caught today. Cycle time is the most visible candidate for improvement: a color program that currently takes weeks to process manually would resolve against the graph in a single pass. One graph-derived structure also replaces numerous parallel spreadsheets and saved-variant artifacts. Table 6 defines the pilot metrics: a paired comparison on one seat family of N variant releases under current practice against N releases after cutover, evaluated by a two-sided paired test at the 5% level.
 | Table 6. Evaluation framework for a future deployment study |
9. Conclusions
- Seating is a demanding and underexamined domain for configuration and BOM research. Product structures have to connect customer- facing variety with hidden engineering and manufacturing dependencies, and failures concentrate in trim, color, and plant- specific realization. In the programs observed, color-structured BOM extraction, propagation of affected variants after a 150% revision, and automated EBOM-to-MBOM transformation all remain unresolved.The proposed architecture combines a graph-native ontology, one authoritative 150% seat structure, deterministic reasoning, AI- supported review, anomaly detection, and event-driven synchronization to derive explainable 100% engineering and manufacturing BOMs. Promoting PartUsage, SurfaceZone, and ColorCode to first-class nodes makes seat color and trim logic computable. Bitemporal versioning is standard [27]-[29] but becomes necessary when configuration semantics arrive through late external documents, because valid time alone cannot show what the enterprise believed when a release decision was made. AI should advise and explain rather than decide. The next step is an instrumented pilot on one seat family evaluated against Table 6.
ACKNOWLEDGEMENTS
- The author thanks colleagues in seat engineering, trim engineering, manufacturing engineering, and product lifecycle management whose day-to-day practice framed the problem addressed here.