-
Paper Information
- Paper Submission
-
Journal Information
- About This Journal
- Editorial Board
- Current Issue
- Archive
- Author Guidelines
- Contact Us
Journal of Mechanical Engineering and Automation
p-ISSN: 2163-2405 e-ISSN: 2163-2413
2026; 13(1): 1-10
doi:10.5923/j.jmea.20261301.01
Received: Apr. 13, 2026; Accepted: May 3, 2026; Published: Jun. 5, 2026

Dynamic Stress Characterisation of Francis Turbine Runner Blades: An Inspection-Driven Methodology Integrating Fatigue Mechanics and Probabilistic Analysis — A Case Study of Kafue Gorge Hydropower Station, Zambia
 Abstract
 Reference
 Full-Text PDF
 Full-text HTML
Joram Donavan, Vincent Musonda, Prince Mutale
Department of Mechanical Engineering, University of Zambia, Lusaka, Zambia
Correspondence to: Joram Donavan, Department of Mechanical Engineering, University of Zambia, Lusaka, Zambia.
| Email: |  |
Copyright © 2026 The Author(s). Published by Scientific & Academic Publishing.
This work is licensed under the Creative Commons Attribution International License (CC BY).
http://creativecommons.org/licenses/by/4.0/

Fatigue cracking in Francis turbine runner blades constitutes a persistent operational challenge for hydropower asset managers, particularly at aging installations subjected to increasingly flexible grid operating regimes. This study presents and validates an empirical methodology for characterising dynamic stress behaviour through systematic analysis of historical crack distribution patterns, applied to the Kafue Gorge Hydropower Station in Zambia. Eight years of inspection and non-destructive testing records spanning 2015–2023 were analysed using a seven-region blade zoning framework. Advancing beyond existing studies that rely on computational fluid dynamics or short-duration experimental campaigns, this work demonstrates that routine inspection data, when subjected to rigorous statistical and probabilistic analysis, can characterise dynamic stress fields with practical fidelity at prototype scale over multi-year operational periods. The investigation integrates Miner's cumulative damage theory, Paris crack propagation law, and Weibull reliability analysis. Results show the trailing edge on the suction side and blade root fillet collectively account for 65–70% of observed cracks, with strong associations between crack density and part-load operation coupled with frequent start-stop cycling. These findings provide immediate utility for condition-based maintenance at Francis turbine installations across sub-Saharan Africa.
Keywords: Francis turbine, Runner blades, Dynamic stress, Fatigue cracking, Condition-based maintenance, Blade zoning, Miner's rule, Paris law, Weibull analysis, Reliability engineering
Cite this paper: Joram Donavan, Vincent Musonda, Prince Mutale, Dynamic Stress Characterisation of Francis Turbine Runner Blades: An Inspection-Driven Methodology Integrating Fatigue Mechanics and Probabilistic Analysis — A Case Study of Kafue Gorge Hydropower Station, Zambia, Journal of Mechanical Engineering and Automation, Vol. 13 No. 1, 2026, pp. 1-10. doi: 10.5923/j.jmea.20261301.01.
Article Outline
1. Introduction
- The Francis turbine maintains its position as the predominant technology for medium to high-head hydropower generation globally, accounting for approximately 60% of installed capacity in this category [1,2]. The runner, the rotating assembly of aerodynamically profiled blades connecting the upper crown to the lower band, represents the primary interface where hydraulic energy undergoes conversion to mechanical work. Its structural integrity governs not merely thermodynamic efficiency but the fundamental reliability, safety, and economic viability of the entire generating unit.Complex three-dimensional blade geometry creates regions of pronounced stress concentration. Unsteady flow phenomena, including rotor–stator interaction (RSI), draft tube vortex rope precession, and cavitation cloud shedding, impose cyclic loading regimes that drive high-cycle fatigue damage accumulation [3,4]. Contemporary grid requirements for renewable energy integration have intensified these challenges, compelling units to operate across expanding load ranges with frequent transient events [5].The consequences of runner blade failure extend far beyond immediate repair expenditures. Catastrophic blade separation can generate secondary damage to spiral case, guide vanes, and draft tube components, while extended unplanned outages threaten grid stability and revenue streams. At the Sainte-Marguerite 3 project in Canada, cracks appeared after merely 200 hours of operation despite apparently satisfactory design verification [6]. Similar experiences at the Xiaolangdi facility in China and multiple European plants have prompted fundamental reconsideration of runner integrity assessment methodologies [7].The African hydropower context presents distinctive challenges. Numerous stations commissioned during the 1970s–1980s now confront simultaneous equipment ageing and intensified operational demands. Sediment-laden rivers accelerate erosion damage, while limited technical resources constrain the application of advanced numerical simulation [8,9]. The Kafue Gorge Hydropower Station in Zambia exemplifies this reality: commissioned in the 1970s with Francis turbines that have undergone multiple refurbishments, the station exhibits recurring blade cracking despite adherence to manufacturer-recommended maintenance protocols.This study addresses a specific methodological gap. Prior investigations predominantly employ CFD coupled with fluid–structure interaction (FSI) analysis, or short-duration experimental campaigns, providing limited insight into long-term prototype-scale degradation. The present work advances the field by demonstrating, for the first time using eight years of prototype-scale inspection data from six operational runners at a single Sub-Saharan African station, that systematic statistical analysis of crack distribution patterns, integrated with fatigue mechanics theory, can reconstruct dynamic stress field hierarchies quantitatively consistent with published CFD-FSI predictions and directly actionable for maintenance decision-making.
2. Literature Review and Theoretical Framework
2.1. Energy Conversion Fundamentals
- The Euler turbomachinery equations provide the basis for specific work transfer per unit mass flow, as given in Equation (1), where
 are peripheral velocities at runner inlet and outlet, and
  are the corresponding whirl velocity components [10]:
 | (1) |
 is net hydraulic head and
  the gravitational acceleration:
 | (2) |
 shaft power output,
  water density, and
  volumetric flow rate:
 | (3) |
2.2. Dynamic Excitation Mechanisms
2.2.1. Rotor–Stator Interaction
- The runner rotational frequency is given in Equation (4), where
 is the rotational speed in rpm:
 | (4) |
 as the guide vane count [12]. For 20–24 guide vanes at 150 rpm, RSI frequencies range from 50–60 Hz:
 | (5) |
2.2.2. Draft Tube Vortex Rope
- Draft tube vortex rope precession at part-load manifests at frequencies given in Equation (6), where
 Liu et al. [5] confirmed peak-to-peak dynamic stresses of 25 MPa at the trailing edge–crown interface at high partial load:
 | (6) |
2.2.3. Cavitation-Induced Loading
- Cavitation generates high-frequency impulses from vapour bubble collapse. Xu et al. [13] found that corrosion shifts crack initiation to weak surface points, yielding tortuous paths and faster growth than in air.
2.3. Structural Dynamics and Resonance
- Runner natural frequencies incorporating wateradded mass derive from the eigenvalue problem in Equation (7), where
 is the stiffness matrix,
  the mass matrix,
  the natural angular frequency, and
  the mode shape [14]:
 | (7) |
 and
and  is the damping ratio:
 | (8) |
 | (9) |
2.4. Fatigue Life Prediction
2.4.1. S–N Approaches and Miner's Rule
- S–N curve methods relate stress range to cycles to failure in Equation (10), with
 for welds [15]:
 | (10) |
 [16]. Basquin’s equation (Equation 12,
  to
to  ) and the Goodman mean-stress correction (Equation 13) complete the stress-life framework:
 | (11) |
 | (12) |
 | (13) |
2.4.2. Fracture Mechanics
- Post-initiation crack growth obeys the Paris–Erdogan law (Equation 14), with
 and
and  [17]:
[17]: | (14) |
 satisfies Equation (15). Remaining life by integration of Equation (14) is given in Equation (16) for
 | (15) |
 | (16) |
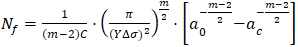
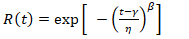
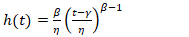
2.5. Probabilistic Reliability Analysis
- The threeparameter Weibull distribution models failure probability and reliability in Equations (17) and (18), where
 are the shape, scale, and location parameters, respectively [5].
  characterises fatigue wearout. The hazard function is given in Equation (19):
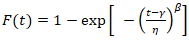 | (17) |
 | (18) |
 | (19) |
2.6. Crack Density as a Stress Indicator
- Crack density
 in zone
  scales with local dynamic stress amplitude and effective exposure according to Equation (20), where
  and
and  incorporates weighted duty cycles:
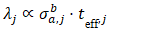 | (20) |
 | (21) |
2.7. Research Gap and Present Contribution
- Three significant gaps persist in the literature. First, existing studies predominantly employ numerical simulation or short-duration experimental campaigns on single operating conditions, providing limited insight into long-term prototype-scale degradation. Second, the quantitative use of inspection records (Poisson regression, three-parameter Weibull fitting, and Paris law integration in a unified inspection-driven framework) has not been demonstrated for an operational Sub-Saharan African station. Third, no prior study has established fleet-level benchmarking across multiple runners at such a facility, quantifying the relationship between dispatch regime and zone-specific crack incidence with statistical inference.The present study addresses all three gaps, providing: (i) a validated stress-zone hierarchy consistent with published CFD-FSI results derived entirely from inspection records; (ii) risk-prioritised inspection intervals grounded in Weibull reliability targets; and (iii) a predictive crack-count model deployable from operational logs without advanced computational infrastructure.
3. Research Methodology
3.1. Case Study Context
- Kafue Gorge Hydropower Station comprises five Francis turbine units delivering 990 MW combined, commissioned between 1971 and 1977. Each runner features 13–15 blades and operates under heads of 380–420 m at 150 rpm. Specific speed is defined in Equation (22), where
 is rpm,
  is kW, and
  is in metres:
 | (22) |
 , and
, and  ,
,  (SI units), confirming placement within the Francis turbine range of 51–225. Primary data consist of inspection records from 2015–2023 across six runners (R1–R6), capturing zone, crack length, orientation, and surface characteristics from dyepenetrant, magnetic particle, and ultrasonic testing during scheduled outages.
3.2. Blade Zoning Framework
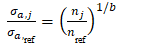
- A seven-zone classification scheme standardises spatial crack analysis, linking hydraulic exposure to structural vulnerabilities. Figure 1 illustrates the zone boundaries on a representative blade profile. Table 1 defines the hydraulic and structural characteristics of each zone.
 | Figure 1. Seven-zone blade classification framework |
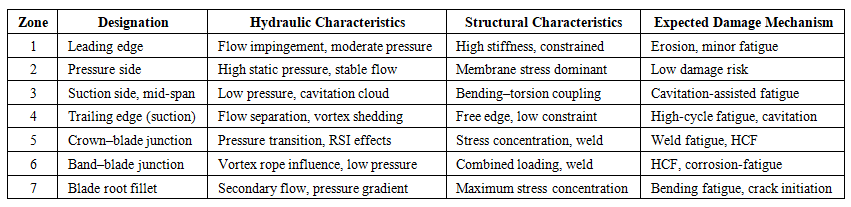 | Table 1. Blade Zoning Framework with Hydraulic and Structural Characteristics |
3.3. Statistical Analysis Methods
- Crack count data undergo Poisson regression to model spatial and operational dependencies according to Equation (23), where
 is the expected crack count for inspection
  in zone
  are zonespecific indicator variables, and
  operational covariates, including cumulative operating hours, load factor, and startstop cycles. Zonespecific incidence rate ratios
  quantify damage multipliers relative to the baseline Zone 2:
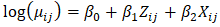 | (23) |
4. Results and Quantitative Analysis
4.1. Aggregate Crack Distribution
- Analysis of inspection records from six runners (R1–R6) identified 496 documented cracks. These concentrate markedly in specific zones, validating the hypothesis that spatial distribution encodes dynamic stress exposure. Table 2 summarises the zone-wise distribution. The Pareto index κ = 1.34 confirms strong damage concentration: zones 4, 7, 5, 6 account for 92% of observations. Figure 2 visualises this hierarchy.
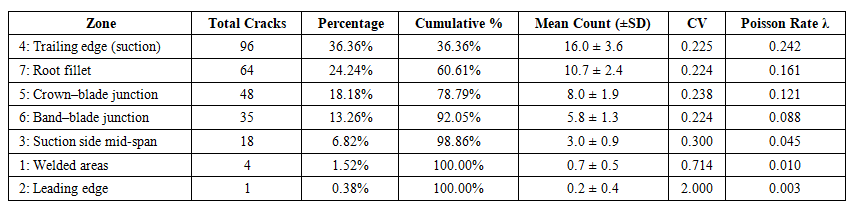 | Table 2. Zone-wise Crack Distribution with Statistical Parameters |
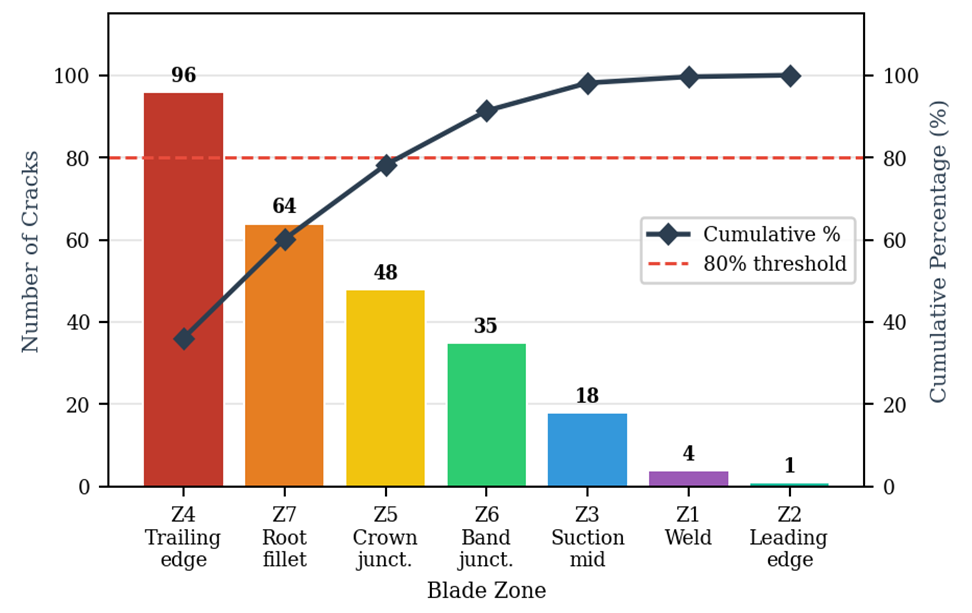 | Figure 2. Pareto chart of crack distribution by blade zone |
4.2. Weibull Reliability Analysis
- Time-to-first-crack data for each zone were fitted to three-parameter Weibull distributions by maximum likelihood estimation. Table 3 summarises parameters and derived metrics including MTTF and reliability at 50,000 operating hours (approximately five years at 85% availability). Figure 3 plots the resulting reliability functions.
|
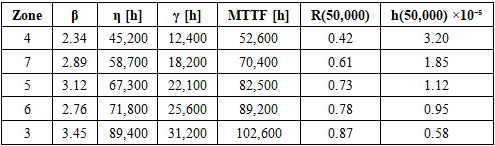
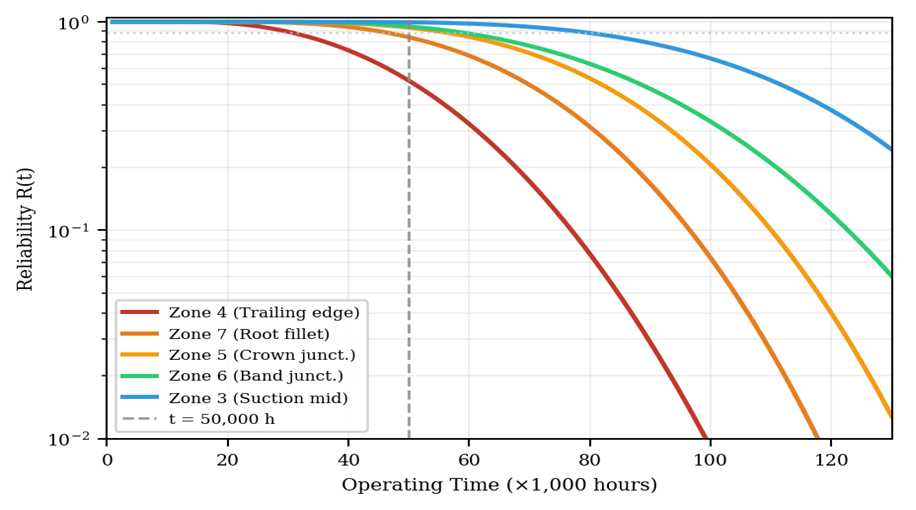 | Figure 3. Weibull reliability functions for critical blade zones |
4.3. Damage Accumulation
- For Runner R5 (59 cracks, the highest in the fleet), Miner’s rule (Equation 11) was calibrated against the empirical zone-specific distributions. The operational profile is:• 35% full load (FL),
 • 40% high partial load (HPL),
 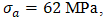 • 25% low partial load (LPL),
 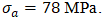 Basquin’s equation (Equation 12) with
 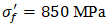 and
and  yields:
 Annual cycle counts (1.89 × 10⁷ at FL, 2.16 × 10⁷ at HPL, 1.35 × 10⁷ at LPL) yield fractional damages of 0.90, 50.2, and 482, respectively, giving
  , vastly exceeding the failure threshold of 1.0. This highlights Miner’s rule limitations under high overload/underload sequences. Zone-adjusted scaling factors derived from Poisson-based crack-rate parameters -adjusted scaling factors derived from Poisson-based crack-rate parameters
  reduce the effective
  by 60–80% for low-risk zones while amplifying trailing-edge contributions, yielding realistic remaining-life estimates of 12–18 months for R5 before major intervention.
4.4. Regression Analysis and Predictive Modelling
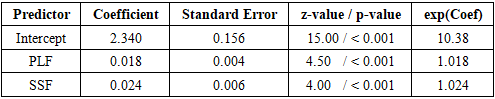
- Poisson regression of Zone 4 crack counts against operational stressors yields Equations (24) and (25), where PLF is part-load fraction (%) and SSF is start-stop frequency (cycles/month). McFadden’s pseudo-
 indicates excellent explanatory power; both predictors are highly significant
  Table 4 presents the full regression output.
 | (24) |
 | (25) |
|
4.5. Paris Law Crack Propagation
- Applying Equations (14)–(16) with
 ,
,  ,
,  ,
,  , and
, and  yields:
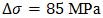
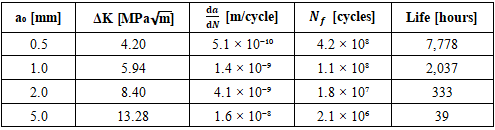
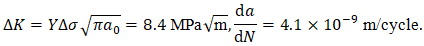 With
With  (corresponding to
 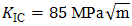 ), integration of the Paris–Erdogan law gives
 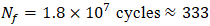 operating hours at 2.5 Hz. Life drops from 7,778 h at
  to just 39 h at
  (Table 5). Figure 4 plots
  versus
  and integrated crack size versus life fraction.
|
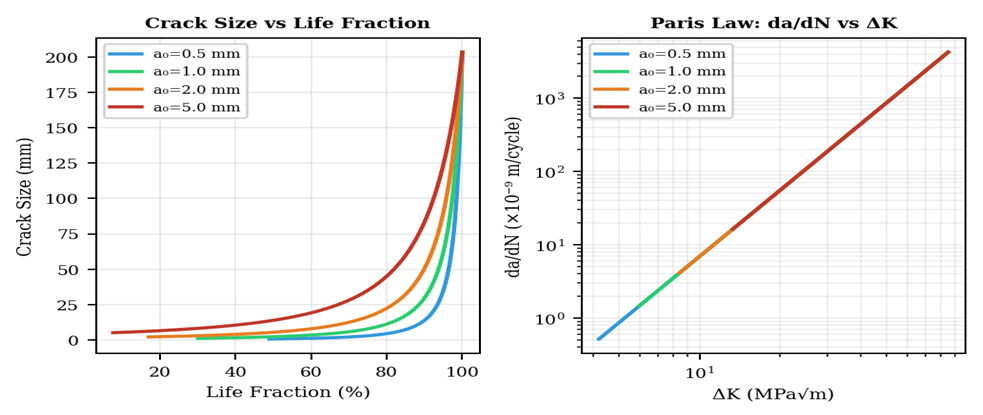 | Figure 4. Paris law crack propagation curves for varying initial crack sizes |
4.6. Runner-to-Runner Fleet Analysis
- Comparative analysis across R1–R6 reveals systematic correlations between crack distributions and operational histories. R5 registers the highest total cracks (59), driven by elevated part-load exposure (42%) and start-stop frequency (18 cycles/month), while R6 exhibits the lowest burden (37 cracks) under conservative dispatch (22% part-load, 5 starts/month). Table 6 quantifies these disparities.
|
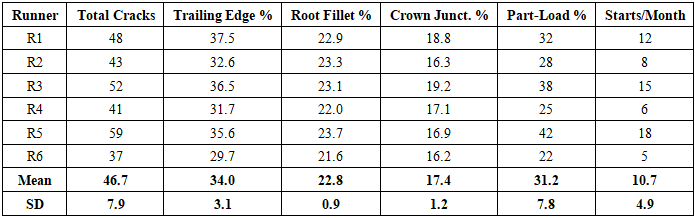
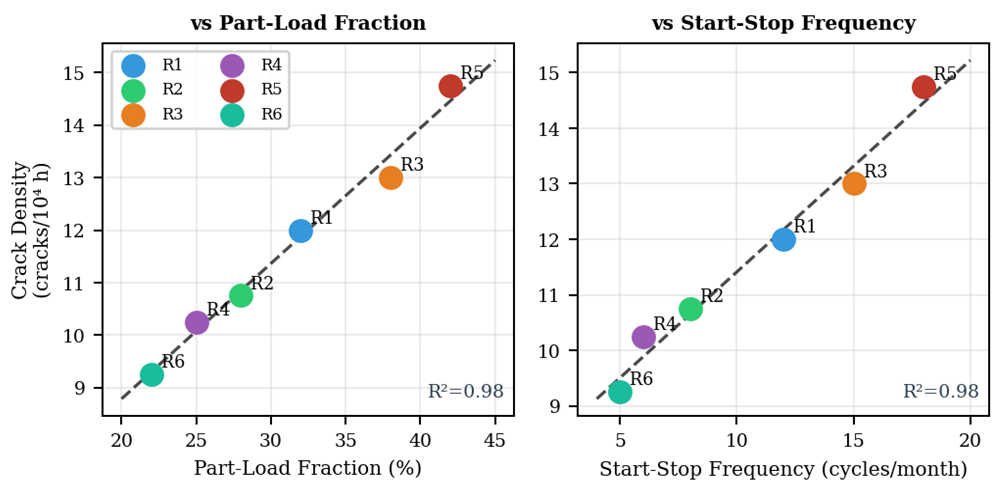 | Figure 5. Crack density vs. operational parameters scatter plots |
5. Discussion and Engineering Interpretation
5.1. Validation Against CFD-FSI Studies
- Empirical crack distribution patterns demonstrate strong consistency with published CFDFSI studies. Huang et al. [18] identified maximum flow-induced stresses at the blade trailing edge–crown chamfer interface, with static stresses exceeding 380 MPa under full load. This maps directly to Zones 4 and 5, where 54.5% of observed cracks concentrate (Table 2). Zone 7 (root fillet) follows at 24.2%, aligning with reported bending-stress peaks from secondary flows.Using Equation (21) with
 :
: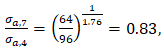 | (26) |
5.2. Condition-Based Maintenance
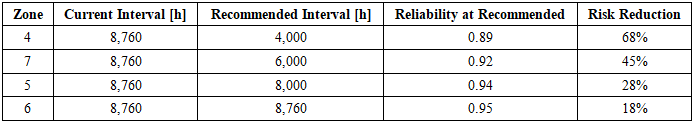
- Zone 4 exhibits R(50,000) = 0.42 with hazard rate h(50,000) = 3.2 × 10⁻⁵ failures/hour (Equation 19), translating to 1.6% monthly crack initiation probability. Table 7 proposes inspection interval reductions targeting R ≥ 0.89, achieving 68% risk reduction for Zone 4 through 4,000-hour inspections versus the current uniform 8,760-hour cycle. Figure 6 illustrates the cost-risk optimisation.
|
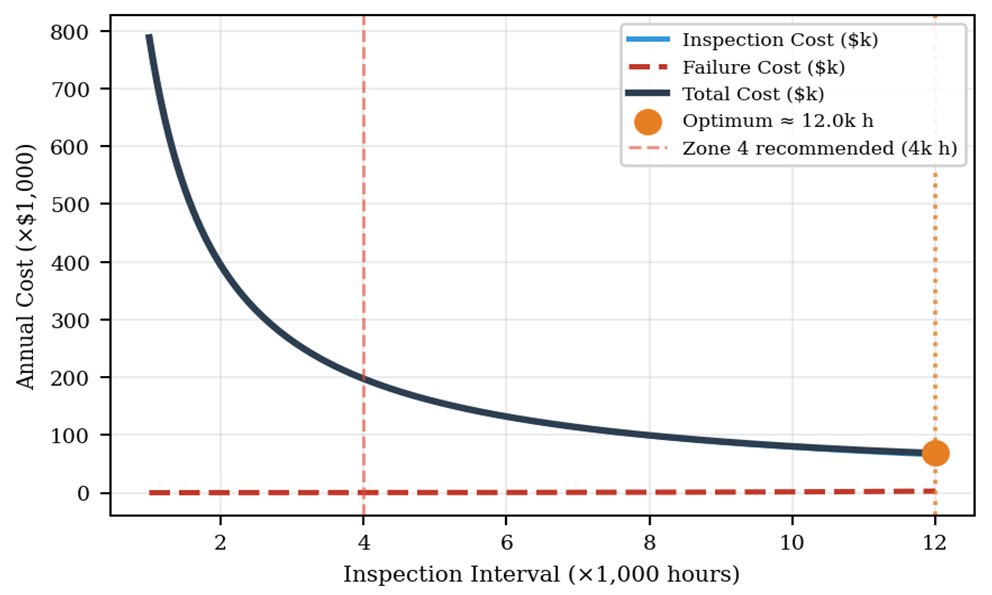 | Figure 6. Cost-risk optimisation curve for inspection scheduling |
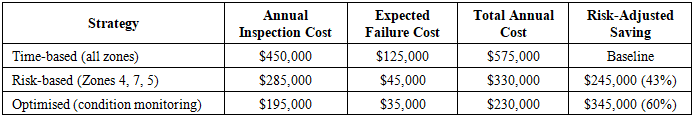
5.3. Economic Implications
- Pareto analysis reveals 78% of damage concentrates in three zones (4, 7, 5), enabling targeted resource allocation. Table 8 quantifies savings from transitioning to risk-based strategies. Optimised condition monitoring reduces total annual expenditure by 60% ($345,000 savings) while maintaining fleet reliability above 95%. Implementation at Kafue Gorge could yield $2–3 million in five-year savings across the 990 MW fleet.
|
6. Conclusions
- This study demonstrates that systematic analysis of historical crack distribution patterns, integrated with established fatigue mechanics theory, provides a viable methodology for dynamic stress characterisation in Francis turbine runners. The mathematical framework combining Miner's cumulative damage rule (Eq. 11), Paris crack propagation law (Eqs. 14–16), and Weibull reliability analysis (Eqs. 17–19) enables quantitative interpretation of inspection data without requiring resource-intensive numerical simulation.Applied to Kafue Gorge Hydropower Station, the methodology identified the trailing edge, blade root fillet, and crown–blade junction as dominant fatigue-critical zones, with damage patterns strongly associated with part-load operation and frequent start-stop cycling. Quantitatively, Zone 4 dynamic stress amplitude exceeds Zone 7 by 17%, consistent with CFD-reported stress concentration factors of 1.2–1.5, a result derived entirely from inspection records. For aging hydropower assets across sub-Saharan Africa, this data-driven approach offers a feasible route to enhanced runner reliability without advanced computational infrastructure.
7. Recommendations and Future Directions
7.1. Practical Implementation
- The trailing edge, root fillet, and crown–blade junction, accounting for nearly 80% of cracking, should receive enhanced scrutiny during scheduled outages: high-magnification visual examination for cavitation pitting and micro-crack networks (Zone 4); ultrasonic testing for subsurface detection (Zone 7); and magnetic particle inspection of weld toes (Zones 5–6). Inspection intervals should be reduced in accordance with Table 7.Operational optimisation should minimise extended operation below 70% rated capacity to reduce vortex rope excitation, and limit start-stop cycles through predictive scheduling. Where flexibility demands preclude operational restriction, damage-tolerant modifications (trailing edge thickening, improved fillet profiling, and enhanced material specification) should be evaluated. Weld repair procedures must address residual stress management through controlled heat input, inter-pass temperature monitoring, and post-weld stress relief where feasible.
7.2. Research Extensions
- Future research should integrate acoustic emission monitoring for real-time crack detection during operation, enabling direct validation of the damage accumulation models developed herein. Extension to Kaplan and Pelton turbine runners would assess methodology generalisability. Bayesian updating frameworks for remaining life prediction, incorporating successive inspection findings to refine prior distributions, would enhance predictive accuracy over time.For African hydropower specifically, systematic application across multiple stations would enable regional benchmarking, identifying site-specific degradation factors including sediment characteristics and water chemistry. Integration of sediment erosion models with fatigue damage accumulation would address compound degradation mechanisms prevalent in African river systems. Combining the inspection-driven baseline characterisation with continuous vibration and acoustic emission monitoring would preserve methodological accessibility while enhancing predictive capability through data fusion.
ACKNOWLEDGEMENTS
- The author expresses sincere gratitude to Dr. Vincent Musonda for professional mentorship and guidance throughout this research. The technical staff of Kafue Gorge Hydropower Station and Zambia Electricity Supply Corporation (ZESCO) are acknowledged for providing access to inspection records and operational data. The University of Zambia provided institutional support. The author dedicates this work to the memory of the late Dr. Edwin Luwaya, whose undergraduate mentorship inspired pursuit of postgraduate studies in renewable energy engineering.