-
Paper Information
- Paper Submission
-
Journal Information
- About This Journal
- Editorial Board
- Current Issue
- Archive
- Author Guidelines
- Contact Us
Journal of Mechanical Engineering and Automation
p-ISSN: 2163-2405 e-ISSN: 2163-2413
2023; 12(1): 20-28
doi:10.5923/j.jmea.20231201.03
Received: Mar. 9, 2023; Accepted: Mar. 19, 2023; Published: Apr. 15, 2023

Gear Quality Evaluation Based on Cloud Service
 Abstract
 Reference
 Full-Text PDF
 Full-text HTML
Dengpan Zhang, Yibo Zheng, Xianjin Liu, Xian Zhao
Institute of Precision Engineering, Henan Polytechnic University, Jiaozuo, China
Correspondence to: Yibo Zheng, Institute of Precision Engineering, Henan Polytechnic University, Jiaozuo, China.
| Email: |  |
Copyright © 2023 The Author(s). Published by Scientific & Academic Publishing.
This work is licensed under the Creative Commons Attribution International License (CC BY).
http://creativecommons.org/licenses/by/4.0/

The design and manufacture of gears have gradually been digitized, intellectualized and networked. The quality evaluation based on gear measurement is the key to ensure the quality of gears manufacturing. In order to digitize and informationalize the gear quality evaluation process and solve the problem of information island in gear measurement, this paper puts forward a gear quality evaluation scheme based on cloud service. First, the framework of gear quality evaluation cloud service is introduced, and the method of publishing and invoking the gear cloud service function based on REST is proposed. Then this article studies the gear accuracy evaluation method and statistical analysis method based on cloud service, and analyzes the gear quality evaluation cloud service process. Finally, a gear quality cloud evaluation system is developed, and the function and software of the cloud platform are tested through actual measurement. The test results show that, compared with the traditional scheme, the cloud service scheme of gear quality evaluation can realize the integrated sharing of gear measurement data and digitization and information of gear quality evaluation process. The service of evaluation results can improve the efficiency of gear quality evaluation.
Keywords: Cloud service, Gear quality, Gear data format, Accuracy evaluation, SPC statistical analysis
Cite this paper: Dengpan Zhang, Yibo Zheng, Xianjin Liu, Xian Zhao, Gear Quality Evaluation Based on Cloud Service, Journal of Mechanical Engineering and Automation, Vol. 12 No. 1, 2023, pp. 20-28. doi: 10.5923/j.jmea.20231201.03.
Article Outline
1. Introduction
- The design and manufacturing of gears have gradually realized digitization, intelligence, and networking. Quality evaluation based on gear measurement is the key to ensuring the quality of gear manufacturing. In the new model of gear intelligent manufacturing [1], intelligent production, network collaborative manufacturing [2], personalized customization, and remote operation and maintenance services [3] have put forward new requirements for gear quality evaluation, that is, the evaluation results should be integrated into the entire life cycle of gear intelligent manufacturing [4] to ensure closed-loop measurement of the entire gear manufacturing process.In recent years, with the development of new technologies such as cloud computing, big data, and the Internet of Things, a new service-oriented cloud measurement model has been proposed [5]. By building a scalable cloud measurement platform, we can achieve the integration and sharing of measurement resources, thereby solving the problem of "information islands" among different information systems within an enterprise. The Hexagon Q-DAS quality data system integration solution opens up the whole process of quality data collection-upload-statistics-mining-report, thus realizing the life cycle management of quality data. In the field of gear informatization, scholars at home and abroad have also carried out various exploration. On the issue of heterogeneity of gear data format, the Association of German Engineers (VDE/VDI) issued the Gear Data Exchange Format (GDE) data format standard for data exchange in the field of gear design, processing and measurement, which has been applied in the production and operation of ZF gear products [6]. In gear manufacturing, Klingelnberg GearEngine cloud computing system has been developed to enhance product tracking capabilities and optimize complete process flow. The system is capable of identifying and managing gear production-related devices and equipment, controlling production processes and fully tracing product quality [7]. In addition, in 2018, Gleason began integrating KiSSsys and FEM software with GEMS design and manufacturing software, thereby eliminating the "data barrier" between gear design and manufacturing [8]. In the field of gear measurement, from the initial mechanical measurement to the combination of mechanical and electronic measurement, to the current multi-disciplinary integration of measurement methods such as optics, mechanics, electronics, and information [9], the ability to obtain gear quality information continues to improve. However, there are still "data barriers" between gear processing machines, measuring instruments, and end users, resulting in the inability of gear measurement results to be fed back into gear design and manufacturing. Therefore, how to integrate massive gear measurement resources into the production process and transform them into gear quality evaluation services that can bring value to users is a key direction of current research.This article aims at the problem of "information islands" based on gear measurement, and conducts research on gear quality evaluation methods based on cloud services. Firstly, it introduces the cloud service framework for gear quality evaluation, as well as the methods for publishing and invoking cloud services. Then, the gear error characterization method, the gear accuracy standard algorithm, and the statistical analysis method of gear quality information are analyzed. In addition, a quality evaluation scheme based on cloud services is proposed and a prototype system is de df developed. Finally, an example test verifies the feasibility and effectiveness of this scheme.
2. Gear Quality Evaluation Cloud Service Architecture
- The basic steps of gear measurement include data acquisition, data processing, data storage and conversion, measurement results presentation, and feedback on the gear manufacturing process [10]. With the continuous progress of gear measurement technology and the changes in the application methods of measurement data, traditional measurement models have been unable to meet the needs of measurement systems in the direction of technological integration, personnel collaboration, equipment integration, and information and data sharing [11]. The gear measurement cloud service system framework based on the cloud measurement model is an overall optimization of existing solutions, enabling digitization of the measurement process and visual presentation of quality data.
2.1. Framework of Gear Quality Evaluation System
- The framework of the gear quality evaluation system under the cloud architecture proposed in this article is shown in Figure 1. Through data integration and cloud service programs, the interconnection and sharing of the entire gear measurement process data is achieved. Under this framework, the entire system is divided into data layer, data processing layer, service layer, and user layer.
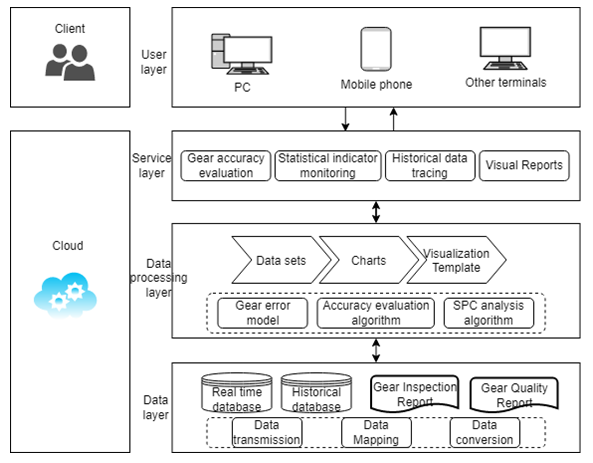 | Figure 1. Framework of gear quality evaluation system |
2.2. Cloud Service Publishing and Invoking Methods
- In the software architecture of the quality evaluation system, the web service layer provides application components as services [13], encapsulates gear quality data resources as data services, and publishes services using a unified style interface, which will facilitate access and integration of gear quality data resources. This paper proposes a REST based data service encapsulation and description method for service-oriented encapsulation and unified description of gear quality data.REST is an abbreviation for “Resource Representational State Transfer”. “Resource” means resources, i.e. data resources circulating on the Internet, such as text, audio and video, etc; “Representational” means a representation, such as TXT, JSON, XML, PNG, and other formats; Generally speaking, REST refers to the state change of data in some form in the network. RESTful Web Services, as an implementation of Web services technology, is a lightweight and efficient Web service [14]. This article uses a REST based Web Services interface to provide users with gear quality cloud evaluation services. The service invocation process is shown in Figure 2. The Web Services interface can be understood as a combination of a resource unique locator URI and four access methods of the HTTP protocol, namely GET, PUT, POST, and DELETE [15]. For example, to access the URI of “http://localhost:8080/report”, the GET method in the HTTP protocol is used, which means subscribing to a gear detection report from the server. The POST method in the HTTP protocol is used to apply for a new gear detection report from the server. As the caller of the gear cloud measurement service, the main function of the gear quality evaluation system is to integrate static and dynamic attribute data, and call the Web Services interface to achieve data cloud access.
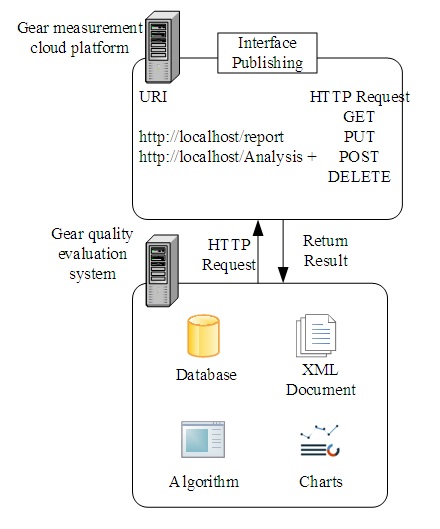 | Figure 2. Release and invocation of gear cloud service functions based on RESTful |
3. Gear Quality Evaluation Based on Cloud Service
3.1. Characterization Method of Profile Deviation
- The current gear accuracy evaluation system is based on the "line measurement" method [16]. When evaluating major deviation items such as tooth profile, helix, and pitch, the evaluation basis is to measure a few characteristic points and characteristic curves. For tooth profile deviation and helix deviation, usually 3-4 teeth symmetrically distributed on the gear are selected. A characteristic curve is measured for each gear tooth in the left and right tooth surface profile and tooth direction directions. For tooth pitch deviation, measure the points on the pitch circle of each tooth surface on the gear center cross section, and measure the characteristic points of the tooth pitch one week later.
3.1.1. Characterization Method of Tooth Profile Deviation
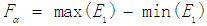
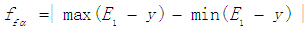
- Select the gear tooth to be measured and measure the tooth profile on a plane at one end in the middle of the gear tooth surface. A tooth profile deviation curve can be obtained from each measured tooth surface. According to the tooth profile deviation curve, the accuracy of the tooth profile deviation of the gear tooth can be evaluated, as shown in Figure 3 and 4.
 | Figure 3. Tooth profile measurement method |
 | Figure 4. Tooth profile deviation |
 | (1) |
 | (2) |
3.1.2. Characterization Method of Helix Deviation
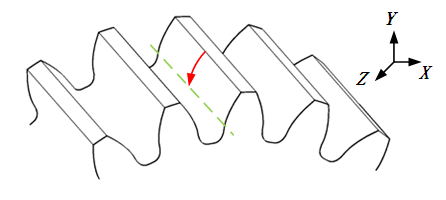
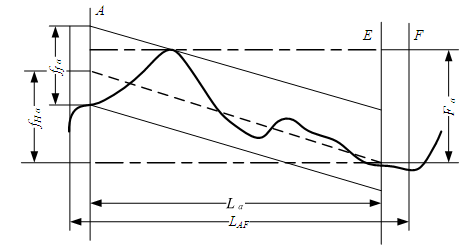
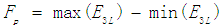
- Select the tooth to be measured, and measure the middle of the tooth surface along the tooth width direction, and each tooth surface to be measured can obtain a helical deviation curve. According to the helix deviation curve, the accuracy evaluation of the helix deviation of the gear teeth can be carried out, as shown in Figure 5 and 6.
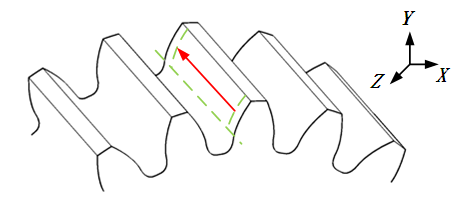 | Figure 5. The helix measurement method |
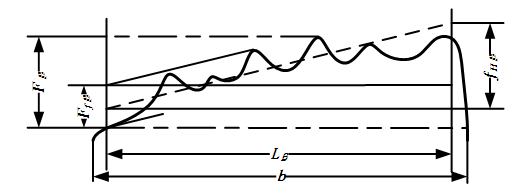 | Figure 6. Helix deviation |
 | (3) |
 | (4) |
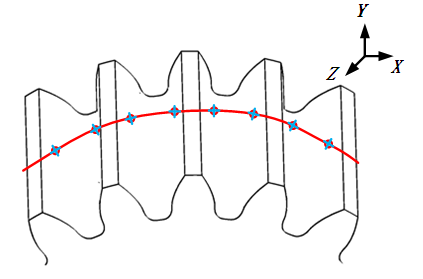
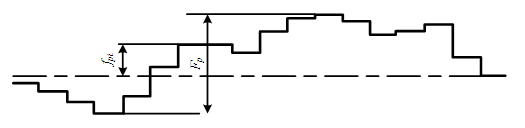
3.1.3. Characterization Method of Tooth Pitch Deviation
- Select part or all of the gear teeth to be measured, measure the left and right tooth pitches of the tooth surfaces of the gear teeth on a certain end plane in the middle, and obtain the left and right tooth pitch deviation curves. According to the tooth pitch deviation curve, the precision evaluation of the tooth pitch deviation of the gear can be carried out, as shown in Figure 7 and 8.
 | Figure 7. Tooth pitch measurement method |
 | Figure 8. Tooth pitch deviation |
 | (5) |
 | (6) |
 | (7) |
 | (8) |
3.1.4. Solve Deviation Information
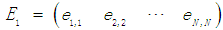
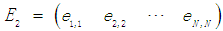
- To evaluate the accuracy of gears, it is first necessary to analyze and calculate the deviation degree of the actual tooth profile from the design tooth profile curve from the deviation curve. Both tooth profile deviation and helix deviation belong to shape and position deviation. In practical applications, in order to facilitate computer solution, the least square method is usually used to fit the gear deviation curve. Here, taking the tooth profile deviation as an example, least-square fitting is performed on the tooth profile deviation curve. The equation for the average tooth profile trace can be expressed as:
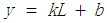 | (9) |
 | (10) |
 | (11) |
 | (12) |
 | (13) |
 | (14) |
 | (15) |
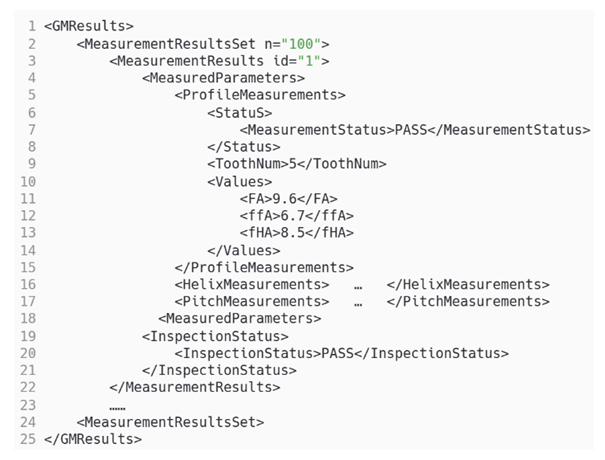 | Figure 9. Example of GMResults module |
3.2. Gear accuracy Evaluation Standards
- The international accuracy standard ISO1328 for cylindrical gears has been revised several times, and three versions have been formed: 1975, 1995, and 2013 [17]. In gear manufacturing enterprises, due to continuous international trade, new and old international standards are basically coexisting. Therefore, when evaluating the accuracy of gears, it is necessary to consider the conversion between different accuracy standards. Generally, there are two methods for determining the allowable value of each deviation in gear standards: calculation method and table lookup method, and table lookup method has more priority than formula method. However, starting from ISO1328-2013, the new gear accuracy standard mainly focuses on formula calculation, and no longer appends various deviation allowable value tables.A considerable portion of software for gear accuracy design is designed based on the method of looking up tables, which establish a database of listed gear accuracy parameter values, and query the database through programming; The other part calculates various parameters of gear accuracy with the help of formulas, and then processes the calculated data with reference to the principle of rounding in the new national standard. The results obtained by the two methods are consistent, while the computational method is more conducive to computer program processing. Therefore, this article makes full use of the fast computing speed of computers and uses formulas to calculate tolerance values. The interface of the gear accuracy tolerance value query software is shown in Figure 10.
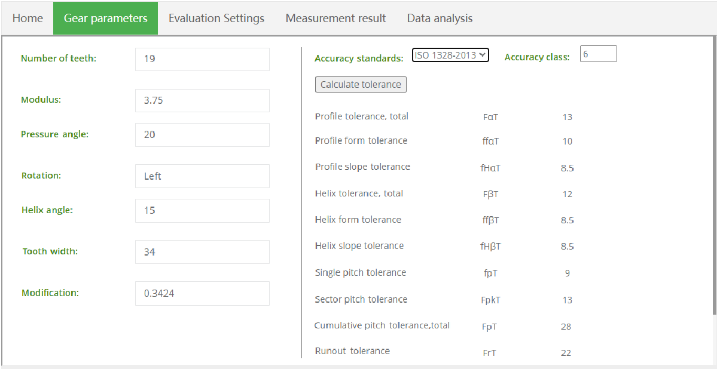 | Figure 10. Gear accuracy tolerance query interface |
3.3. Statistical Process Analysis of Gear Quality Information
- The statistical process control (SPC) can be used to control the quality of the gear machining process, that detect whether the gear deviation value deviates from the preset index, and analyze the stability of the gear process. A large amount of data needs to be processed in SPC applications, so that the traditional manual calculation method can no longer meet the complex calculation requirements. Combining computer information technology with SPC analysis methods, using intuitive graphical analysis and numerical analysis of results, is conducive to quickly understanding the causes of gear processing errors [18].
3.3.1. SPC Statistical Analysis Principle
- SPC is based on three statistical principles: normal distribution, 3σ criterion and small probability principle, to control and manage product quality [19]. The control chart is the main statistical tool used by SPC to analyze the quality process and quality results. According to the probability theory, the distribution law of the processing error σ obeys the normal distribution. It can be seen from the analysis of the basic properties of the normal distribution that the distribution area within the range of 3σ from the center line on the data distribution map is about 99.73%, and the probability of being outside the range of 3σ is 0.27%. For the gear manufacturing process, the gear manufacturing error always has a certain degree of periodic fluctuation. When a certain process is controlled, the distribution of the detected gear deviation data should conform to the "3σ criterion". When the detected gear deviation data exceeds the limit of the control value, that is, it falls outside the 3σ range, based on the "small probability principle", the probability of such an event occurring is only 0.27%, which means it is impossible.
3.3.2. Statistical Analysis Process of Gear Quality
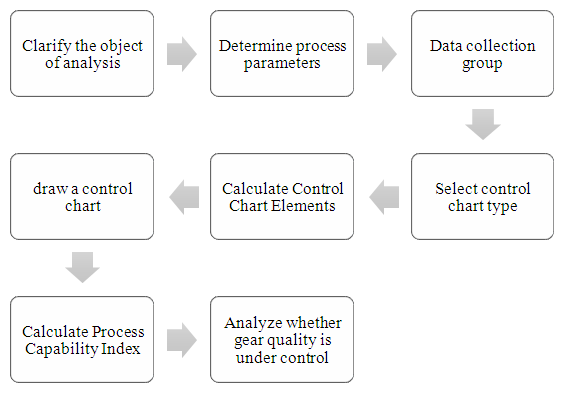
- In this paper, the final measurement is selected as the object of SPC statistical analysis on the gear quality data to monitor the random fluctuation and abnormal fluctuation of the gear product quality. The tooth profile shape deviation, tooth profile tilt deviation, and tooth profile total deviation are used as key monitoring parameters. Statistical analysis of gear quality information, through the control chart can be real-time understanding, analysis, and grasp the change law of gear quality characteristic data over time, and identify abnormal states in time.The SPC analysis process is shown in Figure 11: to clarify the key process of product quality in the gear production process; to determine the process parameters of the gear process; to collect the measurement data at the instrument end and group the measurement data according to the sample size; to select the appropriate one according to the sample size Control Charts. Before drawing the control chart, it is first necessary to calculate the mean control limit, standard deviation control limit and process standard deviation control limit; calculate the process capability index, and use this as a basis to analyze whether the gear quality is in a controlled state.
 | Figure 11. SPC analysis process |
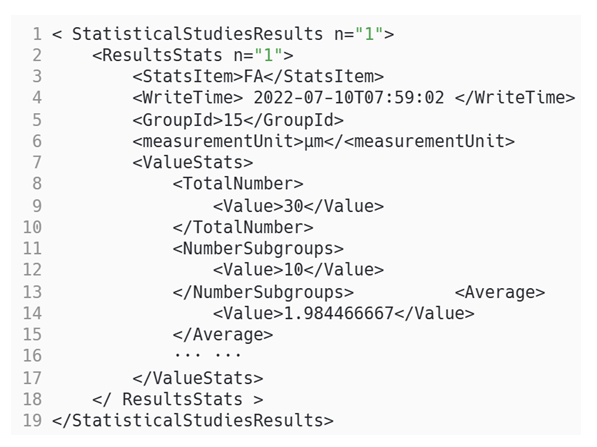 | Figure 12. Example of GMStatistics module |
3.4. Cloud Service Process of Gear Quality Evaluation System
- The cloud service model of the gear quality evaluation system is very helpful for integrating gear quality evaluation into the gear production process. As shown in Figure 13, REST APIs are used to implement mutual calls between different services, followed by secondary encapsulation and publishing. The worker invokes the interface to obtain gear accuracy evaluation information to verify whether the gear processing meets the accuracy requirements. The technician invokes the statistical analysis interface to obtain the quality statistical information of the gear, thereby analyzing whether the gear processing process is stable. The management personnel call the visual report interface to obtain the overall quality profile of the gear, providing a decision-making basis for decision makers to adjust the gear processing process.
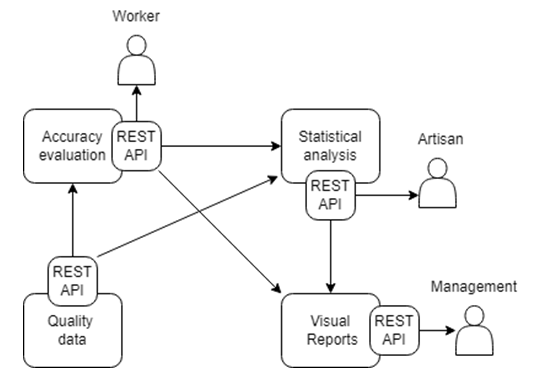 | Figure 13. Cloud service process of gear quality evaluation system |
4. Example Test of Gear Quality Evaluation System
4.1. Single Gear Quality Evaluation Program Test
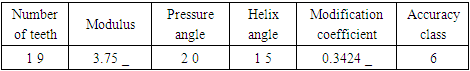
- The gear measurement equipment used in this paper is a Hexagon three-coordinate measuring machine, and the measurement software is PC-DMIS, as shown in Figure 14 and 15. Use a three-coordinate machine to select the left and right tooth profiles of four symmetrical gear teeth for measurement, and store the measurement information in the gear center database. Gear parameters are shown in Table 1.
|
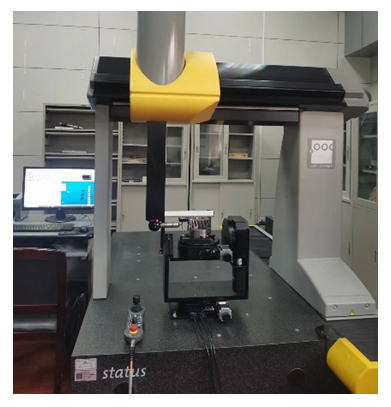 | Figure 14. Hexagon three-coordinates measuring machine |
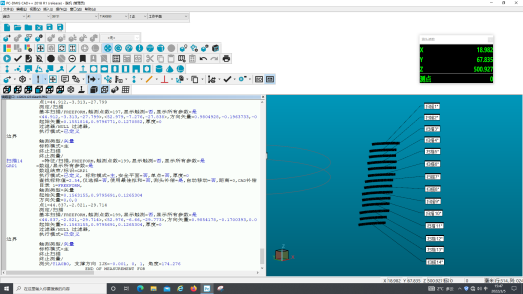 | Figure 15. PCDIMS software measurement page |
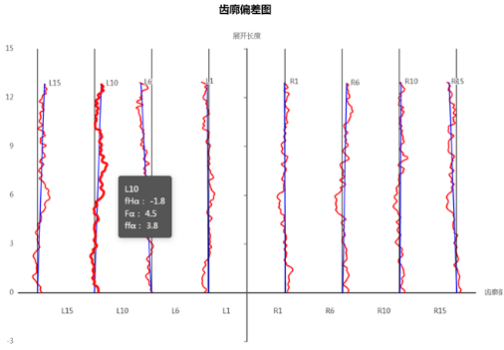 | Figure 16. Visualization chart of tooth profile deviation |
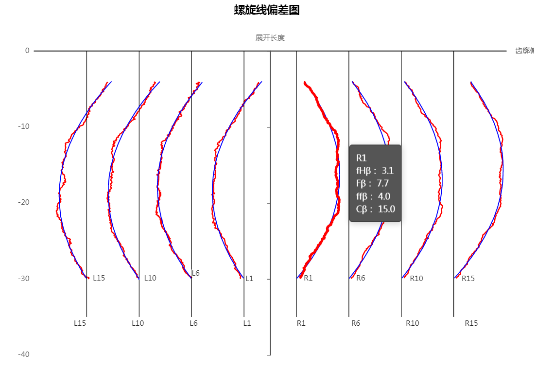 | Figure 17. Visualization chart of helix deviation |
4.2. SPC Statistical Analysis Function Test
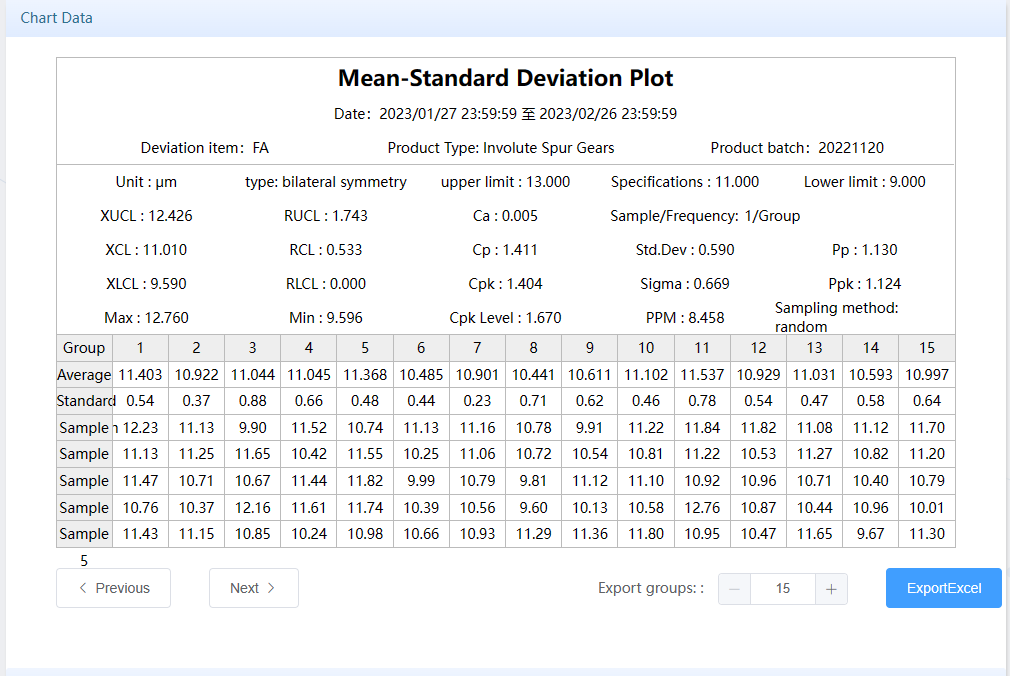
- Perform SPC statistical analysis on the gear error, and store the statistical analysis results in the database. SPC statistical analysis was carried out on 100 sets of gear tooth profile total deviation data samples, which were divided into 20 groups, and the number of sub-samples in each group was 5. As shown in Figure 18 and 19, the tooth profile deviation data can be viewed and managed directly on the page, and the data can be exported to EXCEL format.
 | Figure 18. Chart data page |
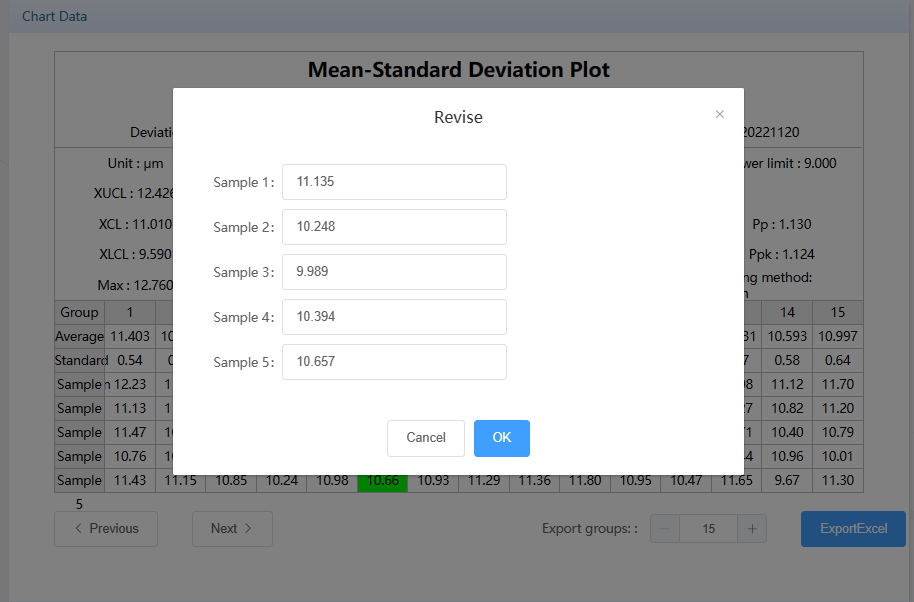 | Figure 19. Data management page |
 chart for analysis. The mean control limits for calculating the total deviation of the tooth profile are
  =11.008, UCLx=12.426, LCLx =9.590, and the standard deviation control limits are
  =0.533, UCLr =1.743, and LCLr =0. It can be seen from Figure 20 that the quality characteristic points do not exceed the control limit, and the deviation data in the sample conform to the discrimination criterion of the control chart. Therefore, the gear quality is in a statistically controlled state. If you want to view historical gear quality data, you can select date, deviation item, product type, product process and chart type to filter and query on the page shown in Figure 21.
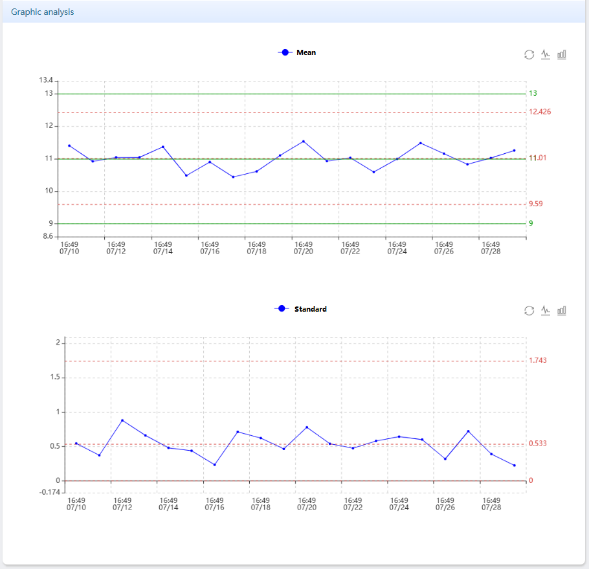 | Figure 20. SPC control chart page |
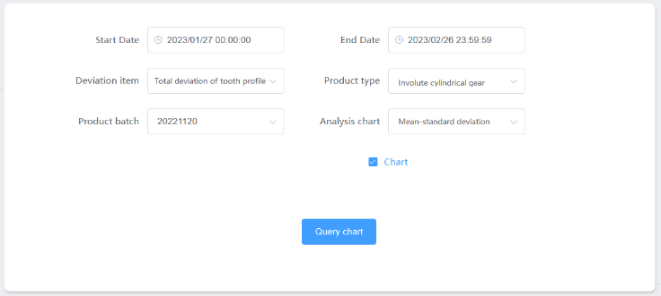 | Figure 21. Data query page |
4.3. Analysis of Test Results
- Through the example testing of the gear quality evaluation system, this article has realized the storage and conversion of gear quality data, data processing, and visual display, completed the informatization and networking process of the gear quality evaluation process, and verified the feasibility of the REST-based gear quality evaluation cloud service solution proposed in this article. The gear experiment results show that compared with traditional solutions, the gear evaluation cloud service solution is beneficial to the integration and sharing of gear measurement resources. The specific performance is as follows:(1) Realize the integration of gear quality information resources. Through the integration of gear measurement process data, cloud storage is realized, improving the efficiency of gear quality data exchange, and providing a data foundation for statistical analysis and error traceability of gear data.(2) Digitize measurement results and visualize data in the form of cloud services. Users can invoke and process gear quality services through a browser by invoking the web service interface. Through visualization, comprehensive information about gear products can be intuitively and accurately expressed, improving the efficiency of gear quality evaluation.(3) Cloud service based gear quality evaluation and statistical analysis provide consistent quality evaluation services for multinational and transregional manufacturing enterprises, enabling enterprises to control product accuracy information in the processing process in real time, thereby helping managers make scientific decisions.
5. Summary
- Aiming at the "information island" problem of quality information in the manufacturing process of gear products, this paper studies the digitization and informatization methods of gear quality evaluation process, proposes a gear evaluation scheme based on cloud services, develops a gear quality evaluation cloud service system, and tests it in this system. The test results show that the gear quality evaluation method based on cloud services can solve the digitization and informatization problems of the gear quality evaluation process. Cloud data storage and visual representation of gear quality evaluation results provide convenience for users to intuitively and efficiently understand gear manufacturing quality, and can effectively improve the efficiency of gear quality evaluation. The system integrates gear quality information into the gear production process through a service-oriented approach, and the service-oriented evaluation results can improve the efficiency of gear quality evaluation. The method and scheme proposed in this paper can be further popularized in the design, manufacturing, and operational status evaluation of gears.
ACKNOWLEDGEMENTS
- This project is supported by Henan Provincial Science and Technology Project (Grant NO. 222102210210), National Natural Science Foundation of China (Grant No.51775174).