-
Paper Information
- Paper Submission
-
Journal Information
- About This Journal
- Editorial Board
- Current Issue
- Archive
- Author Guidelines
- Contact Us
Journal of Mechanical Engineering and Automation
p-ISSN: 2163-2405 e-ISSN: 2163-2413
2022; 11(2): 27-42
doi:10.5923/j.jmea.20221102.01
Received: Nov. 18, 2022; Accepted: Dec. 5, 2022; Published: Dec. 14, 2022

Investigation of In-cylinder and Fuel Injection Characteristics of Direct Injection Diesel Engine Using Water Diesel Emulsion
 Abstract
 Reference
 Full-Text PDF
 Full-text HTML
Alardhi M.1, Alrajhi J.1, Alkhulaifi K.2
1Automotive and Marine Dept., College of Technological Studies, PAAET, Kuwait
2Mechanical Power and Refrigeration Dept., College of Technological Studies, PAAET, Kuwait
Correspondence to: Alardhi M., Automotive and Marine Dept., College of Technological Studies, PAAET, Kuwait.
| Email: |  |
Copyright © 2022 The Author(s). Published by Scientific & Academic Publishing.
This work is licensed under the Creative Commons Attribution International License (CC BY).
http://creativecommons.org/licenses/by/4.0/

Experimental results of in-cylinder and fuel injection characteristics measurements in direct injection diesel engine using automotive diesel (AD) and water diesel emulsion (WDE) have been investigated at two engine speeds and loads. Experimental results have shown that the magnitude of cylinder pressure of WDE during most of the cycle and peak pressures are close to those observed for AD at both speeds and loads. The late SOC for WDE causes the fuel energy to be released during most of the expansion stroke resulting in a higher cylinder pressure. Differences in WDE fuel properties such as bulk modulus, density and viscosity cause the start of fuel injection pressure rise to occur much earlier than that of AD. Although the higher bulk modulus of WDE should result in an earlier SOI, however, the opposite has been noticed here. In terms of exhaust emissions, the lower combustion temperature of WDE is expected to cause a lower NOx emission.
Keywords: Direct injection, Diesel engine, In-Cylinder, Fuel injection, Water diesel emulsion
Cite this paper: Alardhi M., Alrajhi J., Alkhulaifi K., Investigation of In-cylinder and Fuel Injection Characteristics of Direct Injection Diesel Engine Using Water Diesel Emulsion, Journal of Mechanical Engineering and Automation, Vol. 11 No. 2, 2022, pp. 27-42. doi: 10.5923/j.jmea.20221102.01.
1. Introduction
- The use of WDE in diesel engines is an easily applicable alternative fuel for the existing vehicle fleet. There is a growing interest in the use of WDE in which environmental aspects are the main driving force [1]. There may be a certain loss in engine performance due to the presence of water due to the fact of replacing fuel by water, but fuel consumption is often reduced. WDE has been shown to give several interesting effects such as reduced NOx emission and lower PM in the exhaust and improve combustion efficiency. The influence of water on the performance parameters and exhaust emissions of diesel engines has been studied by many researchers [2-7]. It has also been shown that WDE can improve engine thermal efficiency and reduce brake specific fuel consumption [8]. In all previous studies reviewed, specific fuel consumption considers the diesel component of the fuel only not the water diesel mixture.Samec et. al. [9] have made a numerical and experimental study on some of the chemical and physical properties of WDE on the combustion process of a four cylinder air-cooled DI diesel. A comparison of the exhaust emission data and specific fuel consumption for three different fuels (neat diesel fuel, 10% WDE and 15% WDE) at different operating conditions were made. NOx concentration in exhaust gas was reduced by nearly 20% and soot concentration by up to 50% with no worsening in specific fuel consumption. Their WDE results showed a better reduction in NOx and soot compared to their earlier experimental work when water was added to the fuel separately via single and multi-point injection [10-11] and with the results of other authors when other modes of water addition were applied [12]. In a similar study, Abu-Zaid [8] investigated an emulsified diesel fuel with different percentages of water by volume (0,5,10,15 and 20%) in a single cylinder DI diesel engine. He showed as the percentage of water in the emulsion increased the torque produced increased. As a result, engine power increased with the increase of water percentage. Furthermore, the 20% water emulsion improved the brake thermal efficiency about 3.5% over the use of neat diesel fuel. The BSFC and exhaust temperature were decreased as the percentage of water in the emulsion was increased. In addition, the exhaust temperature for the emulsion was always lower than that of standard diesel. It is clear, as the percentage of water in the emulsion increased, the exhaust temperature decreased.Tsukahara and Yoshimoto [13] investigated standard diesel fuel and WDE (51% by mass water) on a single cylinder direct injection diesel engine at three different compression ratios and various inlet air velocities and fuel injection timing. With WDE, the concentration of NOx was lower than standard diesel fuel for all inlet air velocities. Also, the BSFC decreased with WDE for low inlet air velocity whereas at high air velocity BSFC has increased. Furthermore, the BSFC and NOx for WDE decreased below standard diesel fuel values at all injection timings. Within the range of their experimental work, the BSFC for both fuels tends to increase with decreasing compression ratio whereas the concentration of NOx was almost constant. Other experimental work with emulsified fuel [13-16] also showed a reduction in NOx and smoke with no noticeable increase in the BSFC.
2. Results and Discussion
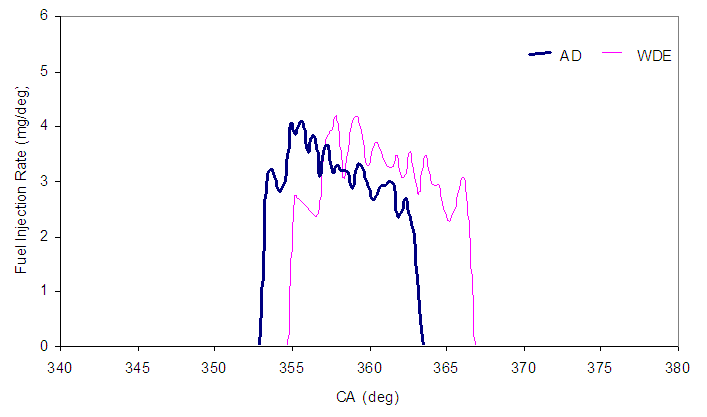
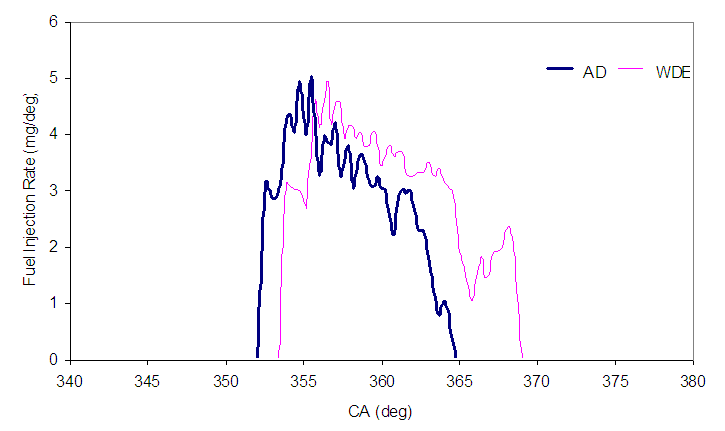
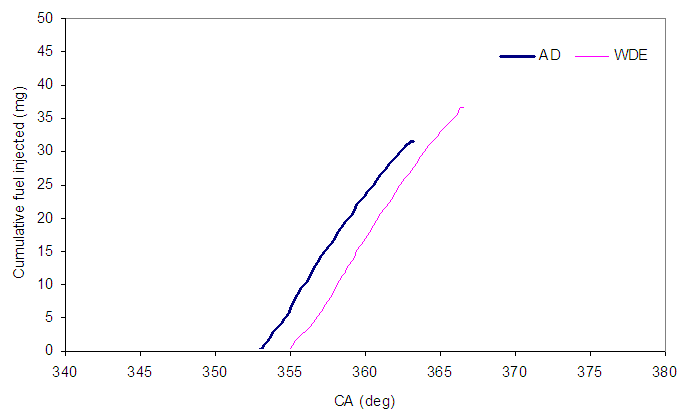
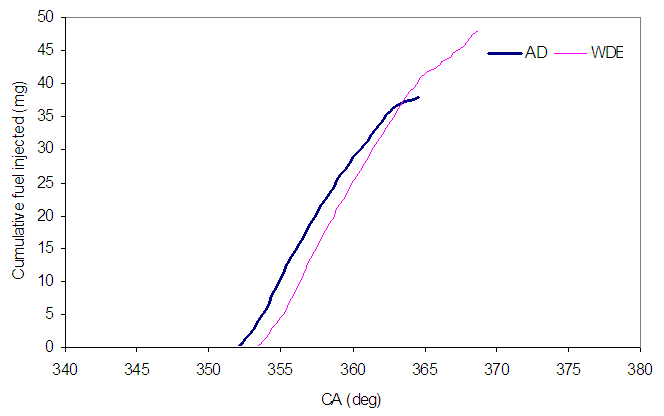
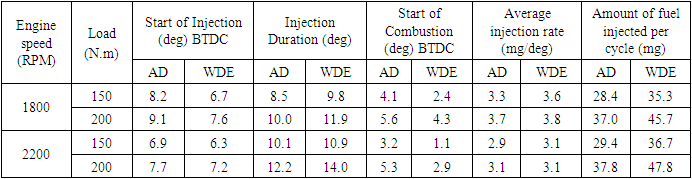
- In-Cylinder Pressure and Fuel InjectionThe in-cylinder pressure data were used to calculate average exhaust gas temperature of the engine at different test points. Pressure traces were smoothed using a five-point moving. Fuel injection pressure and needle lift have been used to calculate the rate and cumulative fuel injected within the cycle. Due to the large amount of data available for each test point, only two test points (1800 and 2200 RPM) are presented here in detail for discussion purposes. Before going into the explanation of WDE combustion behavior it is important to see the difference in fuel injection characteristics for both fuels.Effect of WDE on Fuel Injection CharacteristicsFigures 1 to 16 show fuel injection pressure, instantaneous rate of fuel injection and cumulative fuel injected for the two fuels at different engine speeds and both loads. In some other WDE studies [17,18] the fuel injection timing was retarded in order to obtain the highest reduction in exhaust emissions (NOx and HC) and obtain the best engine performance. In this work injection timing was kept at its standard timing (14° BTDC). This does not change the fact that a shift from the standard injection timing was observed from test point to another during the experimental work. Fuel injection pressure duration increases with the increase of engine speed and decreases with the increasing of engine load, Figures 1 to 4. Engine load has a major effect on increasing the magnitude of fuel injection pressure due to longer effective plunger stroke. A sample of needle lift curves are also shown in Figures 1 and 2. However, fuel injection rate will be used instead of needle lift since it accounts for both fuel injection duration and the rate.From Figures 1 to 4, the main differences between the two fuel injection pressure curves are the earlier fuel injection pressure rise for WDE at all engine speeds and loads and its longer duration. The higher bulk modulus of WDE results in an earlier fuel injection pressure rise and longer injection duration. Also, the higher viscosity (9%) of WDE leads to reduced fuel leakage during the injection process and thus faster fuel pressure rise. However, the start of injection (SOI) retards for WDE which might be the reason of having different behavior between stabilized and unstabilized emulsions when subjected to high pressure.
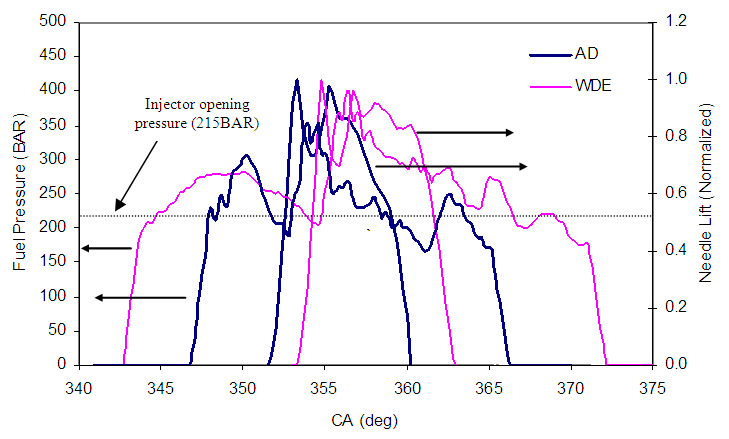 | Figure 1. Fuel injection pressure and needle lift for both fuels at 1800RPM and 150N.m. |
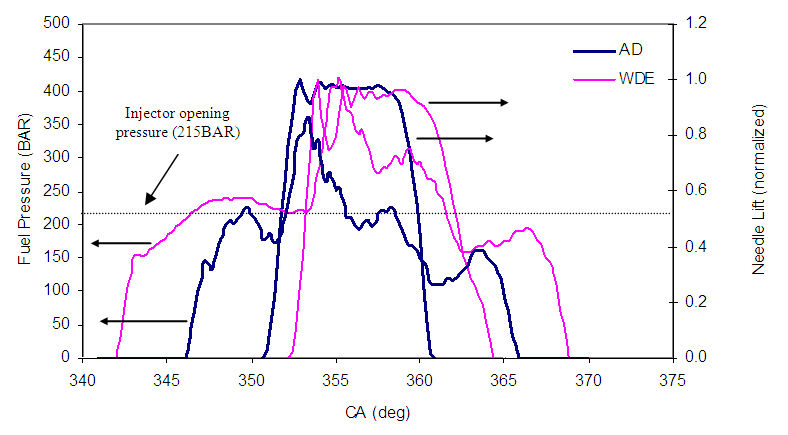 | Figure 2. Fuel injection pressure and needle lift for both fuels at 1800RPM and 200N.m. |
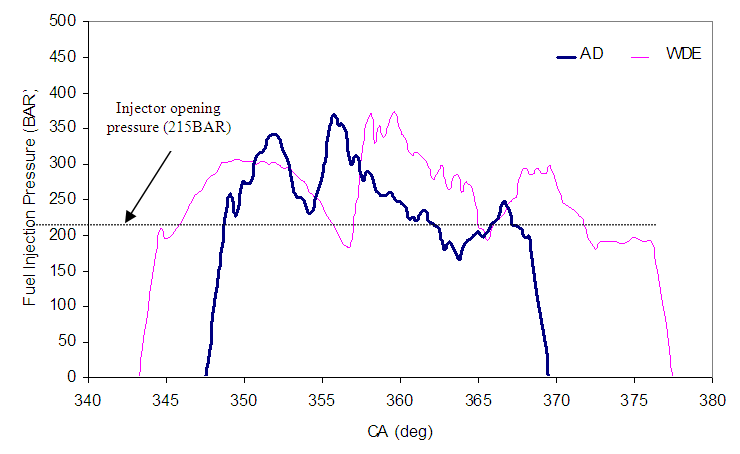 | Figure 3. Fuel injection pressure for both fuels at 2200RPM and 150N.m |
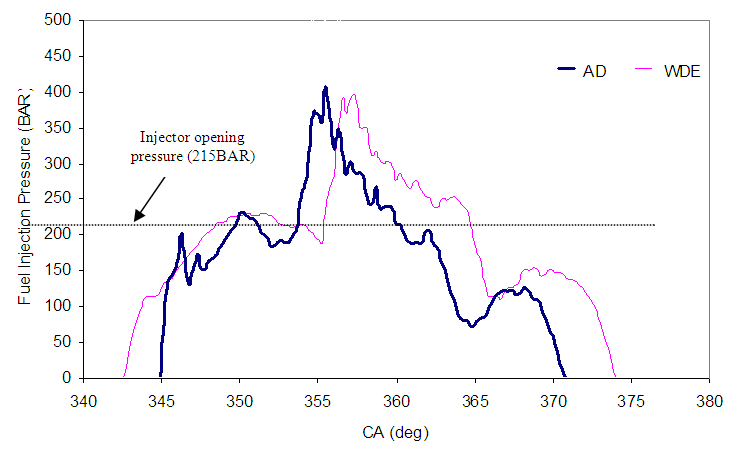 | Figure 4. Fuel injection pressure for both fuels at 2200RPM and 200N.m |
 | (1) |
 is the pressure drop across the injector nozzle. From the above relation, the cumulative fuel injected during each increment of the injection process can be estimated as,
 | (2) |
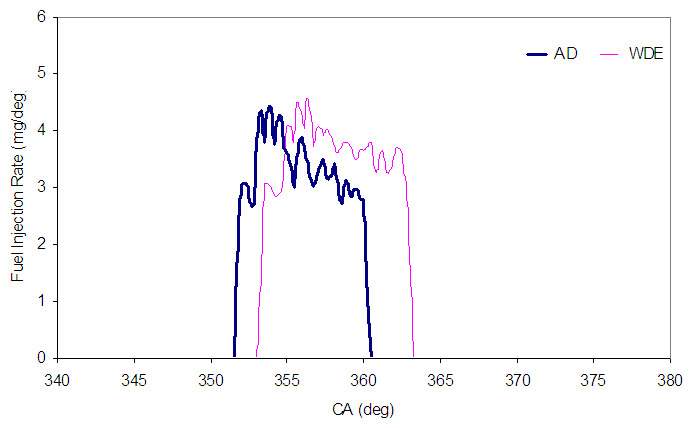 | Figure 5. Instantaneous Fuel injection rate for both fuels at 1800RPM and 150N.m |
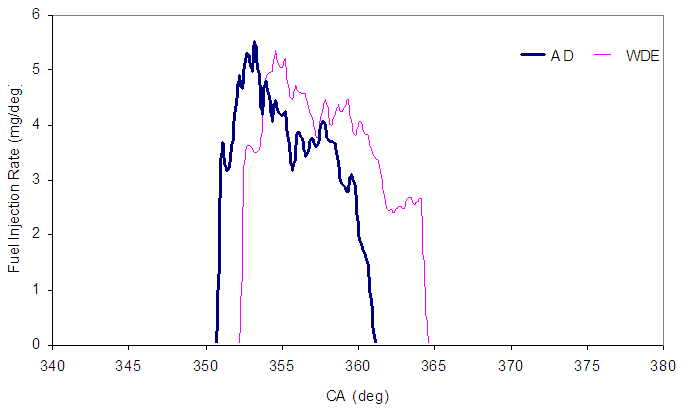 | Figure 6. Instantaneous Fuel injection rate for both fuels at 1800RPM and 200N.m |
 | Figure 7. Instantaneous Fuel injection rate for both fuels at 2200RPM and 150N.m |
 | Figure 8. Instantaneous Fuel injection rate for both fuels at 2200RPM and 200N.m |
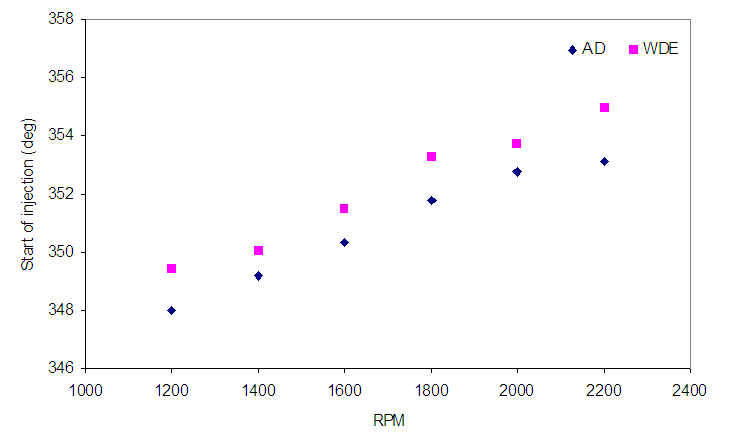 | Figure 9. The Start of Injection (SOI) for the two fuels at all engine speeds and 150N.m |
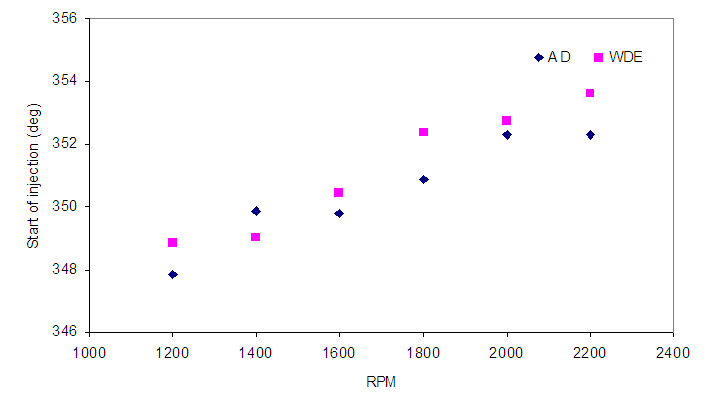 | Figure 10. The Start of Injection (SOI) for the two fuels at all engine speeds and 200N.m |
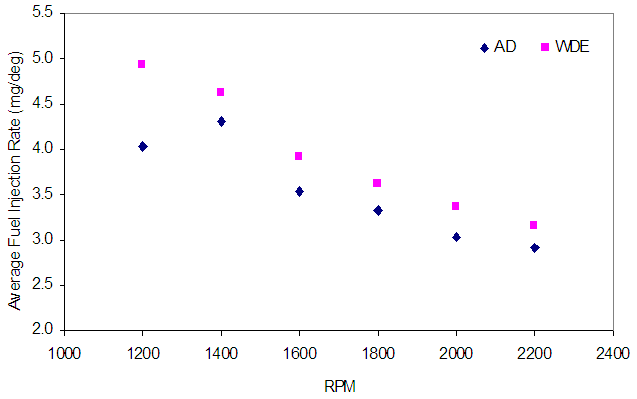 | Figure 11. The overall average fuel injection rate for both fuels at all engine speeds and 150N.m |
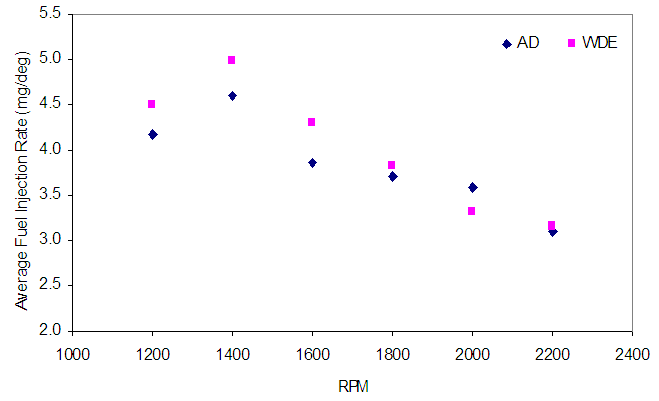 | Figure 12. The overall average fuel injection rate for both fuels at all engine speeds and 200N.m |
 | Figure 13. Cumulative fuel injected for both fuels at 1800RPM and 150N.m |
 | Figure 14. Cumulative fuel injected for both fuels at 1800RPM and 200N.m |
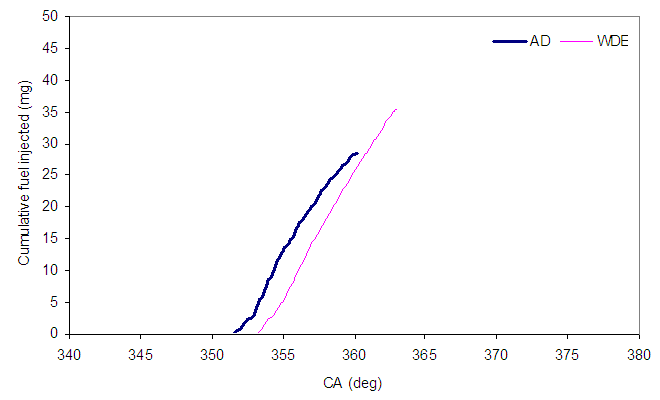
 | Figure 15. Cumulative fuel injected for both fuels at 2200RPM and 150N.m |
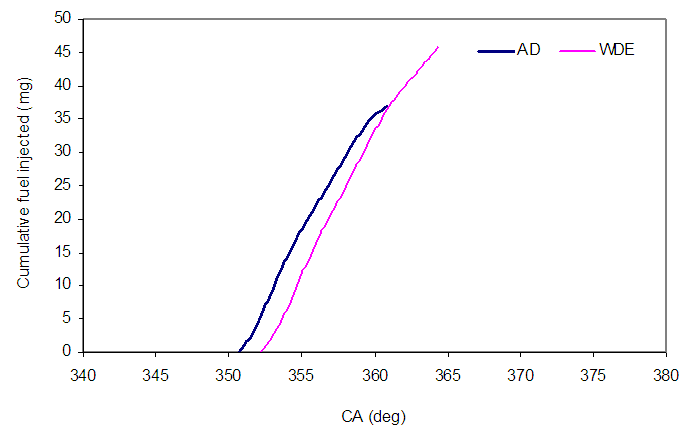
 | Figure 16. Cumulative fuel injected for both fuels at 2200RPM and 200N.m |
|
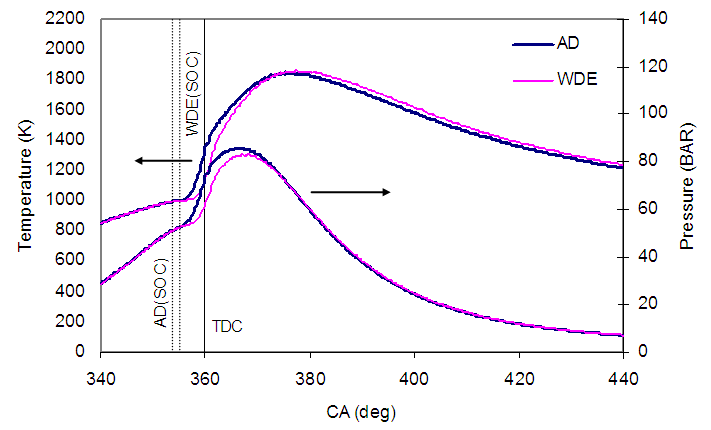
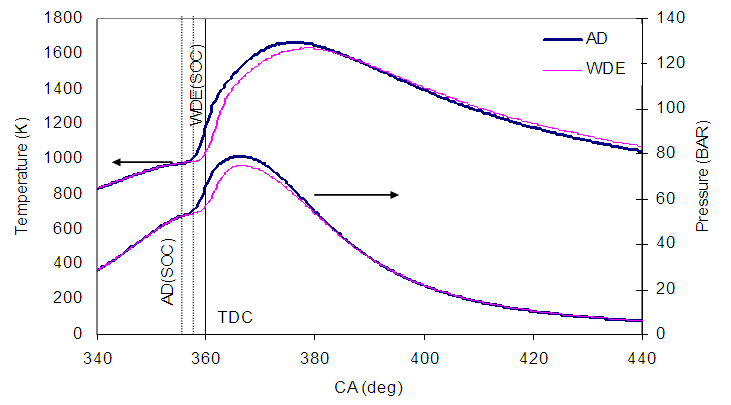 | Figure 17. In-cylinder pressure and temperature measurements for both fuels at 1800RPM and 150N.m |
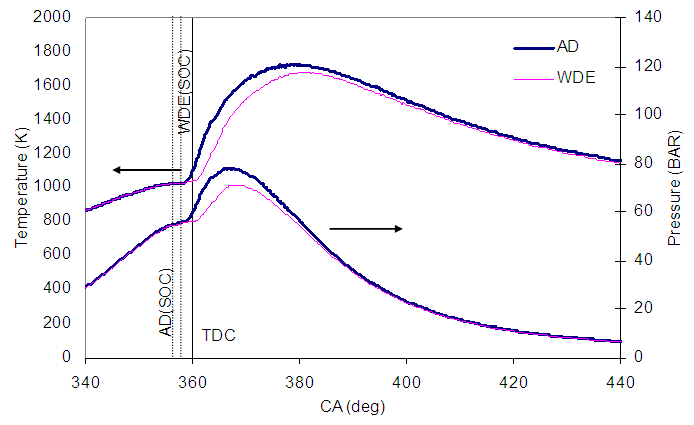
 | Figure 18. In-cylinder pressure and temperature measurements for both fuels at 1800RPM and 200N.m |
 | Figure 19. In-cylinder pressure and temperature measurements for both fuels at 2200RPM and 150N.m |
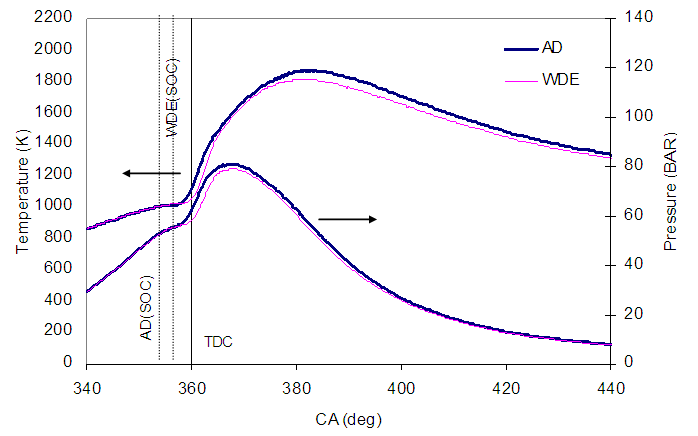 | Figure 20. In-cylinder pressure and temperature measurements for both fuels at 2200RPM and 200N.m |
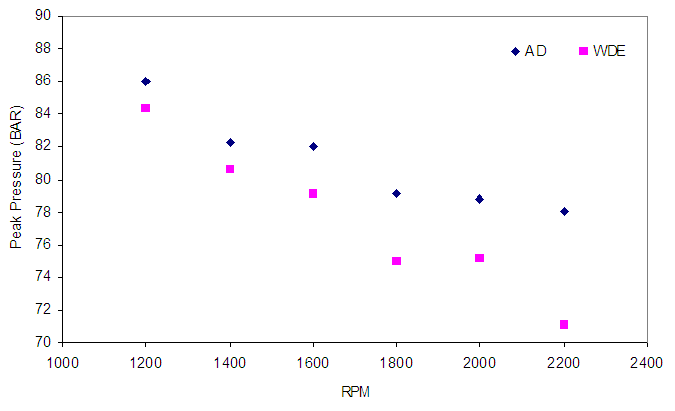 | Figure 21. Cylinder peak pressure values at all engine speeds for both fuels and 150N.m |
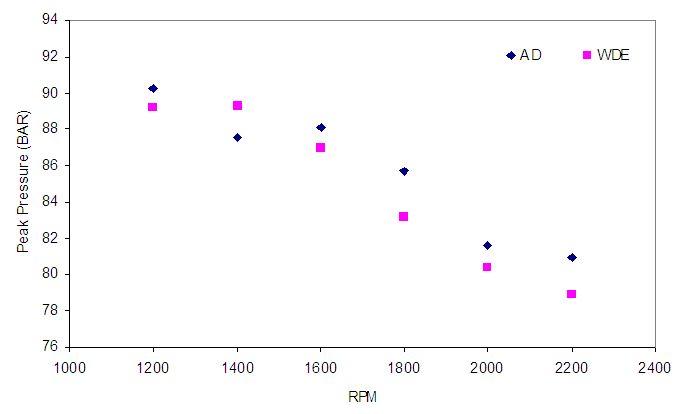 | Figure 22. Cylinder peak pressure values at all engine speeds for both fuels and 200N.m |
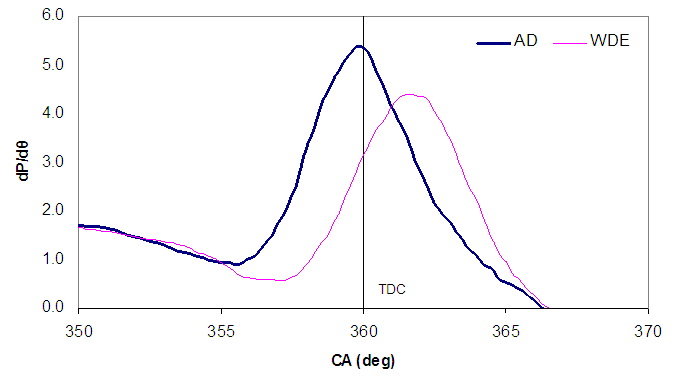 | Figure 23. Rate of pressure rise for both fuels at 1800RPM and 150N.m |
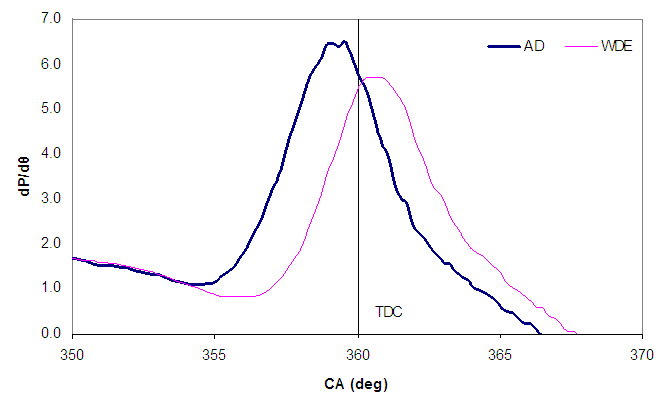 | Figure 24. Rate of pressure rise for both fuels at 1800RPM and 200N.m |
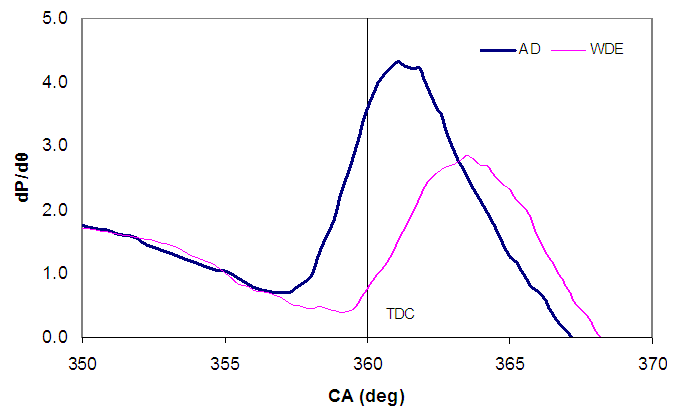 | Figure 25. Rate of pressure rise for both fuels at 2200RPM and 150N.m |
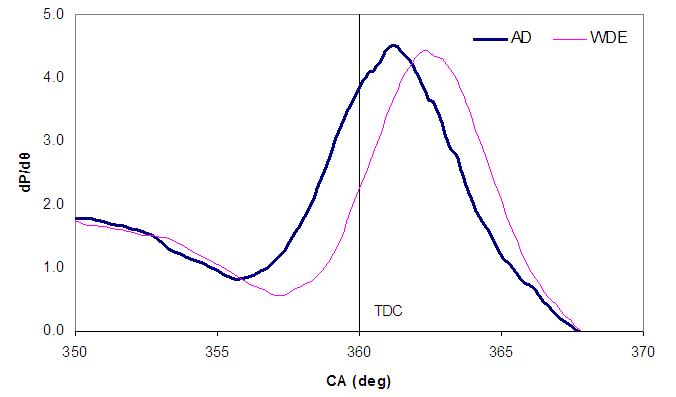 | Figure 26. Rate of pressure rise for both fuels at 2200RPM and 200N.m |
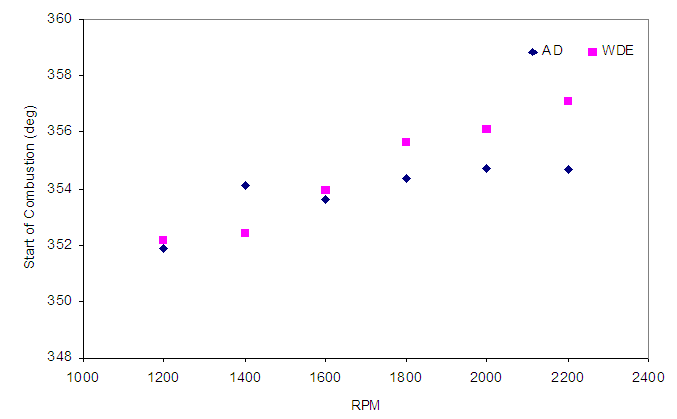
 | Figure 27. The Start of combustion (SOC) for the two fuels at all engine speeds and 150N.m. |
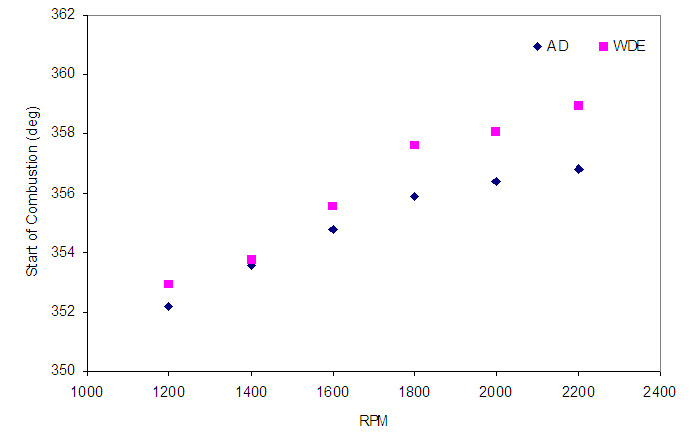
 | Figure 28. The Start of combustion (SOC) for the two fuels at all engine speeds and 200N.m |
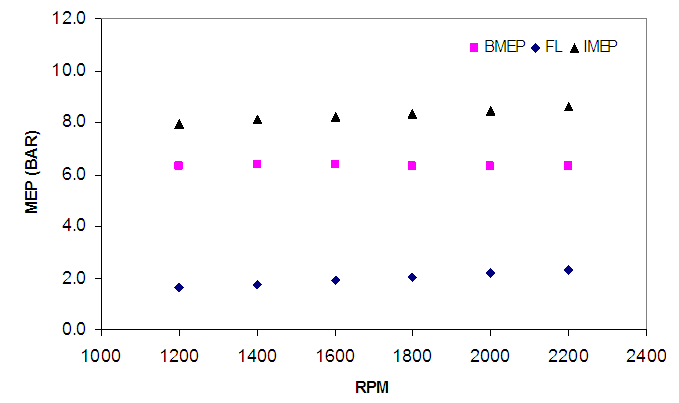
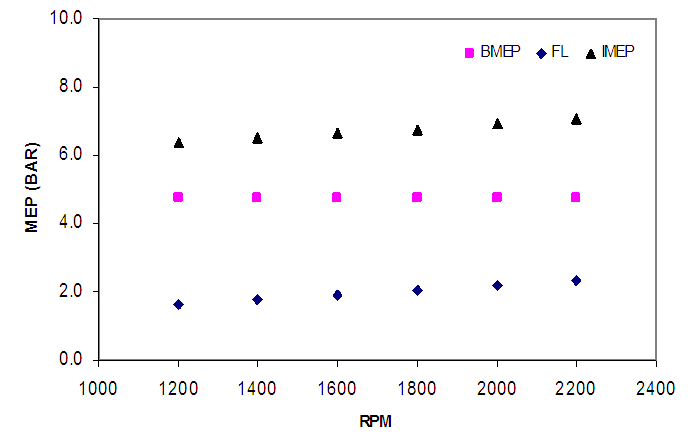 | Figure 29. Experimental IMEP, BMEP and FL at all engine speeds and 150N.m using AD |
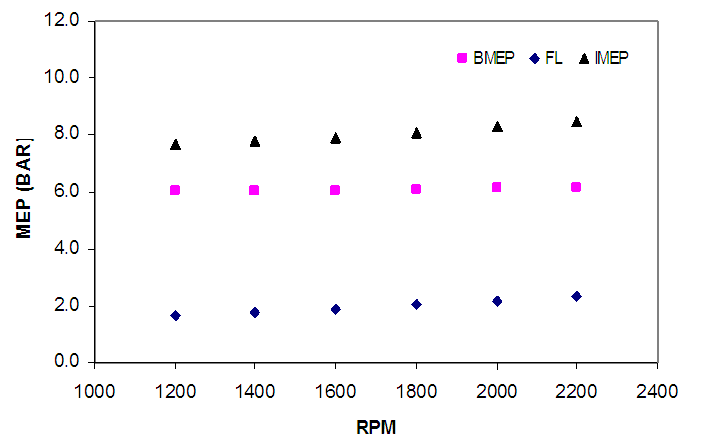
 | Figure 30. Experimental IMEP, BMEP and FL at all engine speeds and 200N.m using AD |
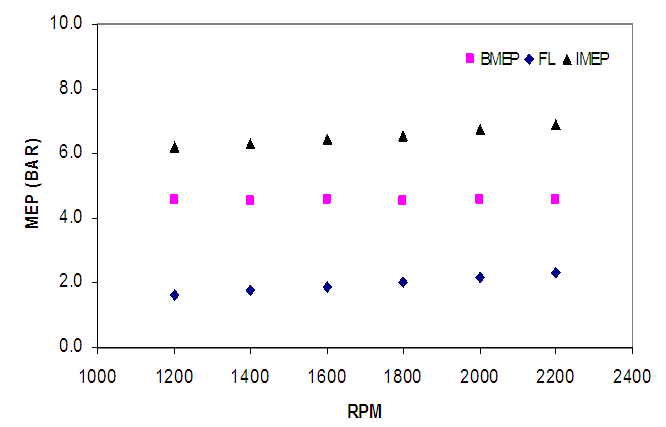 | Figure 31. Experimental IMEP, BMEP and FL at all engine speeds and 150N.m using WDE |
 | Figure 32. Experimental IMEP, BMEP and FL at all engine speeds and 200N.m using WDE |
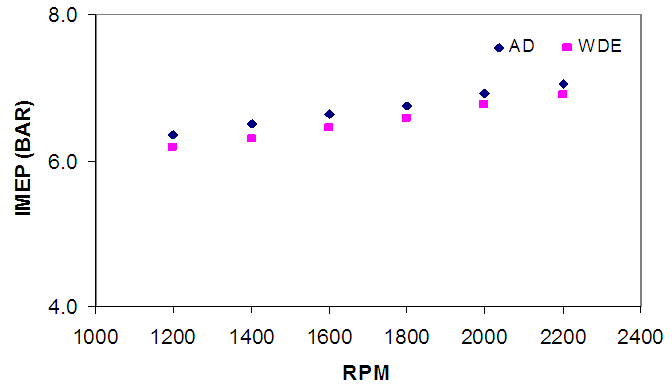 | Figure 33. The difference in the IMEP between the two fuels at all engine speeds and 150N.m |
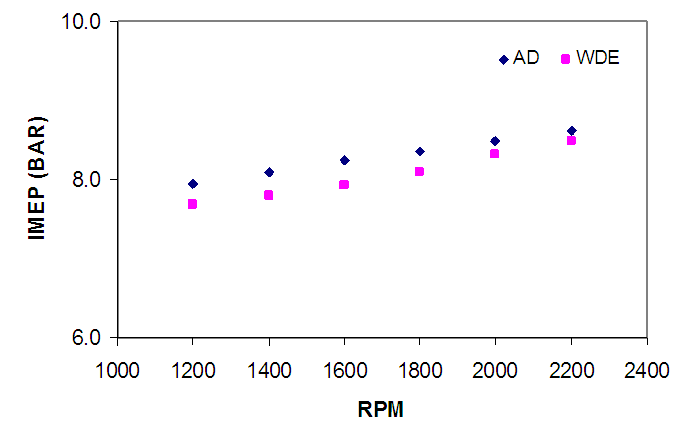 | Figure 34. The difference in the IMEP between the two fuels at all engine speeds and 200N.m |
3. Conclusions
- Experimental work on direct injection diesel engine using AD and WDE at two engine speeds and loads have been investigated. In terms of combustion behaviour, WDE can be regarded as an alternative for automotive diesel fuel. The magnitude of cylinder pressure during most of the cycle and peak pressures are close to those observed for AD at any speed and load. WDE cylinder pressures get closer to that of AD at higher engine load (200N.m). The late SOC for WDE causes the fuel energy to be released during most of the expansion stroke resulting in a higher cylinder pressure. Because WDE has lower energy than AD (12% less), more fuel volume is required per cycle in order to deliver the same engine brake power. The fuel injection characteristics of WDE are quite different to that of AD. Differences in WDE fuel properties such as bulk modulus, density and viscosity cause the start of fuel injection pressure rise to occur much earlier than that of AD. Although the higher bulk modulus of WDE should result in an earlier SOI, however, the opposite is occurring here. It is causing a late SOI for WDE and consequently late SOC. In terms of exhaust emissions, the lower combustion temperature of WDE is expected to cause a lower NOx emission.