-
Paper Information
- Paper Submission
-
Journal Information
- About This Journal
- Editorial Board
- Current Issue
- Archive
- Author Guidelines
- Contact Us
Journal of Mechanical Engineering and Automation
p-ISSN: 2163-2405 e-ISSN: 2163-2413
2022; 11(1): 9-18
doi:10.5923/j.jmea.20221101.02
Received: Mar. 9, 2022; Accepted: Mar. 28, 2022; Published: Apr. 15, 2022

Experimental Study on the Formation Law of CaCO3 Scale and the Correlation Degree of Influencing Factors
 Abstract
 Reference
 Full-Text PDF
 Full-text HTML
Xiaozhuan Chen, Pan Wang, Yongfu Li, Chenzhao Wu, Xiaoru Hao
School of Mechanical and Power Engineering, Henan Polytechnic University, Jiaozuo, PR China
Correspondence to: Xiaozhuan Chen, School of Mechanical and Power Engineering, Henan Polytechnic University, Jiaozuo, PR China.
| Email: |  |
Copyright © 2022 The Author(s). Published by Scientific & Academic Publishing.
This work is licensed under the Creative Commons Attribution International License (CC BY).
http://creativecommons.org/licenses/by/4.0/

Scale is a problem that has not been solved thoroughly in industry and academia. An experimental system was built in order to study the effects of heat flux, bulk fluid temperature Tb, and solution hardness & flow velocity on scale formation. Preliminary experiments were conducted to test the reliability and stability of the experimental apparatus. The experiments revealed growth law of thermal resistances under four action factors. The experimental results showed that the bulk fluid temperature Tb had important influence on the formation process of scale. When Tb increases from 24°C to 28°C, the fouling resistances increase from 1.46×10⁻⁴ m2·K/W to 3.01×10⁻⁴ m2·K/W. The fouling resistances decrease with the increase of flow velocity. Four important factors were ranked from greatest to least in the following order: heat flux, Tb, solution hardness and flow velocity under the guidance of grey relational analysis method. Calcium carbonate crystal particles precipitate out from the metastable solution. The type of fouling deposited on inside surface of copper pipe from microparticles in solution can be defined as particulate fouling. Therefore, the fouling deposited on the inside surface of the copper pipe should be named composite fouling included crystallization fouling and particulate fouling, based on the whole process of scale precipitated from solution. These research results can provide theoretical basis for the prevention and removal of scale on the surface of heat exchanger.
Keywords: Crystallization fouling, Particulate fouling, Induction period, Fouling resistance, Grey relational analysis
Cite this paper: Xiaozhuan Chen, Pan Wang, Yongfu Li, Chenzhao Wu, Xiaoru Hao, Experimental Study on the Formation Law of CaCO3 Scale and the Correlation Degree of Influencing Factors, Journal of Mechanical Engineering and Automation, Vol. 11 No. 1, 2022, pp. 9-18. doi: 10.5923/j.jmea.20221101.02.
Article Outline
1. Introduction
- Fouling, the deposition of dissolved salts on heat transfer surfaces severely diminishes the heat transfer rate and increases the pressure drop of process equipment and fluid machinery, such as heat exchangers. Because of fouling, operation and maintenance costs of the processes increase significantly. Fouling of heat transfer surfaces is a serious problem that affects the design and operation of heat exchangers [1,2]. Fouling involves the formation of deposits of low thermal conductivity on heat transfer surfaces, leading to degradation in the rate of heat transfer. At the design stage, fouling is accounted for by increasing the heat transfer surface area. According to Zhang et al. [3] Seawater contains a lot of minerals, which will cause a lot of scales to precipitate on the heat exchange equipment. Therefore, the heat exchange efficiency of the equipment will be greatly reduced. In addition, increased carbon dioxide emissions due to the rise of energy consumption can cause a series of global problems such as El Nino phenomenon and extreme weather [4]. Therefore, environmental disruption and economic effects can be reduced to a certain extent by decreasing the fouling on heat transfer surfaces.Dissolved inverse soluble mineral salts in cooling water of thermal power plant such as calcium carbonate, calcium sulphate, calcium silicate, etc. often contribute to the formation of these scales. Normally scales form from the accumulation of precipitation of mineral salts from water on metallic surfaces. Fouling is a complex phenomenon and its prediction, which is still an open question based on the current knowledge. It is clear that many parameters have significant effects on crystallization fouling. The operating conditions of the experimental system for example: flow velocity, wall and bulk temperatures, and solution properties but also the geometry of the heat transfer surface (tube type, thickness of the laminar boundary layer, shear forces) affect the formation of the deposition layer on heat transfer surfaces [5,6]. Therefore, it is very difficult to define accurately these effects for all the cases but they need to be studied specifically. Pääkkönen and Riihimäki et al. [7,8] investigated change rule of fouling resistance under different flow velocities and the heat fluxes. Results showed that increasing the heat flux slightly increased the linear growth rate of the fouling resistance. This was caused by the increase in the initial wall temperature that was about 9°C between the heat fluxes 52.5 kW/m2 and 61.8 kW/m2. The increase in the flow velocity from 0.20 m/s to 0.40 m/s changed the initial wall temperature about 15°C that explained the stronger changes in the fouling rate when the flow velocity varied. Zhang et al. [9] studied the effect of concentration in particulate fouling tests, whereas the effect of fluid velocity was studied in composite fouling tests. The foulants used in the particulate fouling test are Al2O3 whose concentration is 1000 mg/L, 2000 mg/L, and 3000 mg/L. The foulants used in composite fouling tests are the compounds of NaHCO3 and CaCl2 and Al2O3 particulates. The average velocity of composite fouling tests is 0.2 m/s, 0.4 m/s and 0.6 m/s. A composite fouling test was carried out at an inlet temperature of 50°C to compare with the composite fouling test. Kazi et al. [10,11] informed the investigation of calcium sulphate deposition on four different metal surfaces: copper, aluminum, brass, and stainless steel 316, and a polycarbonate surface. It was revealed that the fouling increases with time but at a decreasing rate according to a well-designed experiment system. The deposition on the metallic surface can be considered to increase with increasing thermal conductivity and decreasing total surface energy over the range of experiment. Low surface energy materials such as polycarbonate can cause less attraction to the floating crystals and receive less deposition in comparison to the surface.At the initial stage of the fouling experiments, an induction period is detected. During the induction period, the fouling resistance does not increase and remains zero basically. When the induction period ends, the first crystals start to grow on the heat transfer surface. The importance of the induction period should not be underestimated [12,13]. If a comprehensive knowledge existed of why and how induction period occurred, then it can be possible to exploit this knowledge and extend the induction period indefinitely. Fouling process is commonly preceded by an induction period (or initiation period) in which no significant change on thermal resistance is observed with time increasing, with exception of fouling under boiling conditions. The induction period can be from a few minutes in a laboratory experiment to one month or so in thermal power plant or refinery equipment. A number of researchers have observed the induction period phenomenon under non-boiling conditions and tried to explain this phenomenon for a wide range of fouling mechanisms. Yang et al. [14] assumed that active foulants species stick to the surface and gradually cover it, the rate of change of surface coverage being proportional to the fractional free surface. The new model was proposed in order to describe the fouling process from the start of the induction period up to the steady fouling rate stage using a single and simple mathematical expression. The model quantitatively described the influence of the surface temperature on the length of the induction period for the crude oil and whey protein fouling systems. The model also described in a semi-quantitative manner the influence of velocity on the induction period. Mwaba et al. [15] discovered four distinct time regions during crystallization fouling experiments: A region where the fouling thermal resistance is zero; A region where the fouling thermal resistance is negative; A region where the fouling resistance increases steadily; A region where the fouling thermal resistance remains constant. Each of these regions can be matched with different development phases in the crystallization fouling process: nucleation phase, growth phase and asymptotic phase. Overall, the fouling curves exhibit an S-curve, characteristic of the logistic curve. A new correlation based on the solution of the logistic equation was formulated.Peyghambarzadeh et al. [16] performed an experimental study to examine role of generating bubble on the heat transfer fouling in an annular heat exchanger. A scientific comparison was performed to investigate fouling of suspended particles under forced convective and subcooled flow boiling heat transfer. In the particulate fouling experiments, the base liquid was pure n-heptane and a-Al2O3 microparticle was added to the base fluid as the foulants in different concentrations including 0-200 mg/l. In the crystallization fouling experiments, CaSO4 aqueous solutions were prepared in different concentration up to 4 g/l. In the meantime, a suitable in-line filter was installed before the test section to remove all probable CaSO4 particles from the test fluid to avoid any interference of suspended particles in the crystallization fouling experiment. Experiments showed that increasing the fluid velocity can decrease the particulate fouling resistance due to higher shear stress and hydrodynamic lift force exerted on the heat transfer surface. Chen et al. [17] carried out a comparative study on the electrical conductivity of solutions and calcium ion concentration before and after treatment. The pictures of copper tubes before and after experiments are shown in the Figure 1. However, the law of some important parameters in the process of scale formation is not very clear. Most scholars have carried out research on particulate fouling using TiO2, Fe2O3, SiO2, Al2O3, MgO particles[18-21]. Other researchers began to notice the connection between the two types of fouling. Zhang et al. [9] conducted clean tests of heat transfer and fluid flow and fouling tests of particulate fouling and composite fouling in four commercially available corrugated plate heat exchangers. The foulants used in composite fouling tests are the compounds of precipitation fouling, NaHCO3 and CaCl2, and particulate fouling, Al2O3 particulates. Kang Sub Song et al. [22] measured and analyzed the composite fouling characteristics of CaCO3 and CaSO4 in plate heat exchangers. The composite fouling here refers to a mixture of two kinds of scale crystals. In the particulate fouling experiment performed by Peyghambarzadeh et al., the base liquid is pure n-heptane. Meanwhile α-Al2O3 microparticle were added to the base fluid as the foulants in different concentrations. In the crystallization fouling experiments, CaSO4 aqueous solutions are prepared in different concentration up to 4 mg/l.
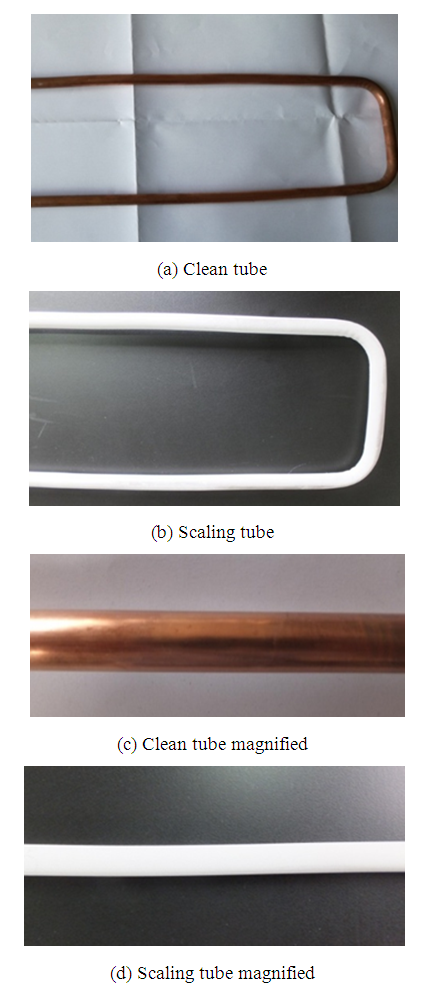 | Figure 1. Comparison between clean tube and scaling tube |
2. Experimental Set-up
2.1. The Apparatus
- The experimental set-up used for the fouling experiments is illustrated in Figure 2. The photo of the experimental platform is shown in Figure 3. The piping and fittings are made of the polyethylene-aluminum composite pipeline (Foshan Rifeng Enterprise Co., Ltd. CHINA). The main flow loop comprises a centrifugal pump, turbine flowmeters, test section, and a thermostatically controlled water bath to maintain circulating water bath at a constant temperature. The centrifugal pump (Shanghai Shangcheng Pump and Valve Manufacturing Co., Ltd. CHINA) has the specification of 2840 rpm, 550 W motor, and the maximum flow is 2.5 m3/h, with the maximum head is 10 m. The test section has electric heating tapes that can continuously heat copper pipes. The cooling circulating water bath should be installed for keeping the bulk temperature of the tank at the required magnitude. About -5~20°C cooling water can be provided with the help of a cooling circulating water bath (Ningbo Tianheng Instrument Factory Co., Ltd. CHINA). Volume of a cuboid water tank at the center of bath is 20L. Spiral copper coil tube is immersed in cooling water. Outflowing from the test section, solution flows through the spiral copper coil. Therefore, this experiment system can be maintained for heat balance, and the inlet temperature of solutions can remain approximately equivalent. Test section is the core part of overall experiment system. Four thermocouples are embedded in outside surface at different axial positions along axial direction of the copper tube. These thermocouples are fixed in the form of soldering. The copper tube is entwined with electric heating ribbon in order to heat the solutions flowing through tube. The outside of the copper pipe is covered with aluminum silicate insulation materials. The main purpose is as much as possible to reduce the heat dissipation of the environment. Agilent data acquisition instrument is used to record the wall temperature of copper tube and bulk fluid temperature of the solution passing through the test section. Both the wall temperature of copper tube and bulk temperature of the solution are measured by using a K-type thermocouple. The program is set to record temperatures every 3 min. In order to accelerate the fouling effect, the initial water hardness for all experiments was performed. Artificial hard water was prepared by using a mixture of sodium bicarbonate (NaHCO3) and calcium chloride (CaCl2). When these two chemicals are singly dissolved in deionized water, the following balanced equation results:
 | (1) |
 | (2) |
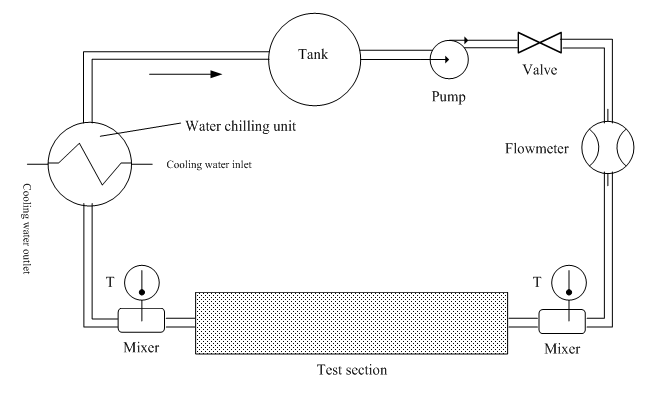 | Figure 2. Schematic diagram of the test apparatus |
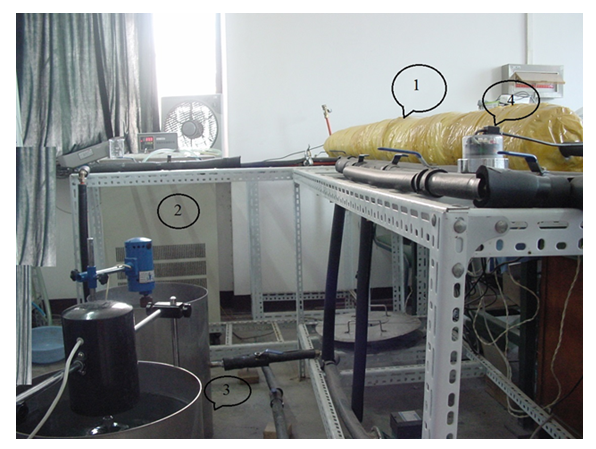 | Figure 3. The photo of the experimental platform: 1 Test section, 2 Water chilling unit, 3 Tank, and 4 Flowmeter |
2.1.1. The Fouling Resistance
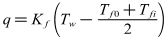
- As indicated in Eq. (3), the fouling resistance Rf is calculated from the initial value of the heat transfer coefficient and its value at t>0.
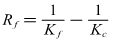 | (3) |
 | (4) |
 | (5) |
 | (6) |
 | (7) |
 | (8) |
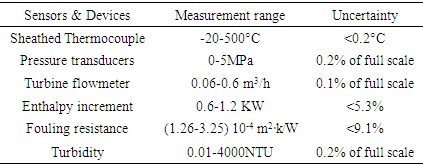
2.1.2. Experimental Uncertainty
- The measurement instruments used in this study include sheathed thermocouple, absolute pressure transducers, and turbine flowmeter, which are calibrated to relevant national standards. The experimental uncertainties associated with sensors in use and calculated parameters are listed in Table 1. The uncertainty is obtained from the correlative calculations.
|
2.2. Preliminary Experiment for Inspection System Accuracy
- Before the fouling experiment, in order to test the reliability of the experimental apparatus, especially the accuracy of the temperature and flow parameter measurement, a series of preliminary experiment for inspection system accuracy were conducted. These experiments included thermal equilibrium experiment and the forced convective heat transfer experiment.
2.2.1. Thermal Equilibrium Experiment
- The deionized water is circulated to the test section from tank by pumping it through test section. Electrical heating belts of winding outside of test section gone into operation, outlet temperature began to improve. When the outlet temperature of deionized water achieves to a desired value, flow rate and other important experimental data were recorded. According to the Eq.(7), the enthalpy increment Q of solution flowing through the test section can be calculated. Then it is compared with electrical heating power P which can be calculated through the product of voltage and current value, and the relative error of the two results can be calculated. The main purpose of this experiment is to determine heat insulation effect of the test section.
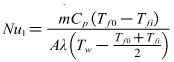
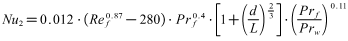
2.2.2. Forced Convection Heat Transfer Experiment Inside Tube
- Firstly Nusselt number Nu1 of forced convection heat transfer inside tube through experiments can be tested. Secondly the other Nusselt number Nu2 can be calculated based on experimental correlation such as Gnielinski formula mentioned in many heat transfer textbooks. Then the absolute value of relative error of two Nusselt numbers obtained in different ways can be calculated. The main purpose of this experiment is to investigate reliability and scientificity of the parameters such as wall temperature and flow measurement.
 | (9) |
 | (10) |
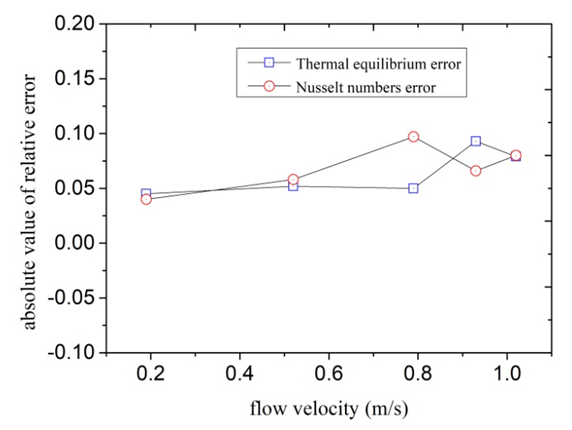 | Figure 4. Experimental results of heat balance and forced convection heat transfer |
3. Results and Discussion
3.1 Fouling Resistance Changing with the Heat Flux
- When the inlet temperature of solution keeps constant, the global fouling resistance Rf is directly related to the heat flux q and flow velocity u according to the Eq. (3), Eq. (5) and Eq. (8). Therefore, in order to investigate the effect of the heat flux on fouling resistance at approximatively equal initial wall and bulk temperatures, it is necessary to keep flow velocity constant. The initial wall temperature of the heated copper tube is a result of the heat flux and flow velocity when the bulk temperature is constant. This series of experiments mainly investigated effect of heat flux and flow velocity on fouling. Experimental conditions are listed as follows: Artificial high hardness of solution is 100 dm3, and solution hardness is 1000°. In the studied case firstly, the fouling rate increases with the increasing heat flux when the flow velocity remains 0.50 m/s. The input voltage of electric heating zone was adjusted each in order that heating capacity was set at 600,800,850,1200W. Thus, the heat flux was 9.95, 13.3, 14.1, 19.9 kW/m2 under the premise of no heat loss of the test section. When the scale is deposited on the inner wall, the scale deposition gets more and more thick. Therefore, the wall temperature of the heated copper tube becomes more and more high. The variation trends of wall temperature are clearly seen in Figure 5. The variation trends of fouling resistance can be shown in Figure 6.
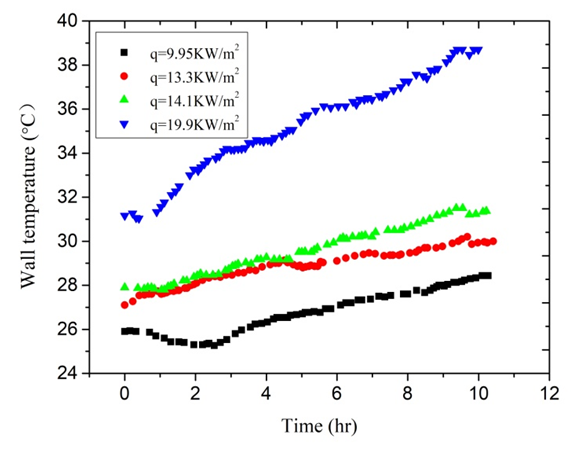 | Figure 5. The variation trends of wall temperature |
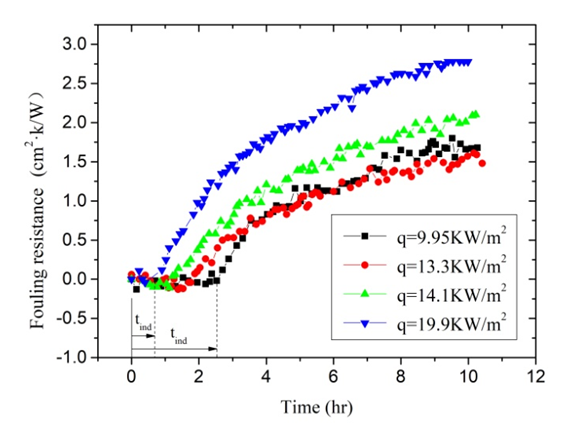 | Figure 6. The fouling resistance under different heat flux |
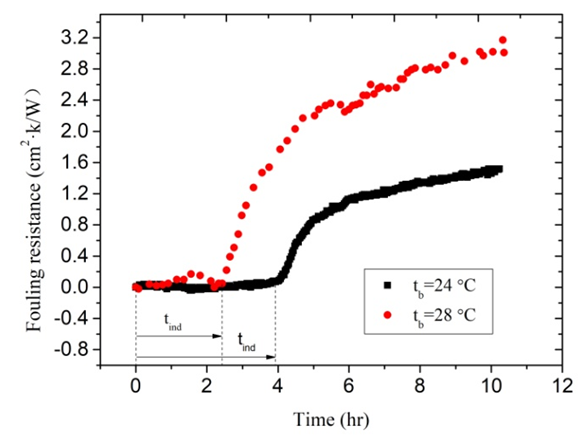
3.2. Fouling Resistance Changing with Bulk Fluid Temperature
- These experiments investigated mainly the effect of Tb on the calcium carbonate scale formation process. Experimental conditions are listed as follows: Artificial high hardness of solution is 100 dm3, and solution hardness is 1000°. The flow velocity remains 0.74 m/s. The input power of electric heating zone was set to 1200W. Thus, the heat flux was 19.9 kW/m2 under the premise of no heat loss of the test section. The two experiments were carried out in different environment temperature. Experiment 2 was done in autumn when ambient temperature is higher. So the inlet temperature of solution is higher compared with Experiment 1 that was performed in winter. The variation trends of fluid temperature and wall temperature are clearly seen in Figure 7. The variation trends of fouling resistance can be clearly seen in Figure 8. Tb has important influence on the calcium carbonate scale formation process. The solubility of calcium carbonate in solutions was directly influenced owing to changes of Tb. The fouling resistances increase with the increasing of Tb. When Tb increases from 24°C to 28°C, the fouling resistances increase from 1.46×10⁻⁴ m2·K/W to 3.01×10⁻⁴ m2·K/W. Relatively the increase rate is 106.8%. In addition, it is worth noting that Tb has great influence on the length of the induction period during the fouling process. As can be seen from Figure 8, tind is 3.61 hours when Tb is 24°C. When Tb increases from 24°C to 28°C, tind decreased to 2.21 hours.
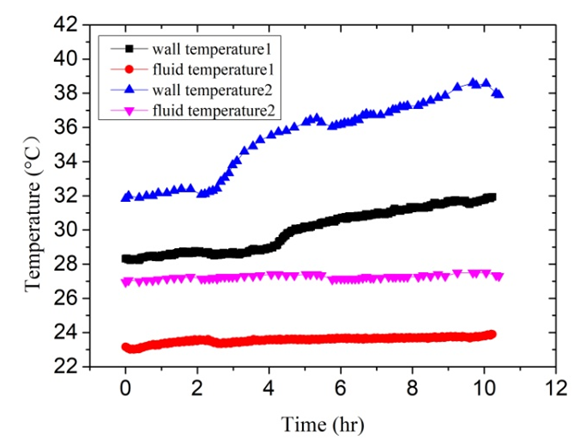 | Figure 7. The variation trends of bulk fluid temperature and wall temperature based on Experiment 1 and 2 |
 | Figure 8. The fouling resistance under different bulk fluid temperature |
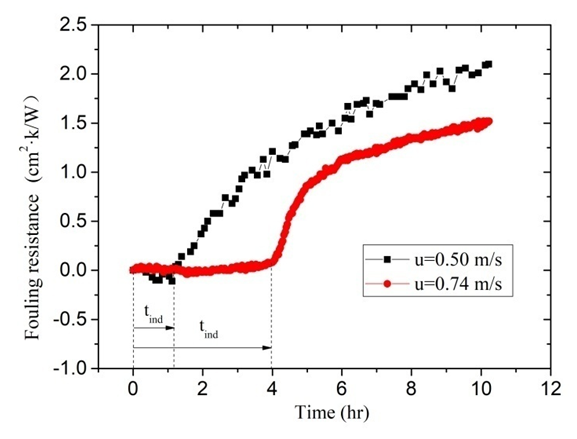
3.3. Fouling Resistance Changing with the Flow Velocity
- In the studied case, the law of fouling rate change with the increasing flow velocity is investigated when the wall temperature remains constant. In order that the wall temperature and the bulk fluid temperature remain almost equal, flow velocity u is set to 0. 50 m/s and 0.74 m/s, respectively. Correspondingly, heat flux is set to 14.1 kW/m2 and 19.9 KW/m2. Initial hardness of solutions is 1000°. Other experimental conditions remain equal. As can be seen from Figure 9, the fouling resistances decrease with the increasing flow velocity. When u increases from 0. 50 m/s to 0.74 m/s, the fouling resistances decrease from 2.1×10⁻⁴ m2·K/W to 1.51×10⁻⁴ m2·K/W. This can be explained by increased shear forces at the fouling liquid-solid interphase which prevent the depositing material from adhering to the internal surface of copper tube at higher velocities. It is worth noting that the induction period increases with the flow velocity. The induction period tind extends from 1.2 hours to 4.0 hours with u increasing from 0. 50 m/s and 0.74 m/s.
 | Figure 9. The fouling resistance under different flow velocity |
4. Correlation Degree Analysis of Influencing Factors
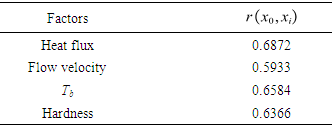
- There are a few key parameters that need to be considered such as velocity, heat flux, Bulk temperature of fluid, surface temperature, Surface material, pH, Solution hardness, Surface roughness [23,24]. It is not very clear that the degree and action rule of these factors on scaling process at present. It is very important to design experiments and arrange the experiment data if we understand clearly the correlation between the different influencing factors and the scale thermal resistance. Grey relational analysis method is an important branch of grey system theory. This method can judge the relationship between different sequences based on the degree of similarity of geometric shape of the sequence curve. Grey relational analysis has obvious advantages for dealing with complex relationship using small amounts of data [25,26]. Grey relational analysis method is used to analyze various influence factors quantitatively. The method can rank parameters that has important influence on fouling resistance.The fouling resistances of scale precipitated are used as reference sequence x0(k), k=1,…,8. According to the results of previous studies, and referring to relevant literature, heat flux, bulk fluid temperature, flow velocity and solution hardness are used as comparative factor sequence xi(k), i∈I={1,…,4}; k∈K={1,…,8}. The table contains multiple sets of data. The effect of four factors on fouling resistance is investigated. First, because different factors have different dimensions, dimensionless treatment of influencing factors is necessary in order to compare the extent of these factors.
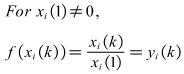 | (11) |
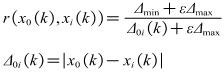 | (12) |
 According to the expression of grey correlation degree, grey correlation degree of x0 to xi can be expressed as follows:
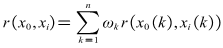 | (13) |
|
5. Type of Fouling Deposited on the Inside Surface of the Copper Pipe
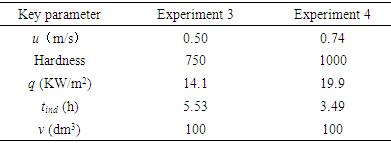
- According to the detailed statistics and collation of the experimental data, an important repeated phenomenon was found. In each experiment, the solution changes from clear to turbid slowly. Transparency of the experiment solution was closely observed during the process of each experiment. From the timing starts when NaHCO3 and CaCl2 are dissolved in deionized water, the critical time t0 when solutions change from clear to turbid is recorded. The variation curve of fouling resistance is drawn out after each experiment is completed. The induction period tind when fouling resistance increases from zero is approximately equal to this critical time t0. This discovery can help to explain the type of fouling which was deposited on the inside surface of the copper pipe. Fouling is usually classified into six categories depending on key physical or chemical process essential to the particular fouling mechanism. The categories are crystallization, particulate, chemical, corrosion, biological and solidification. Among those crystallization fouling accounts for over 25% of the fouling problems encountered in the field of industry and agriculture. Crystallization fouling, or scaling, occurs when inverse solubility salts that are originally dissolved in the process fluid, and deposits on heat transfer surface. Considered two types of fouling are usually obtained under boiling and evaporation: one of them is crystalline deposit caused by precipitation from solutions of mineral salts, and the second is deposition of suspended particles carried by the main liquid flow in the heat exchanger. The former is called crystallization fouling, and the latter is particulate fouling. The difficulty in generalizing experimental data on two types of fouling lies in its dependence on many factors such as characteristic of the fouling fluid, flow velocity, temperature of heat transfer surface and bulk fluid, heat flux, materials and geometry of heat transfer surface, and etc. In the crystallization fouling experiment performed by Peyghambarzadeh et al. a suitable in-line filter was installed before the test section to remove all probable CaSO4 particles from the test fluid, and the purpose was to avoid any interference of suspended particles in the crystallization fouling experiment [13]. These two types of fouling included crystallization fouling and particulate fouling will be interrelated in the formation process, and they may be some connection under certain circumstance. The concentration of calcium ion dissolved state in solutions is measured according to “EDTA Titrimetric Method” at regular intervals during the fouling experiments. In addition changes of the turbidity of the solution are also recorded at regular intervals. The change curves of the fouling resistances are drawn every time after the experiment. Comparing the results of these experiments some common law was found. Changes of the turbidity of the solution and scale deposits on inner wall of copper tube have a very close connection. Once the solution begins from clear to slightly turbid, the fouling resistance begins to increase. Pääkkönen and Riihimäki et al. [7] also observed a similar phenomenon: The solutions were observed visually having the change of turbidity of the test fluid in the mixing tank. During their experiments with lower fluid temperature, the bulk fluid was quite clear with lower turbidity, while in the experiments with higher fluid temperature the bulk fluid was very turbid. During all the experiments with filters, the bulk fluid was visually observed clear.Two representative experiments are selected to illustrate these laws. Key parameters in Experiment 3 and Experiment 4 are listed in Table 3. During the experiments this moment when the solution begins from clear to slightly turbid was recorded. The induction period recorded in Experiment 3 and Experiment 4 are 5.53 and 3.49 hours respectively. It can be seen from Figure 10, the moment when turbidity changes and the time when fouling resistance increases are very consistent. In addition, the moment when turbidity changes are precisely recorded. Perhaps a few calcium carbonate particles in the solution already occurred before experimenter can observe.
|
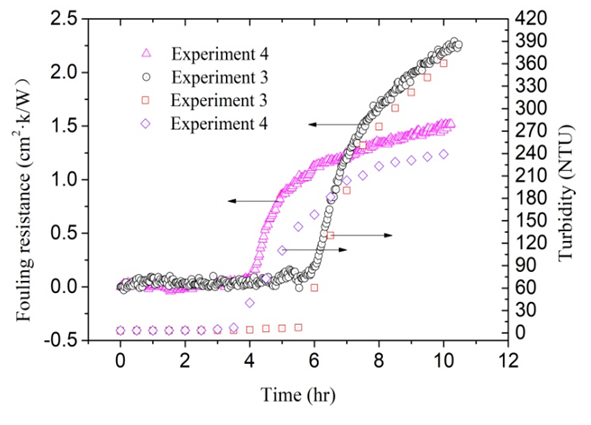 | Figure 10. The heat resistance and turbidity of Experiment 3 and 4 |
6. Conclusions
- In the present experiments, fouling processes under different parameters were systematically studied. The type of fouling which was deposited on the inside surface of the copper pipe was also discussed in detail. In order to accelerate the fouling, artificial hard water was prepared by using a mixture of NaHCO3 and CaCl2 in this experimental setup. The test was conducted at various heat fluxes of the solution. The bulk fluid temperature and flow velocity were varied to study the effects on fouling. The following conclusions can be drawn from the present experimental investigations:The fouling resistance increases with the heat flux increasing when the flow velocity and inlet solution temperature remains constant. While the length of the induction period decreases with the heat flux increasing. The bulk fluid temperature has important influence on the calcium carbonate scale formation process. When bulk fluid temperature increases from 24°C to 28°C, the fouling resistances increase from 1.46×10⁻⁴ m2·K/W to 3.01×10⁻⁴ m2·K/W under the same flow velocity and solution hardness. The fouling resistances decrease with the increasing flow velocity. The correlation degrees between the four factors and fouling resistance are calculated based on grey relational analysis method. The effect of heat flux on the fouling process is the highest, and the bulk fluid temperature is secondary. Calcium carbonate crystal particles precipitated out from the metastable solution, which should be called crystallization fouling according to the definition of fouling categories. Meanwhile, the type of fouling deposited on inside surface of copper pipe from microparticles in solution can be defined as particulate fouling. Therefore, the fouling which was deposited on the inside surface of the copper pipe can be named composite fouling included crystallization fouling and particulate fouling.
Nomenclature
ACKNOWLEDGEMENTS
- The authors gratefully acknowledge Key Research Project of Higher Education in Henan Province (21A470003) and Doctoral Fund Project of Henan Polytechnic University (B2014-031) for support to conduct this research work.
Declaration of Conflicting Interests
- The Authors declare that there is no conflict of interest.