I. E. Ekengwu, O. C. Okafor, H. C. Olisakwe, U. D. Ogbonna
Department of Mechanical Engineering, Nnamdi Azikiwe University, Awka, Anambra State, Nigeria
Correspondence to: O. C. Okafor, Department of Mechanical Engineering, Nnamdi Azikiwe University, Awka, Anambra State, Nigeria.
| Email: |  |
Copyright © 2021 The Author(s). Published by Scientific & Academic Publishing.
This work is licensed under the Creative Commons Attribution International License (CC BY).
http://creativecommons.org/licenses/by/4.0/

Abstract
The quality and reliability of welded structures are principally dependent on factors such as: welding current and voltage, speed of the weld pass, groove angle, type of filler material, characteristics of the base metal and method of cooling/quenching of the weldment. Research efforts had been focused more on the effect of these factors excluding groove angle and quenching substance on weldment quality and reliability. This study was based on measuring the reliability of welded structures using optimization technique in consideration of two weldment quality determinant factors- groove angle and type of cooling/quenching substance. The designed experiment employed in the optimization process, used the input variables of groove angle (55°-60°) and type of quenching substance. The mechanical properties of the weldment were used as the measured responses. The results showed that air quenched weldment for a groove angle of 60° had the highest yield strength, ductility and the desired minimum percentage reduction in area. Water quenched weldment for a groove angle of 60° offer high ultimate tensile strength and hardness. While weldment quenched with palm oil using a groove angle of 59° had the highest engineering fracture strength. A groove angle of 60° and air as cooling substance was considered a better factor combination for achieving good weldment performance in terms of strength, ductility and percentage reduction (area) following the optimization outcome.
Keywords:
Welding, Optimization, Steel, Groove Angle, Cooling, Mechanical Properties
Cite this paper: I. E. Ekengwu, O. C. Okafor, H. C. Olisakwe, U. D. Ogbonna, Reliability Centered Optimization of Welded Quality Assurance, Journal of Mechanical Engineering and Automation, Vol. 10 No. 1, 2021, pp. 1-11. doi: 10.5923/j.jmea.20211001.01.
1. Introduction
Welding is an operation that involves the joining of two similar or dissimilar materials (metals) through the application of heat and/ or pressure with or without the use of filler materials. During welding operation, other auxiliary materials such as: shielding gases, fluxes or pastes may be used to aid the process. Welding of similar metals is not as challenging as welding dissimilar metals of different chemical, thermal, physical and mechanical properties. The quality and strength of a weldment are affected by factors such as: type of welding adopted, welding current, welding voltage, nature of the base metals, the speed of the weld passes, type of filler material used, type of cooling substances and the weld groove type and angle deployed.Selection of an arc welding process is complex with respect to the workpiece, application, simplicity, infrastructure, cost, expected quality, etc. Therefore, particular welding application is performed with the interaction of many factors and attributes as shown in Figure 1. In this regard, the arrangement of Shielded Metal Arc Welding (SMAW) process is chosen in the industry due to its simplicity as few process-attributes such as workpiece, welder, power source and electrode make the set up complete. It is an effective and low-cost process for producing quality products [1]. SMAW technique is a type of fusion welding that uses electric current supplied to an electrode from the welding machine to melt the electrode on the prepared groove forming a weld at that joint. Application of SMAW or Manual Metal Arc Welding (MMAW) is gradually replaced in the global context with the introduction of new processes while it is very important for developing countries with low-cost infrastructure, simplicity and availability of human capital [2]. The shielded metal arc welding is most widely used in small scale industries, because of its low cost, simplicity, flexibility and portability [3]. Further, manual welding still occupies a leading position in domestic, maintenance, fabrication and offshore applications [4]. Special advantages of Shielded Metal Arc Welding (SMAW) process are the improved microstructure at the welded joint by varying chemical coating formulation, availability of electrodes for almost all steels [Welding Handbook, 1991], proper weld zone protection without additional equipment and possible to produce thin electrodes in diameter (up to 1mm) [1]. SMAW is carried out best by human skill and practice and assessed by inspection and/or testing of the weld [5].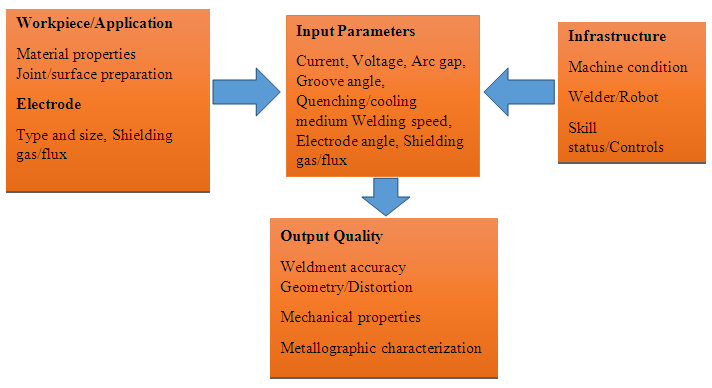 | Figure 1. Input and response variables relationship for SMAW welding process |
The failures noted in welded structures are often attributed to the residual stresses induced in the metals during welding operations. This induced stress thus affects the mechanical properties and the morphological state of the metals. Sequel to this concern, researches have been carried out by so many persons in quest of finding the good welding methodology that will mitigate if not eradicate the consequent effects of the induced residual stresses. To this regard, [6] employed different welding angles to join high-strength armor steel inquest of finding out the effect of groove angle and geometry of the welding groove on tensile, compression and bending strength of welded samples. From their experimental studies, the highest tensile strength was gotten at the welding angle of 54° and with a V-welding groove geometry. It was also deciphered that at a groove angle of 48° and X-welding groove geometry, the highest compression strength was obtained. Also, [7] studied the effect of groove angle configurations on the mechanical and microstructural properties of SS400 structural steel joined by fusion welding. From their study, double half-rooted 35° V-groove angle and root width of 2mm had the highest tensile strength while the sample with half V-groove with 35° angle and 9mm root width had the highest impact strength. In addition, other researchers [8] investigated the influence of different input process parameters-current, voltage and groove angle on the weld quality of mild steel material and the optimal factor combinations that yielded the best weld quality using optimization tool. Mechanical tests and microstructural examinations were carried out on the 36 mild steel samples employed in the study. According to their findings, best quality weldment with highest ultimate tensile stress (UTS) is obtained at current values of 104A, 119A and 123A; voltage of 27V and groove angle of 60°.The combined effect of varying groove angles and cooling/quenching media on the mechanical properties of mild steel weldment performed using SMAW needs to be investigated and the optimum welding factor combinations that would yield the best weldment quality and reliability established. This study is essential since the type of cooling/quenching media and angular value of the groove has a direct effect on the microstructural formation and arrangement of weldment molecules which characterizes the mechanical properties of the base material- mild steel. To this concern, optimization technique will be used to output the optimal groove angle and cooling/quenching media for the best weldment performance using the measured values of the considered mechanical properties of mild steel weldment and the welding factors- groove angle and type of quenching/cooling media. The optimization and statistical analysis tools employed would help in deciphering the individual and interactive effects of the welding factors on each of the mechanical properties of the weldment. This forms the basis of this study.
2. Materials and Method
2.1. Materials
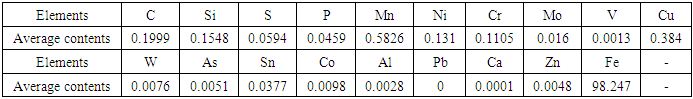
The materials used in this study were: AISI/SAE 1020 mild steel (dimension: 100mm × 46mm × 1mm), polishing reagent (diamond powder and alumina powder), water, etching reagents (nitric acid and ethanol), quenching substances (palm oil, water and air), sand paper, electrodes (basic type- because it gives good arc penetration and excellent mechanical properties). The chemical compositions of the mild steel specimen used in this study is shown in table 1.Table 1. Chemical compositions of mild steel specimen [9]
 |
| |
|
2.2. Method
The research method employed in this study stems from design of experiments through sample preparations and welding, quenching of the samples, mechanical tests to optimization of the responses in quest of finding the optimal factor characteristics for good weld integrity or performance. The following sections provided detailed description of the research methods.
2.2.1. Design of Experiment
Design expert software 11.0 was employed in designing an experiment using response surface methodology tool for carrying out mechanical analysis of the weldment. The experiment was designed using the input factors: type of quenching substances (water, air and palm oil) and various single V-groove angles (A). The response variables used were: yield stress, ultimate tensile stress, engineering fracture stress, percentage ductility and reduction. The groove angle and type of quenching substances were taken as numeric and categorical variables respectively. The mathematical inequality that governed the development of the experimental design for the factor of groove angle was: 55° ≤ Groove angle (A) ≤ 60°. At the end of the experimental design, a total of eleven (11) simulations/runs were gotten.
2.2.2. Sample Preparation and Welding
Eleven (11) samples were prepared by cutting out two mild steel plates that would give a dimension of 100mm × 46mm × 1mm when assembled together by carefully following the designed experiment. The two metal pieces were then joined together using shielded metal arc welding (SMAW). The welding parameters used are: welding current 180A, welding voltage 220V AC.
2.2.3. Quenching of the Specimens
Immediately after welding the specimens, each was dropped into the respective cooling substances- water, palm oil and air with the aid of a hand tong. After the cooling process of the specimens, they were taken out of the cooling substances and labeled accordingly. Figure 2 shows the appearance of some of the specimens after quenching.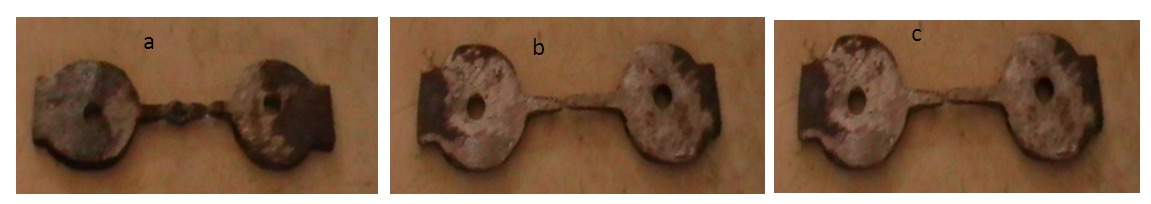 | Figure 2. (a) Water quenched sample (b) Oil quenched sample (c) Air cooled sample |
The various forms of the samples quenched in water, oil and air as shown in figure 2 can be attributed to the microstructural and macrostructural arrangement of the atoms of the weld metal and the base metal. The cooling method and substance applied determine the structural form and mechanical properties of the weldment. The weldments may be fine or coarse depending on the type of cooling medium used. Microstructural and macrostructural analysis are beyond the scope of this study.
2.2.4. Laboratory Testing of the Specimens
a. Tensile TestThe tensile strength of the specimens was tested in tension to failure by mounting each sample on the jaws of a tensiometer on which a gradually increasing load was applied and the initial area and width of the samples were noted as 140mm2 and 2mm respectively before subjecting them to tension. The yield and maximum loads were recorded directly from the resulted graph. The broken ends of each specimen were fitted and the final gauge length, final width and final area were measured. The readings obtained were used in the determination of yield Strength  , ultimate tensile Strength
  percentage elongation and engineering fracture stress. b. Hardness TestHardness test was also conducted on the samples with the aid of Rockwell hardness tester (Indentec, 2007 Model). This test was carried out by placing the specimen on the anvil of the machine and the penetrator seated by means of a 10 kg body. The dial indicator was zeroed and then major loads of 60, 100 or 150 kg were sequentially applied, forcing the penetrator into the specimen. Upon removal of major load, the indicator specimen recovers slightly, and the final depth of the penetrator was registered directly on the dial indicator as a hardness number.
2.2.5. Statistical Analysis
Statistical test (Analysis of variance-ANOVA) was carried out on each of the considered variables in order to ascertain their significant effects on weldment performance of mild steel metal. The response having either an individual or combined/interactive two-factor effects were determined. Analysis of variance (ANOVA) is a collection of statistical models and their associated estimation procedures (such as the variation among and between groups) used to analyze the differences among means in a sample. It provides a statistical test of whether two or more population means are equal or not.
2.2.6. Optimization Technique
The values of all the considered responses used in the experimental design were determined and recorded appropriately. Response surface methodology tool was then used in optimizing the responses in order to get the best factor combination that would yield a good weldment performance in terms of its mechanical properties- yield stress, ultimate tensile stress, engineering fracture stress, percentage ductility and reduction.
3. Results and Discussions
3.1. Statistical Tests- ANOVA
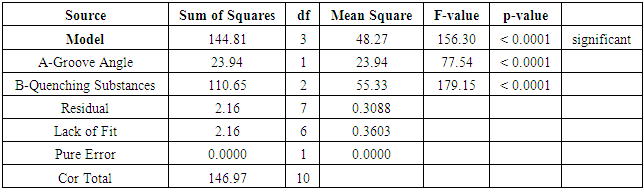
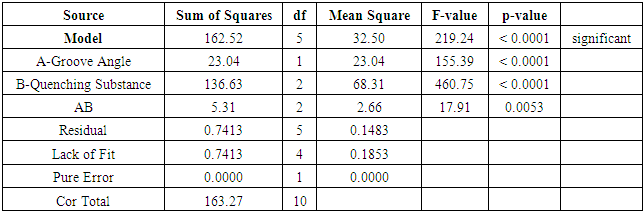
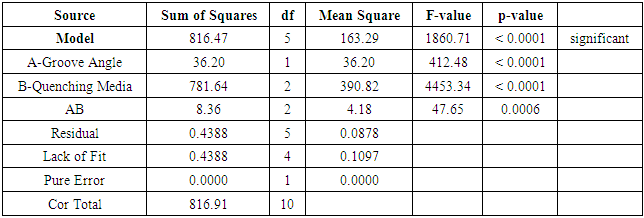
a. Yield StressThe result of the ANOVA analysis performed for the response variable – yield stress of mild steel material is shown on table 2. Table 2. ANOVA Analysis for Response 1- Yield Stress
 |
| |
|
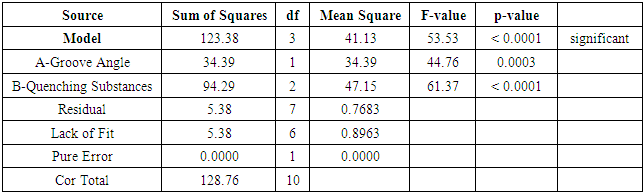
The respective P-values of the model and factors (groove angle and quenching substances) were all less than the chosen significance value ( -value) of 5% using 95% confidence interval. This thus implies that each of the factor has a significance effect on the yield strength of mild steel weldment. The two-factor interaction (2F1) on the response variable was insignificant. b. Ultimate Tensile Strength (UTS)Table 3 shows the result of the ANOVA analysis for ultimate tensile strength of mild steel material.
 Table 3. ANOVA Analysis for Response 2- Ultimate Tensile Stress
 |
| |
|
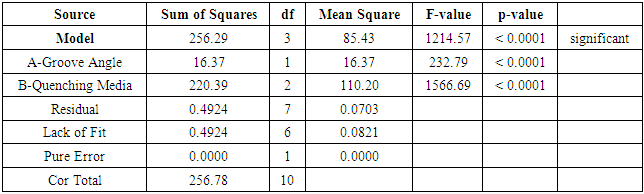
From table 3, the P-values of the groove angle and quenching substances were all less than the significant value of 5% for 95% confidence interval. Hence, both the groove angle and type of quenching substance used have an individual effect and a combined effect on the ultimate tensile strength of mild steel weldment.c. Engineering Fracture StressTable 4 shows the ANOVA result of engineering fracture stress for mild steel weldment.Table 4. ANOVA Analysis for Response 3- Engineering Fracture Stress
 |
| |
|
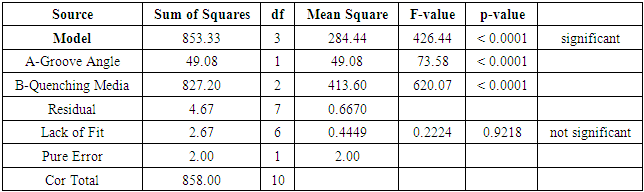
Table 4 shows that each of the factors- groove angle and quenching substance has its own effect on the response variable- engineering fracture stress without any interactive effect on the response variable.d. Percentage DuctilityThe ANOVA result of the response variable-ductility is shown on table 5.Table 5. ANOVA Analysis of Response 4- Ductility
 |
| |
|
There is no interactive factor effect on this mechanical property of mild steel weldment but each of the factors has their individual significant effects on the ductility of the weldment. This is attested to by their respective P-values which were less than the chosen significant value  of 5% for a 95% confidence interval.e. Percentage Reduction Table 6 shows the result of the ANOVA analysis for the response variable- percentage reduction.
Table 6. ANOVA Analysis for Response 5- Percentage Reduction
 |
| |
|
The P-values of each factor is less than the significant value of 5% using a confidence interval of 95%. This proves that each of the considered factors has an individual effect and a combined effect on the response variable as endorsed by their respective P-values.f. Rockwell Hardness ValueTable 7 shows the ANOVA result of Rockwell hardness value for mild steel weldment.Table 7. ANOVA Analysis for Response 6- Rockwell Hardness Value
 |
| |
|
Each of the factors has an individual significant effect and an interactive effect on the hardness of mild steel weldment. This was attested to by the respective P-values of the factors which were all less than 5% significance value using 95% confidence interval.
3.2. Response Surface Methodology- Optimization of the Variables
The optimization operation aimed at maximizing the yield strength, ultimate tensile strength, engineering fracture strength, percentage ductility and Rockwell hardness of mild steel weldment. The percentage reduction degree was minimized in the optimization process inquest of best factor combination that would give minimal percentage reduction characterized with a reduced rate of necking on the weldment. The graphical plots displayed thus show the results of the numerical optimization performed using the considered input and response variables.From figure 3, the highest desirability value of 0.788 was achieved at a groove angle of 60° and with air as the cooling substance. This thus implies that such factor combination is the optimum for a good weldment performance of mild steel material. The quenching substance- water at a groove angle of 60° had the second higher desirability value followed by palm oil at a groove angle of 59°. 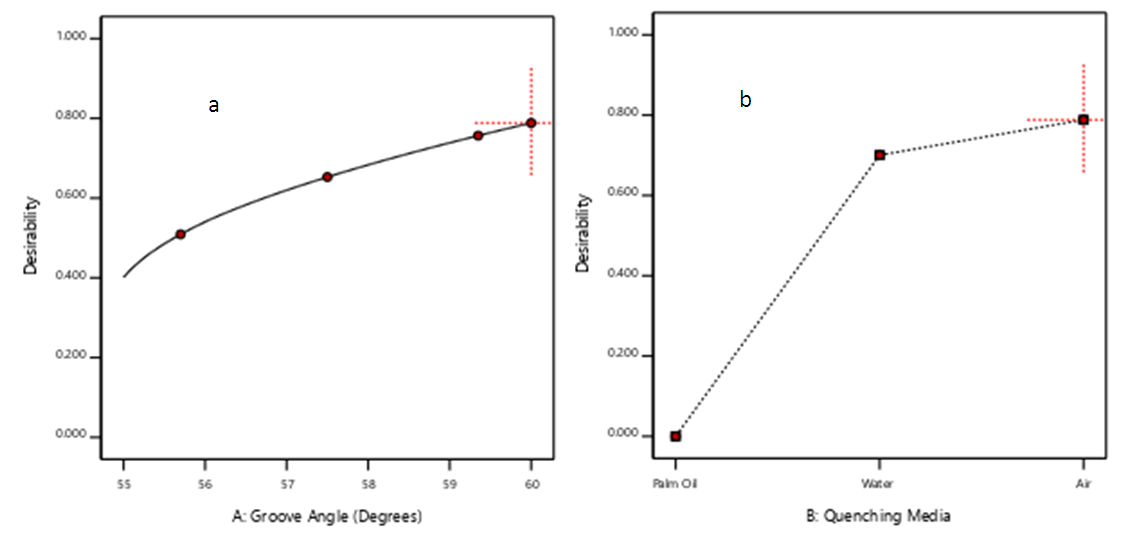 | Figure 3. (a) Plot of desirability against groove angle (b) Plot of desirability against quenching media |
The yield stress of mild steel weldment has a highest value of  at a groove angle of 60° using air as the cooling substance. Figure 4 depicts this. The design point as indicated by the cross is the optimum factor point that would yield desirable weldment performance of mild steel material. Within the yield point region, the weldment still retains some degree of elasticity but beyond it, a plastic structure was formed. The yield strength of the weldment cooled by air was higher than that quenched by water with a value of
  . This could be attributed to the high viscosity of water compared to air and the abrupt quenching process that will cause some effects on the lattice structure of the micro-atomic constituent of the weldment, thereby affecting its yielding strength by a small degree. Palm oil quenching media gave the lowest value of yield strength because of it higher value of viscosity.
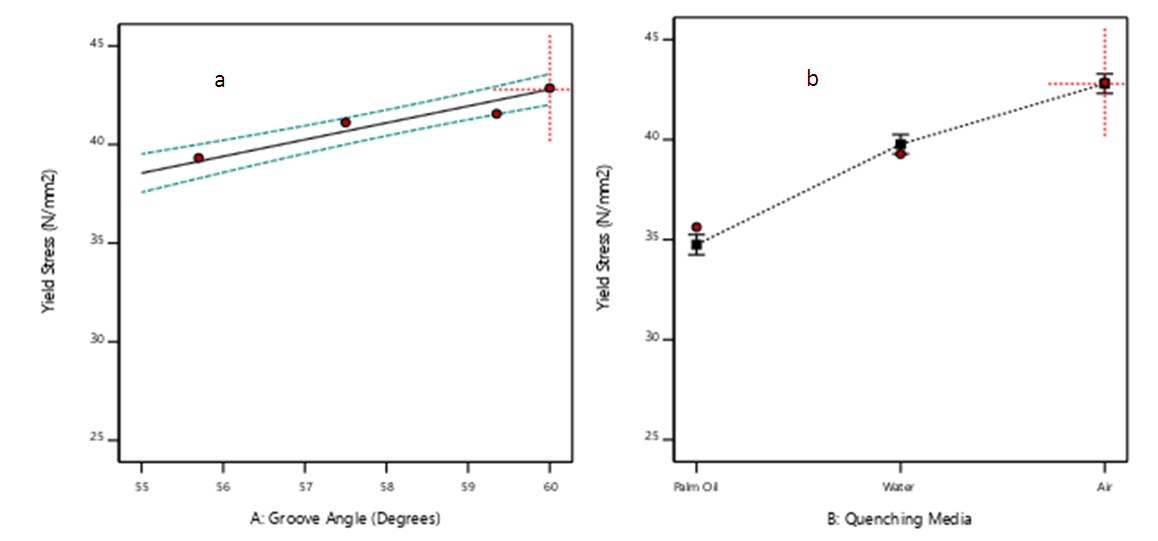 | Figure 4. (a) Plot of yield stress against groove angle (b) Plot of yield stress against quenching substance |
From figure 5, weldment quenched by water at a groove angle of 60° gave the highest ultimate tensile strength. Water quenched weldment at a groove angle of 60° gave an ultimate tensile strength value of  while air cooled weldment gave
  at 60° groove angle. Palm oil gave the lowest value of
  at a groove angle of 59° The ultimate tensile stress measures the highest stress point the weldment can withstand before necking ensues and then fracture. The higher ultimate tensile strength value given by water quenched weldment can be attributed to large heat extraction capacity of water causing the formation of refined metallurgical structure and martensite.
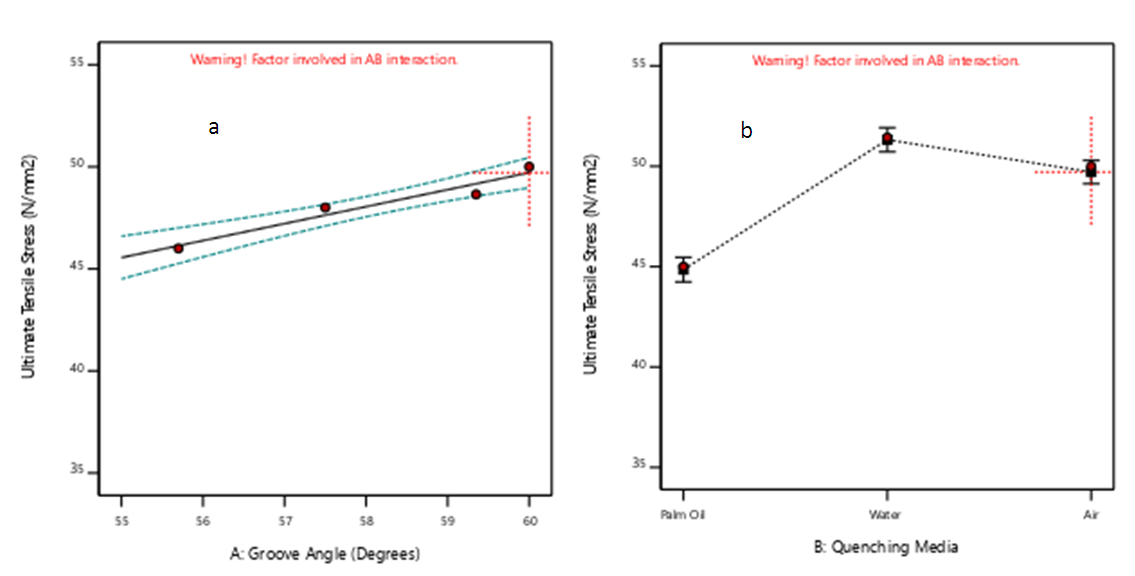 | Figure 5. (a) Plot of ultimate tensile stress against groove angle (b) Plot of ultimate tensile stress against quenching media |
Figure 6 shows that air cooled weldment at a groove angle of 60° has a good engineering fracture strength after palm oil quenched samples which has the highest value. Water quenched weldment was by 0.13% greater than that of air cooled weldment. 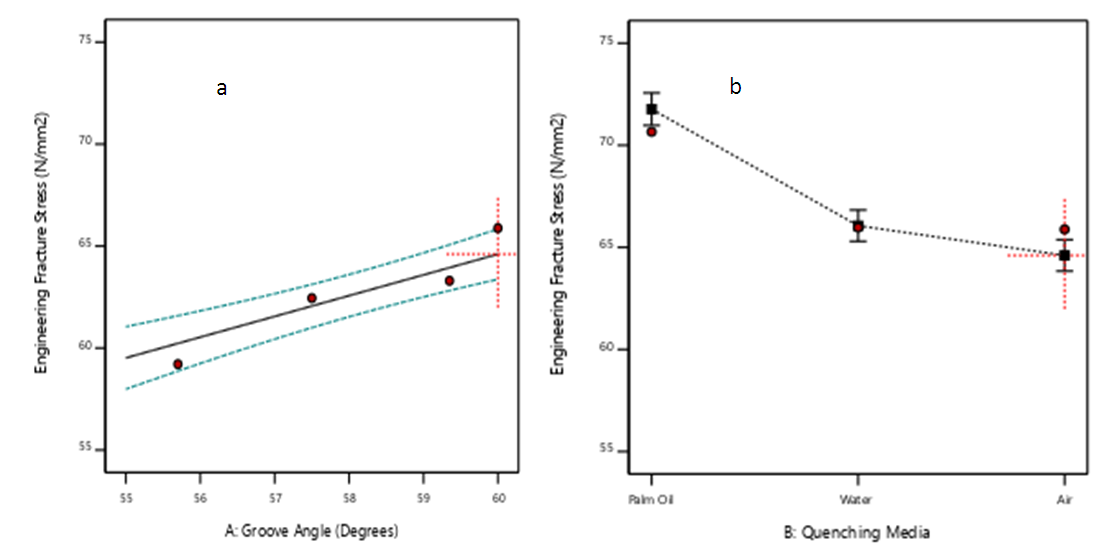 | Figure 6. (a) Plot of engineering fracture stress against groove angle (b) Plot of engineering fracture stress against the quenching substance |
Furthermore, figure 7 depicts the plots of ductility against the groove angle and quenching media. It was deduced that air cooled sample at a groove angle of 60° gave the highest value of ductility. This implies that such weldments are more elastic than those of water-cooled and palm oil quenched. This is because when steel is heated by welding heat no structural change takes place until the lower critical point is reached. At this point, the carbon in the steel starts forming a solid solution with the iron and this change takes place through the critical range. The transformation is completed at the upper critical point and at temperatures above this, the steel consists of a solid solution of carbon in iron called austenite, which is hard and non-magnetic substance [10]. When it is allowed to cool down normally (air cooled) passing through the critical range, the austenite is transformed back to pearlite accompanied by ferrite in steel [10]. And again, considerable contraction occurs at the critical range and during cooling, there is a corresponding instantaneous expansion which makes the material to become plastic and ductile.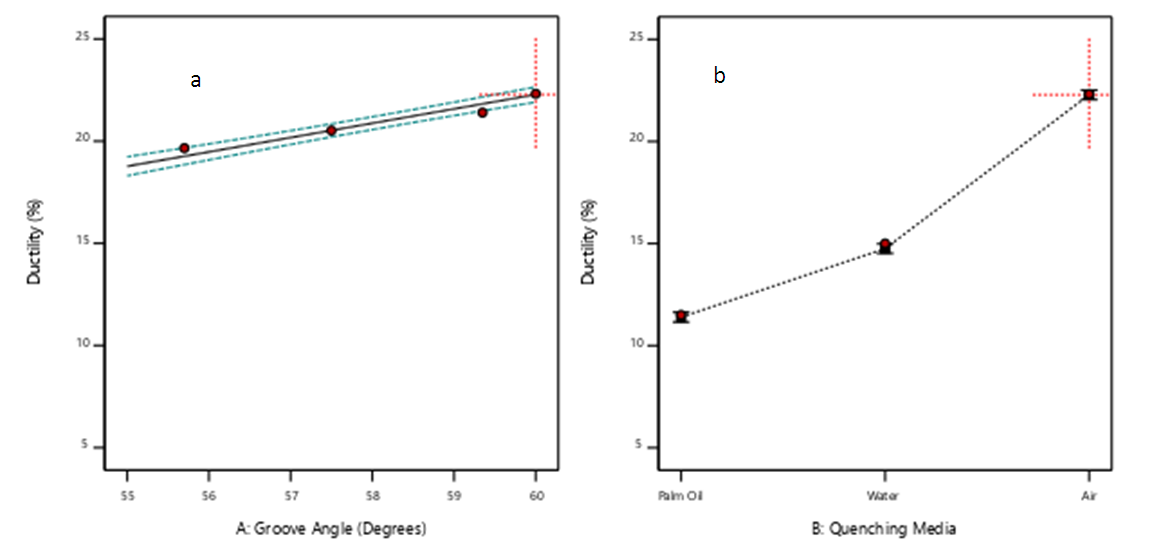 | Figure 7. (a) Plot of ductility against groove angle (b) Plot of ductility against quenching media |
For a weldment that wouldn’t form neck zones too fast, a small percentage reduction of its area is desired. Figure 8 shows that air cooled weldments has the smallest value of percentage reduction compared to water and palm oil quenched. This was because of the higher value of yield strength of air cooled weldment and its good ductile property. Palm oil quenched sample has the highest value. 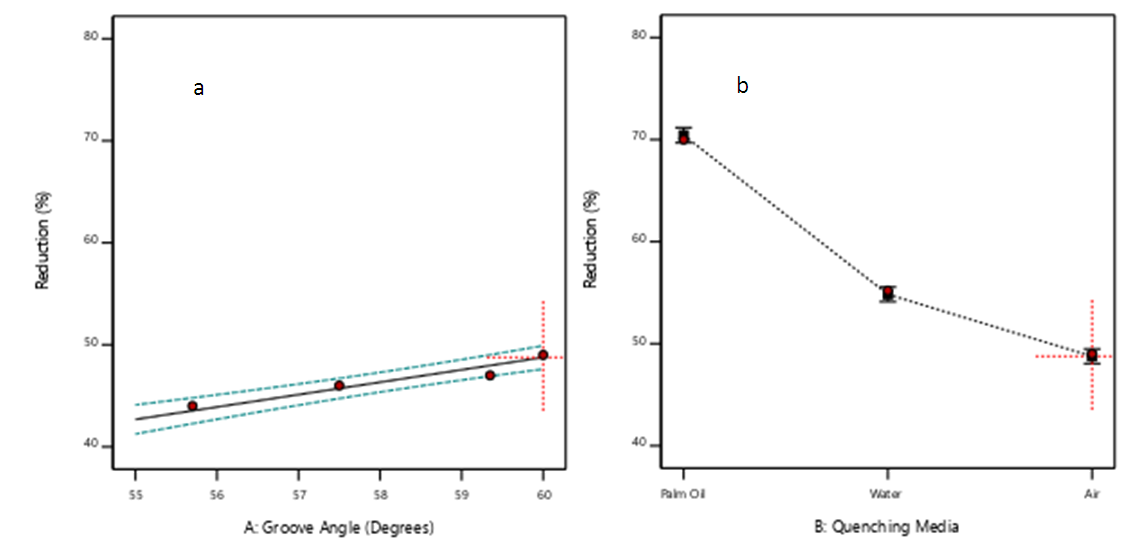 | Figure 8. (a) Plot of percentage reduction against groove angle (b) Plot of percentage reduction against quenching media |
Figure 9 illustrates that water quenched weldment at a groove angle of 60° has the highest hardness value compared to air cooled and palm oil quenched samples. The characteristic constituent of water quenching substance caused a very close compart arrangement of the weldment atom leading to the martensite formation. Hence the observed high hardness value of water quenched weldments.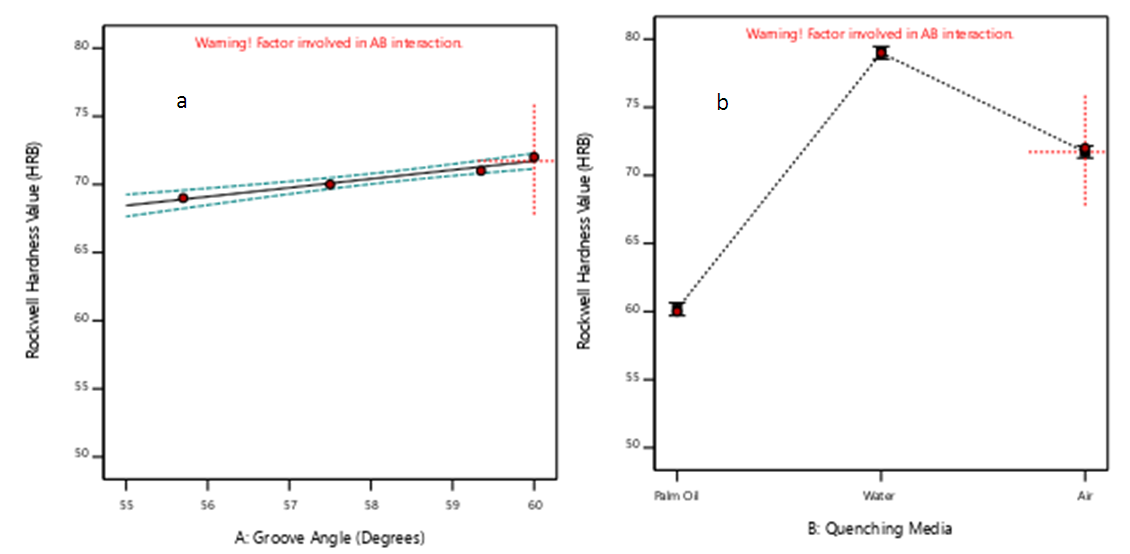 | Figure 9. (a) Plot of Rockwell hardness value against groove angle (b) Plot of Rockwell hardness value against quenching media |
3.3. Optimal Factors Combination
The selected optimal factors and the response values predicted at these factor point using their respective developed models is shown in table 8.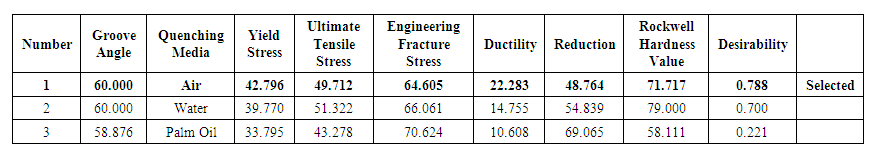 | Table 8. Optimal Factors and Predicted Response Values |
From table 8, it can be inferred that using air as a quenching media and a groove angle of 60° offered a better weldment characteristic performance compared to water cooled and palm oil quenched samples. A higher desirability value of 0.788 was obtained at such factor combination. This was followed by water and then palm oil quenching media.
3.4. Stress-Strain Plots of Mild Steel Weldment
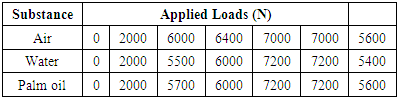
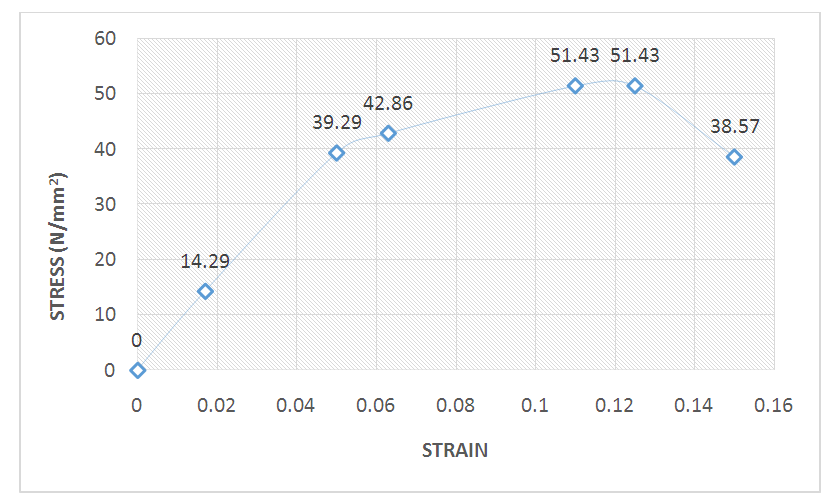
The stress-strain plot shows pictorially the behavior of engineering materials under the action of loads. The zones of interest such as the: proportionality limit, elastic zone, yield point zone, ultimate strength zone and the fracture zone are depicted on stress-strain plots for material engineers to study the behavioral phenomena of materials. From the performed experiment and optimization outcome, air cooling at a groove angle of 60° was obtained as the optimal factor combination for better weldment performance of mild steel material. This was followed by water quenching media at same groove angle and lastly, oil quenched at a groove angle of 59°. These conclusions were deduced from the respective desirability values of each factor combination as shown on table 8. To further observe pictorially the behavior of the mild steel weldments under various load actions, the stress-strain values of each of the factor combinations shown on table 8 were plotted. Table 9 shows the values of loads applied on each mild steel material that led to its necking and fracturing.Table 9. Applied Load Values on Mild Steel Material
 |
| |
|
The responses of the weldments to the loads are shown graphically on figure 10, 11 and 12.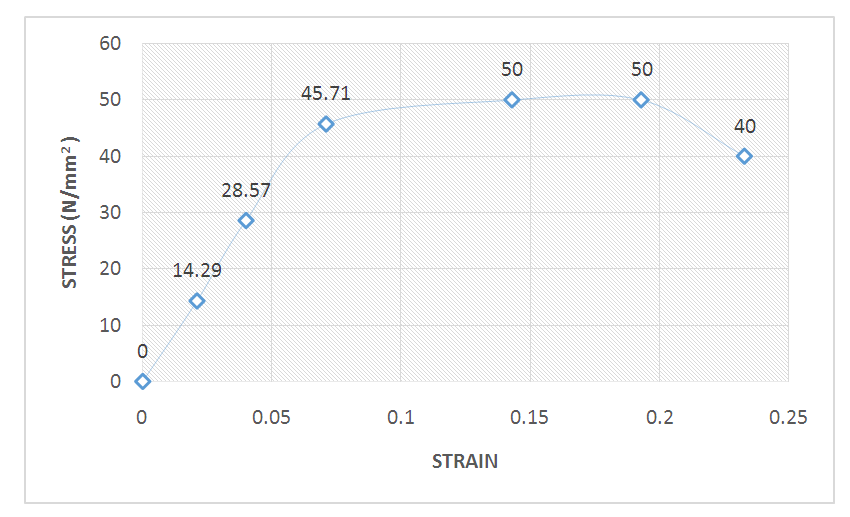 | Figure 10. Stress/Strain plot of air cooled sample at a groove angle of 60° |
 | Figure 11. Stress/Strain plot of water quenched sample at a groove angle of 60° |
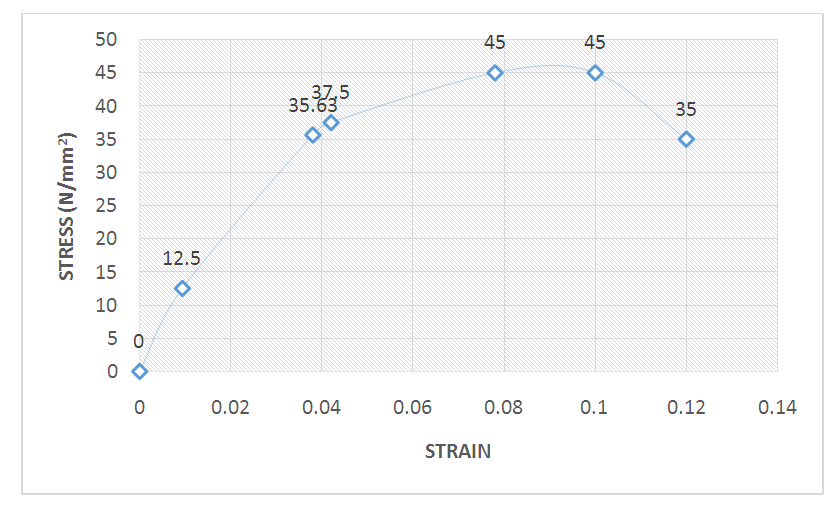 | Figure 12. Stress/Strain plot of oil quenched sample at a groove angle of 59° |
Figures 10, 11 and 12 show the behaviors of the weldments on loads leading to fracture points. The yield stress values could be observed at points  ,
,  and
and  for air-cooled, water and oil quenched samples respectively. Below these points, the material is still within the elastic zone but beyond the points lead to plastic formation. The figures print the ultimate strength values of the material to be
  ,
, 
 and
and  for air-cooled, water and oil quenched samples respectively. Loads beyond these stress points led to neck formation and consequently, fracture of the material’s weldment.
4. Conclusions
The study reveals that good weldment performance in measures of quality and reliability is achieved when welded structures are cooled by air and the weld groove angle is maintained at 60°. By quality and reliability, the weld has a high strength and ductility values with minimum percentage reduction in area which are needed in practice at these conditions. Industrially, good weldment integrity will be achieved through the application of this research finding to mitigate the failure rate of welded structures caused by induced residual stresses. Microstructural examination of these weldments- air cooled, water quenched and oil quenched and their respective groove angles will be helpful in knowing the compactization and grain sizes of the weldments which contribute to good weld quality and reliability. Also, finite element weld simulation should be employed to further validate this research conclusion. These are the required areas that this study should be furthered on.
References
| [1] | ESAB, "ESAB," [Online]. Available: https://www.esabna.com/us/en/index.cfm. [Accessed 29 06 2019]. |
| [2] | Sangwan, K.S., Herrmann, C., Egede, P., Bhakar, V., and Singer, J., (2016) "Life Cycle Assessment of Arc Welding and Gas Welding Processes," Procedia CIRP, vol. 48, pp. 62-67. |
| [3] | Patel, D., Patel, S., Parekh, J., and Saurabh, C., (2017) "A Review on Effect of Different Process Parameters of SMAW," Imperial Journal of Interdisciplinary Research (IJIR), vol. 3, no. 1, pp. 1384 - 1389. |
| [4] | Verma, J., and Taiwade, R.V., (2017) "Effect of welding processes and conditions on the microstructure, mechanical properties and corrosion resistance of duplex stainless-steel weldments—A review," Journal of Manufacturing Processes, vol. 25, pp. 134-152. |
| [5] | Kumar, V., Albert, S.K., Chandrasekhar, N., and Jayapandian, J., (2018) "Evaluation of welding skill using probability density distributions and neural network analysis," Measurement, vol. 116, pp. 114-121. |
| [6] | Ipek, N.E., and Elaldı, F., (2012) “Analysis of welding groove angle and geometry on strength of armor steel”, Journal of Materials and Manufacturing Processes, 27: 1437-1441. |
| [7] | Ling, K.H., Fuh, Y.K., Wu, K.L., Kuo, T.C., Huang, C.Y., (2015) “Groove configurations of a flux-cored arc welding process used in critical structures of precision mechanical presses—mechanical and metallurgical studies”, The International Journal of Advanced Manufacturing Technology, 78: 1905-1916. |
| [8] | Sirira, L.S., Weerasekralage, K., Karunarathne, M., A and Pathirana, S.D., (2019) “Optimization of shielded metal arc welding (SMAW) process for mild steel”, Annual Sessions of Institution of Engineers, Sri Lanka (IESL), pp 841-847. |
| [9] | Oluwafemi, O.M., Oke, S.R., Otunniyi I.O., and Aramide, F.O., (2015) “Effect of carburizing temperature and time on mechanical properties of mild steel using carbonized palm kernel shell” Leonardo Electronic Journal of Practices and Technologies, pp. 41-56. |
| [10] | Krishnan, K.S., and Rajiv, S.M., (2017) “Metallurgy and design of alloys with hierarchical microstructures- ultrahigh strength steels” Elsevier Journal, pp. 289-343. |

 Abstract
 Reference
 Full-Text PDF
 Full-text HTML