-
Paper Information
- Paper Submission
-
Journal Information
- About This Journal
- Editorial Board
- Current Issue
- Archive
- Author Guidelines
- Contact Us
Journal of Mechanical Engineering and Automation
p-ISSN: 2163-2405 e-ISSN: 2163-2413
2018; 8(2): 59-67
doi:10.5923/j.jmea.20180802.03

Pipeline Leakage Detection by Means of Acoustic Emission Technique Using Cross-Correlation Function
 Abstract
 Reference
 Full-Text PDF
 Full-text HTML
Marcel Nicola, Claudiu-Ionel Nicola, Adrian Vintilă, Iulian Hurezeanu, Marian Duță
Research, Development Division for Electric Equipment and Energy Efficiency, National Institute for Research, Development and Testing in Electrical Engineering – ICMET, Craiova, Romania
Correspondence to: Claudiu-Ionel Nicola, Research, Development Division for Electric Equipment and Energy Efficiency, National Institute for Research, Development and Testing in Electrical Engineering – ICMET, Craiova, Romania.
| Email: |  |
Copyright © 2018 The Author(s). Published by Scientific & Academic Publishing.
This work is licensed under the Creative Commons Attribution International License (CC BY).
http://creativecommons.org/licenses/by/4.0/

There are many difficulties and constraints when carrying out the inspection and maintenance of underground technological pipes. Accidental leakage occurs invariably and can represent a matter of great concern for the environment and the economy. In addition, during the last decade, reliable and secure systems are required for detecting leaks, due to stricter legal rules implemented in developed countries; the acoustic emission (AE) technique, which was widely used as a non-destructive testing (NDT) technique for detecting leakage in pipe lines, heat exchangers or pressure vessel structures, can be used for their inspection, although these structures are relatively large. The system for leak detection presented in this paper is based on the principle of leak location by means of the cross-correlation method using a data acquisition system, acoustic sensors and software application developed in LabVIEW programming environment. The system performs the following functions: storing in a database the image of the cross-correlation function graph of the pipeline leakage detection and generating automated reports of the pipeline leakage detection process. This method was tested successfully.
Keywords: Cross-correlation, Acoustic emission, Leakage detection, LabVIEW environment
Cite this paper: Marcel Nicola, Claudiu-Ionel Nicola, Adrian Vintilă, Iulian Hurezeanu, Marian Duță, Pipeline Leakage Detection by Means of Acoustic Emission Technique Using Cross-Correlation Function, Journal of Mechanical Engineering and Automation, Vol. 8 No. 2, 2018, pp. 59-67. doi: 10.5923/j.jmea.20180802.03.
Article Outline
1. Introduction
- Following the increasing public awareness and concern for the environment, pipeline leakage events indicated that financial losses incurred by a company can be more significant than the idle times and cleaning costs. In addition, reliable and secure systems are required for detecting leaks, due to stricter legal rules implemented in developed countries [1-5].There are many difficulties and constraints when carrying out the inspection and maintenance of underground techno-logical pipes. Accidental leakage occurs invariably and can represent a matter of great concern for the environment and the economy.In addition to the economic advantages, there are other benefits related to the timely detection of leakage, such as: the safety of water supplies, environment protection, water quality protection, preventing further pipe cracks in order to avoid additional damage [6-9].Several sensors are usually installed along the line, given the limited area of detection. These sensors detect the acoustic signals in the pipe and differentiate between leakage acoustic emission and other sounds generated by normal operating changes [10-12].The rapid development of electronics industry led to the development of the electroacoustic equipment, acoustic sensors, amplifiers, digital filters, data acquisition, storage, processing and transmission systems, which contribute to the improvement of fault detection efficiency.The intensity of the sound depends on the distance to the noise source: it is the highest in proximity to the source and decreases proportionally to the distance from the source in all directions. The pipeline material significantly affects the sound propagation speed. For example: for steel and cast iron, the intensity can be traced on longer intervals from the fault, while in the case of PVC and HDPE the sound can only be detected near the source.The exact location of the fault can be determined based on the sound propagation speed in the fluid or the pipe wall, by means of the acoustic correlation. There will be a time lag for the sound detected when the sensors (surface microphones or hydrophones) are placed on both ends of the section of pipe where the fault is assumed to occur, as opposed to the cases where the fault is located halfway between those two sensors. The signals transmitted by the two sensors will be analyzed by the basic unit of the correlator according to the time of advent. The correlator will specify the exact location of the fault based on the sound propagation speed.During the first stage of the fault location procedure, the noise caused by cracks can be “heard” by using equipment which includes special microphones. This type of location is mostly based on user experience, by assessing the location of the crack with the help of headphones. The “precise location” represents the next stage of the procedure and is carried out by using a noise and vibration correlator [13].The “cracking noises” or “leakage noises”, as mentioned in the literature are generated by the flow of fluid out of the pipeline, through cracks, and they propagate through the fluid inside the pipe, to the material of the pipe and the soil around the pipe.During the last decade, the acoustic emission technique was widely used as a non-destructive testing (NDT) technique for detecting leakage in pipe lines, heat exchangers or pressure vessel structures, and although these structures are relatively large, their inspection can be carried out by using this technique [14-16]. The system for pipeline leakage detection presented in this paper uses the acoustic emission technique based on the cross-correlation function. The system performs the following functions: estimating the position of the pipeline leakage based on LabVIEW graphical programming environment, storing the acquired data in a database type MySQL Server and automatically creating and printing reports [17-19]. The paper is an extension of work of [20] and is structured as follows: Section 2 describes the leakage location procedure based on the acoustic emission technique. Section 3 presents the hardware and software description of the acoustic emission monitoring system. Section 4 refers to the experimental results and a section of conclusions is included at the end of the paper, containing the main aspects and advantages of the developed system for pipeline leakage detection by using the acoustic emission technique.
2. The Description of the Leakage Location Principle by Using the Acoustic Emission Technique
- In the case of noise and vibration correlators, the sensors come into contact with the pipe material. They will retrieve the cracking noises and transmit them to a noise and vibration correlator, and due to the fact that the noise propagates with the same speed, the sensor which is located closer to the fault will retrieve the signal faster. The propagation speed depends primarily on the material of the pipe. If this speed is known or determined by experiments, the difference between the moments in time when the cracking noise reaches the two sensors will indicate the crack location [13]. The correlator operating principle is shown in Figure 1.
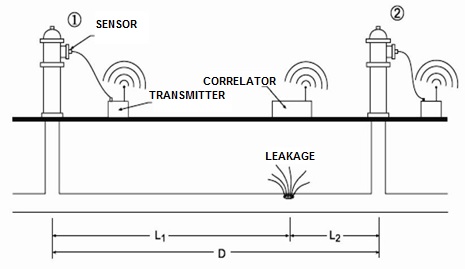 | Figure 1. The principle of noise source location by means of correlation |
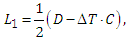 | (1) |
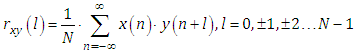 | (2) |
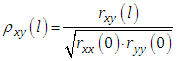 | (3) |
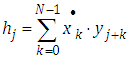
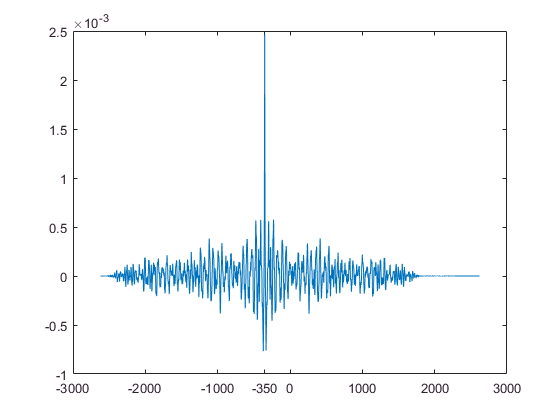 | Figure 2. Non-normalized FIC calculated for signals x, y |
3. Hardware and Software Description of the Leakage Detection System
- The rapid adoption of the PC in the last 20 years catalyzed a revolution in the instrumentation for test, measurement, and automation. One major development resulting from the ubiquity of the PC is the concept of virtual instrumentation, which offers several benefits to engineers and scientists aiming for increased productivity, accuracy, and performance [17].A virtual instrument consists of an industry-standard computer or workstation equipped with powerful application software, cost-effective hardware such as plug-in boards, and driver software, which together perform the functions of traditional instruments. Virtual instruments represent a fundamental shift from traditional hardware-centered instrumentation systems to software-centered systems that exploit the computing power, productivity, display, and connectivity capabilities of popular desktop computers and workstations. Although the PC and integrated circuit technology have experienced significant advances in the last two decades, it is software that truly provides the leverage to build on this powerful hardware foundation to create virtual instruments, providing better ways to innovate and significantly reduce costs. With virtual instruments, engineers and scientists build measurement and automation systems that suit their needs exactly (user-defined) instead of being limited by traditional fixed-function instruments (vendor-defined) [18].The hardware and software architecture of the pipeline leak detection system is achieved for the implementation of the cross-correlation method.
3.1. Hardware Description
- For the validation of the method, a hardware structure is presented, where the connection between the two sensors and the data acquisition and processing system is achieved by wire.The designed structure is shown in Figure 3 and has the following components:- S1, S2 – acoustic sensors - VS30-SIC-46dB;- Data acquisition card (DAQ) NI-USB 6003;- PC host.
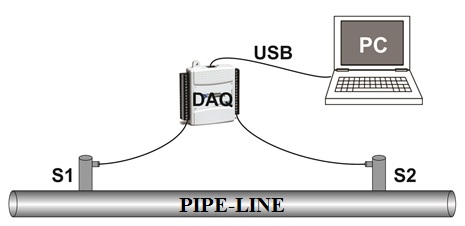 | Figure 3. Hardware architecture of the leakage detection system |
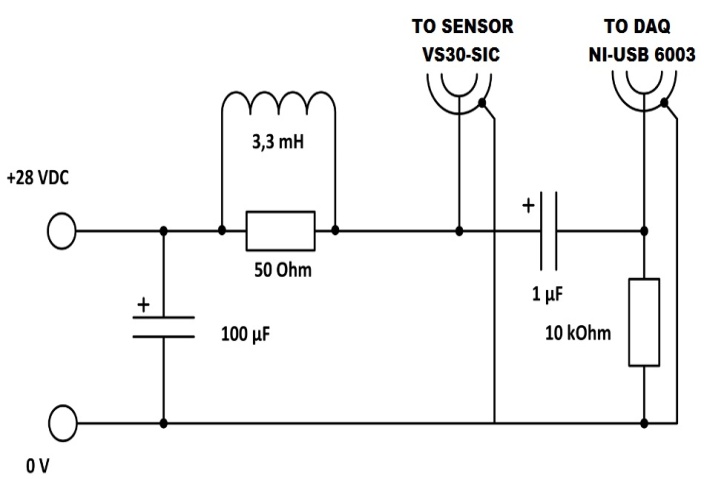 | Figure 4. Module for supplying power to the preamplifier and decoupling the AC component from the signal [16] |
3.2. Software Description
- LabVIEW is a graphical programming language which uses icons instead of lines of text to create applications. In contrast to text-based programming languages, where instructions determine program execution, LabVIEW uses dataflow programming, where the flow of data determines execution. The programming language used in LabVIEW, also referred to as G, is a dataflow programming language. Execution is determined by the structure of a graphical block diagram (the LV-source code) on which the programmer connects different function-nodes by drawing wires. These wires propagate variables and any node can execute as soon as all its input data become available. Since this might be the case for multiple nodes simultaneously, G is inherently capable of parallel execution. Multi-processing and multi-threading hardware is automatically exploited by the built-in scheduler, which multiplexes multiple OS threads over the nodes ready for execution [17, 18].The software architecture of the pipeline leakage detection system is presented in Figure 5.
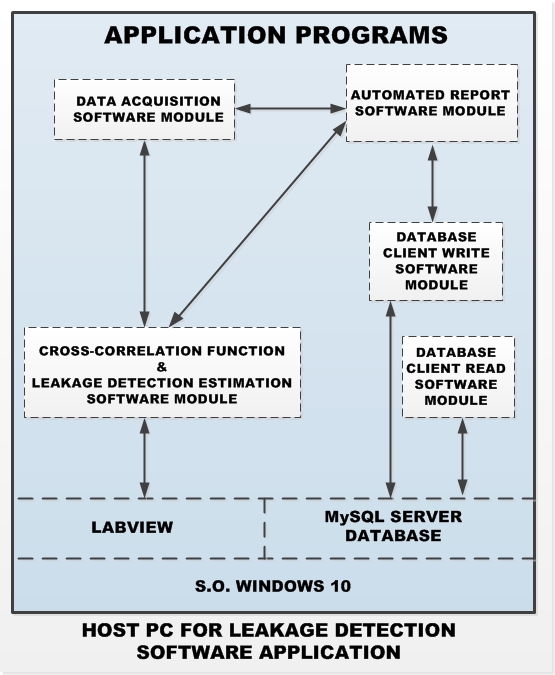 | Figure 5. The software architecture of the leakage detection process |
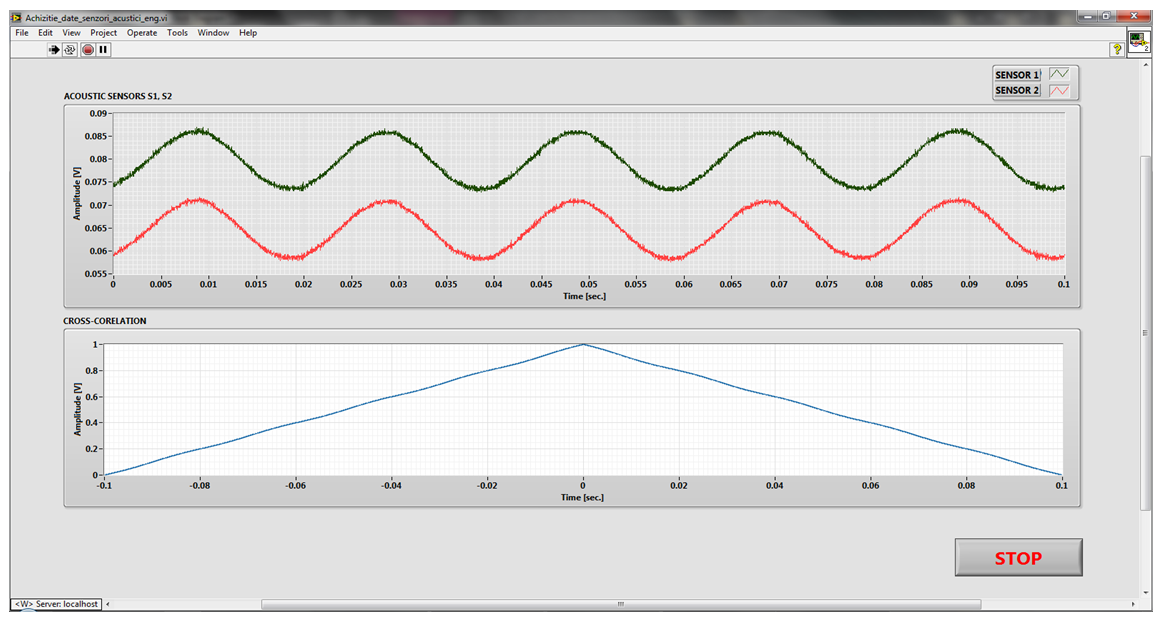 | Figure 6. Software interface of the application |
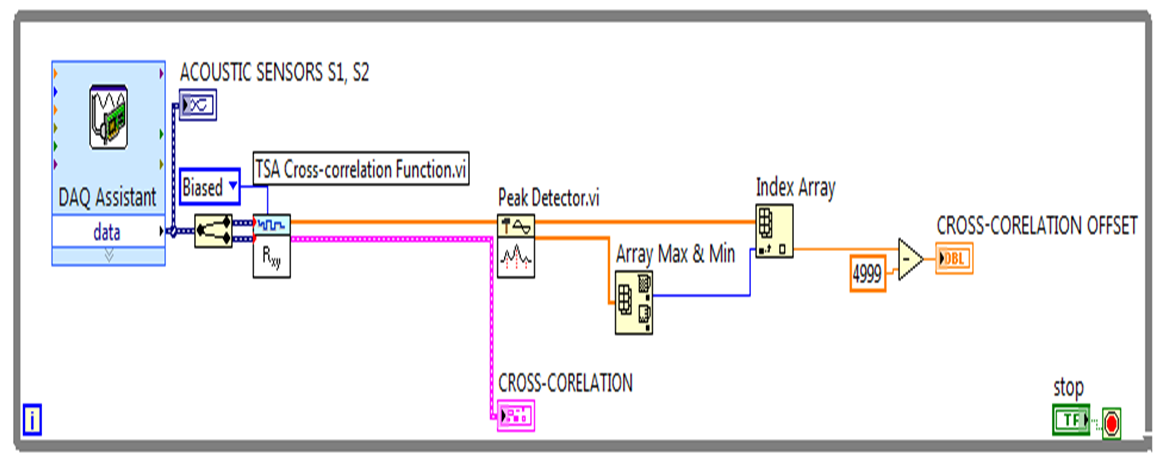 | Figure 7. Block diagram of the application software |
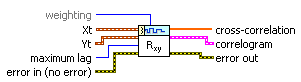 | Figure 8. Cross-Correlation VI |
 | (4) |
 | (5) |
 | (6) |
 | (7) |
 | (8) |
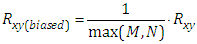 | (9) |
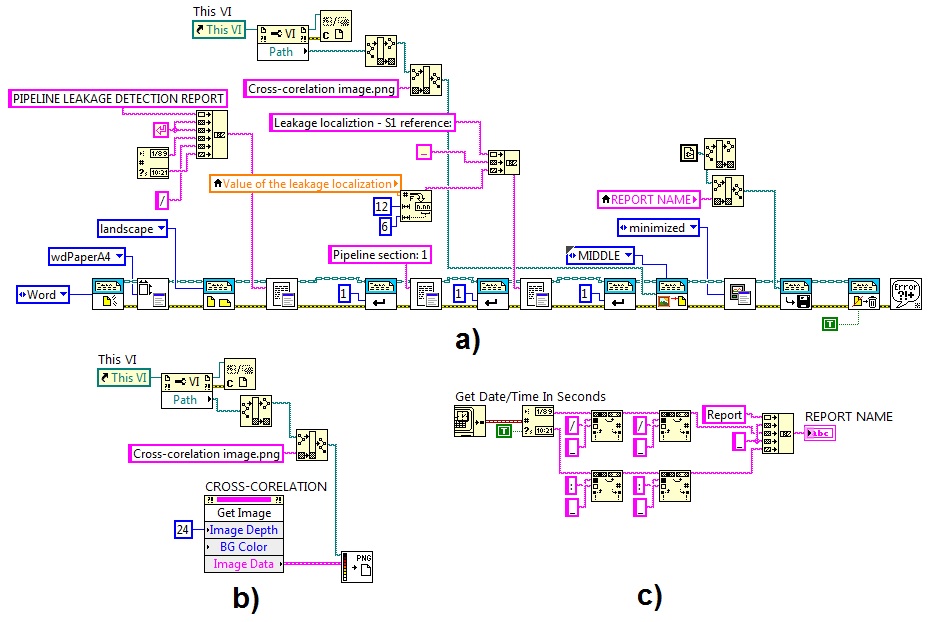 | Figure 9. Automated report generation |
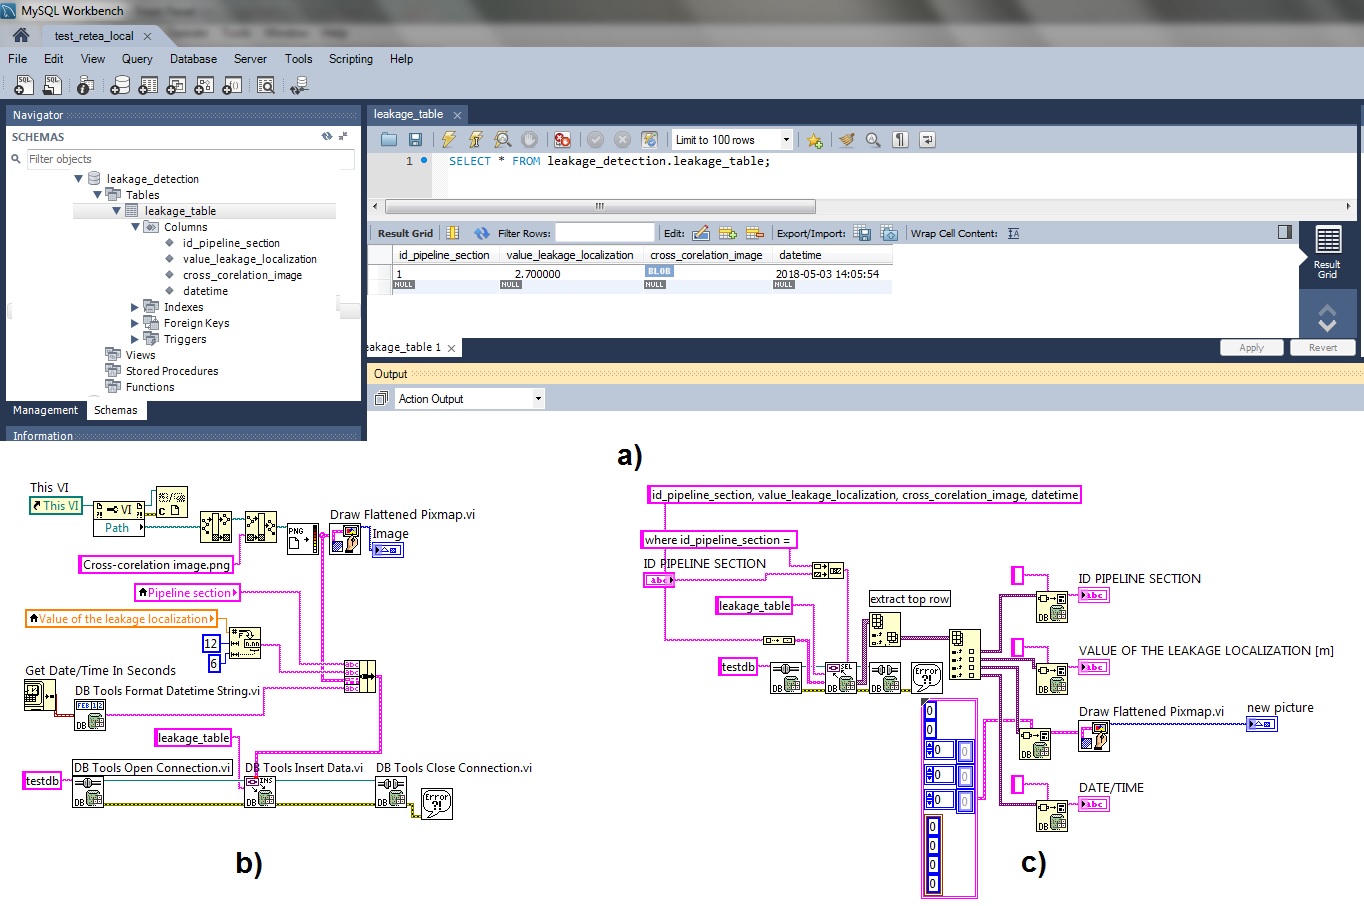 | Figure 10. The software block diagram for Database connection: (a) Database structure, (b) Database Write Module, (c) Database Read Module |
4. Experiments
- Figure 11 presents an experimental model which will follow the steps described in the previous sections for pipe leak location. The origin point of the axis system is fixed in sensor S1 and the axis is oriented towards sensor S2. The length of the studied pipe section is of 12 m and the sound propagation speed in the pipe is of 5500 m/s.
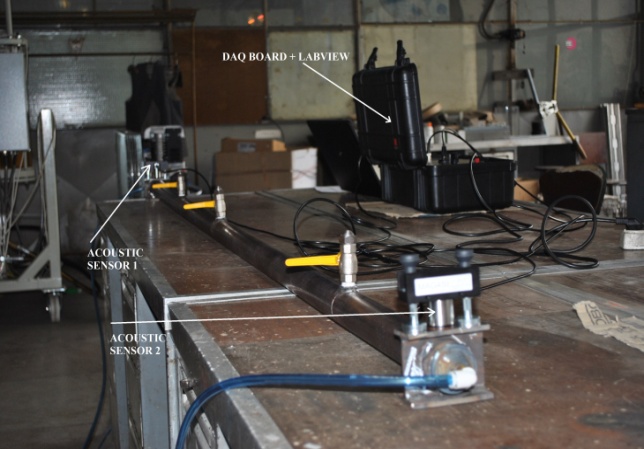 | Figure 11. Experimental image |
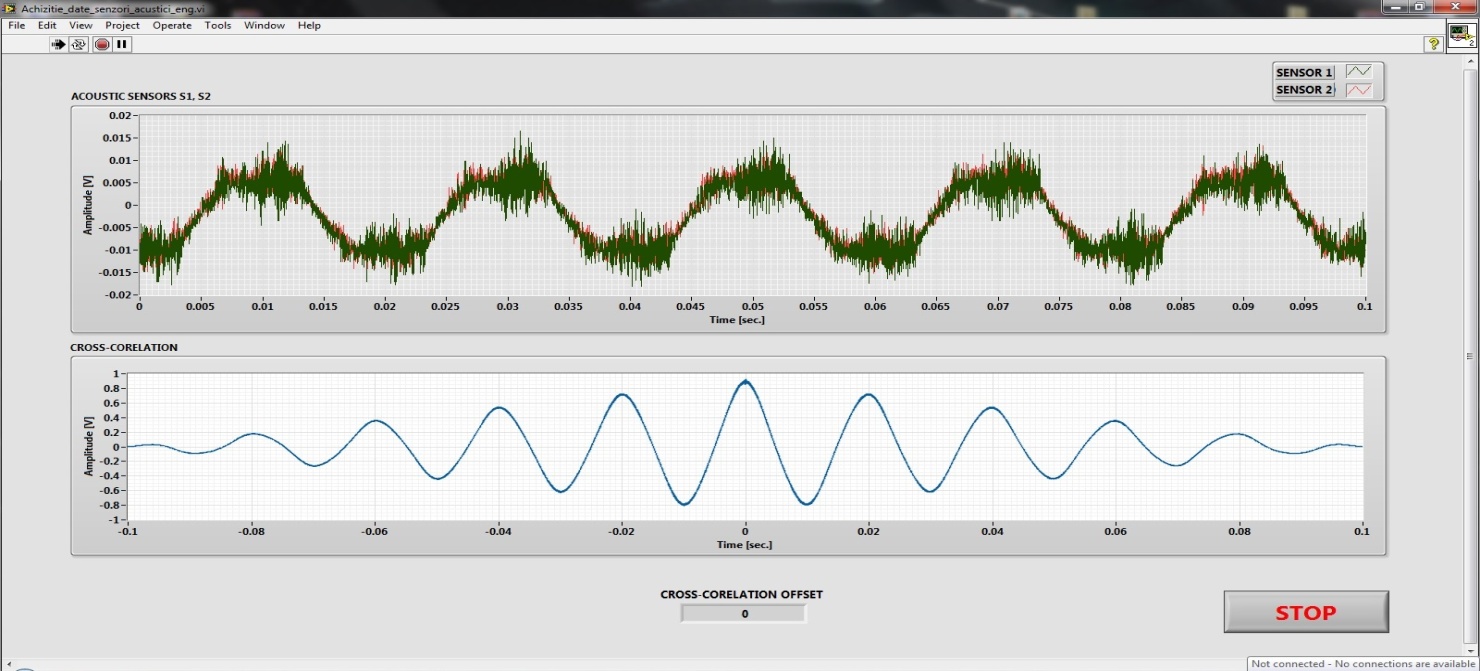 | Figure 12. Software interface for simulation of the leakage in the middle of the sensors |
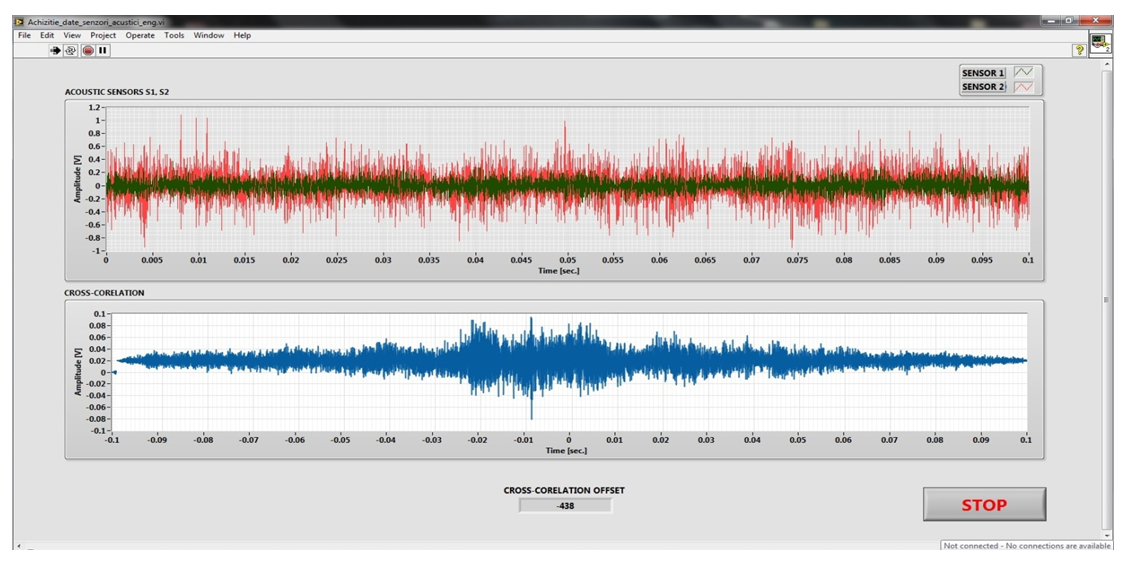 | Figure 13. Software interface for simulation of the leakage near to S2 |
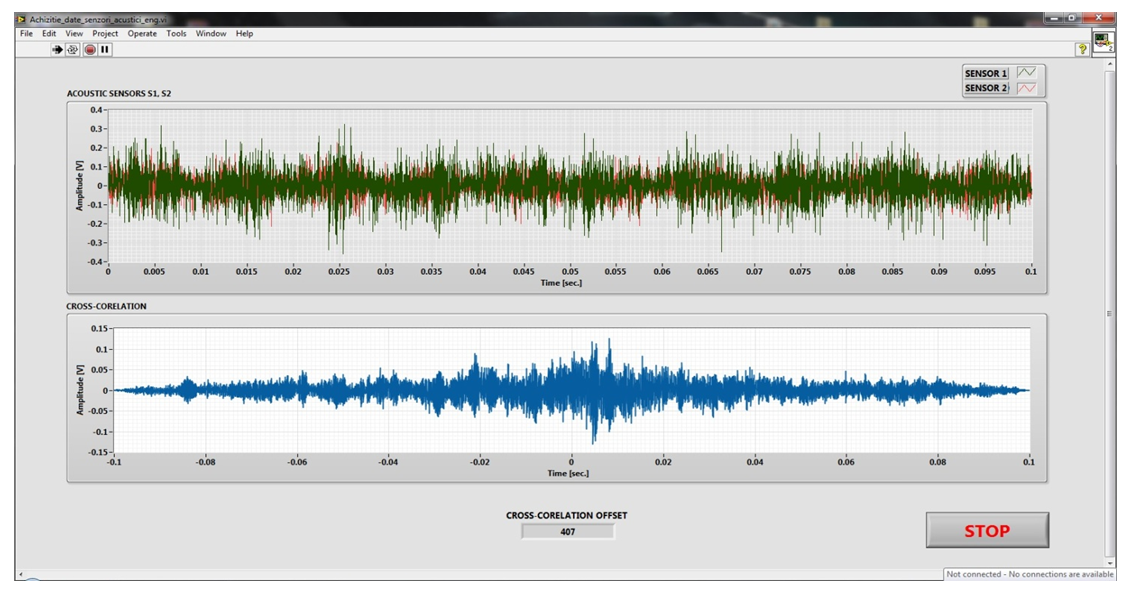 | Figure 14. Software interface for simulation of the leakage near to S1 |
5. Conclusions
- The use of acoustic emission technique for leak-off location is the top method, made possible due to the development of electronics (high-performance sensors, data acquisition systems) as well as the development of high-performance software with computing power and precise pipe fault location.By following the steps specified by the EA technique, a pipeline leak-off detection system was developed and presented based on the cross-correlation method. The system estimate the position of the pipeline leakage based on LabVIEW, graphical programming environment, stores the acquired data in a MySQL Server type database and automatically creates and prints reports.As a result of experiments it was found that the system has a relatively good accuracy, subsequent developments will focus on expanding the system to a wireless multi-sensor network for leak-off detection in intertwined pipeline sections.
ACKNOWLEDGEMENTS
- The paper was developed with funds from the Ministry of Scientific Research as part of the NUCLEU Program: PN 16 15 02 03.