Didit Sumardiyanto, Sri Endah Susilowati, Anton Cahyo
Department of Mechanical Engineering, 17 Agustus 1945 University, Jakarta, Indonesia
Correspondence to: Didit Sumardiyanto, Department of Mechanical Engineering, 17 Agustus 1945 University, Jakarta, Indonesia.
| Email: |  |
Copyright © 2018 Scientific & Academic Publishing. All Rights Reserved.
This work is licensed under the Creative Commons Attribution International License (CC BY).
http://creativecommons.org/licenses/by/4.0/

Abstract
On the machining operation, the quality of surface finish is an important requirement for many turned workpieces. In the process of cutting using a lathe, the selection of appropriate cutting parameters is essential to control the required surface quality. Thus, the choice of optimized cutting parameters is very important for controlling the required surface quality. In some industrial places, there are many difficulties to create components according to the demands of the working drawings. Machine operators usually use “trial and error” approaches to set-up machine cutting conditions in order to achieve the desired surface roughness. Obviously, the “trial and error” method is not effective and efficient and the achievement of the desired value is a repetitive and empirical process that can be very time-consuming. The dynamic nature and widespread usage of cutting operations in practice have raised a need for seeking a systematic approach that can help to set-up cutting operations in a timely manner and also help achieve the desired surface roughness quality. Therefore, research is done to determine the effect of spindle speed variation, feed rate, and depth of cut to the surface roughness of the lathe process. The result of this research showed that the factors that influence the surface roughness level of carbon steel material are spindle speed followed by feed rate and depth of cut. To get the result of smooth surface roughness with Ra value about 1.18 μm, setting parameter used is spindle speed 600 rpm, 130 m/min feed rate and 1.5 mm cutting depth. To obtain a rough surface roughness of about 6.25 μm, the setting parameters used are 400 rpm spindle speed, 240 m/min feed rate, and 1.0 mm cutting depth.
Keywords:
Surface Roughness, Spindle Speed, Feed Rate, Depth of Cut
Cite this paper: Didit Sumardiyanto, Sri Endah Susilowati, Anton Cahyo, Effect of Cutting Parameter on Surface Roughness Carbon Steel S45C, Journal of Mechanical Engineering and Automation, Vol. 8 No. 1, 2018, pp. 1-6. doi: 10.5923/j.jmea.20180801.01.
1. Introduction
As a basic machining process, lathing is one of the most widely used metal removal processes in industry and lathe surfaces are largely used to mate with other parts in die, aerospace, automotive, and machinery design as well as in manufacturing industries [1, 2]. Surface roughness is an important measure of the technological quality of a product and a factor that greatly influences manufacturing cost. Lathe is one of the most reliable production machines by the manufacturing industry in producing its products. The product quality of the lathe process is determined by the degree of roughness of the surface. In the process of cutting metal using lathe the resultof roughness is determined by three main parameters, namely movement of workpiece/spindle main motion, feed motion and depth of depth cut [3]. While other researchers said that the parameters that determine the surface roughness is the depth of cut, feed rate and cutting speed [4]. Suresh et al. [5], investigated effects of cutting speed, feed rate, depth of cut and machining time on cutting forces, tool wear and surface roughness during turning operation of an AISI 4340 hardened steel by using the RSM method. They stressed that in order to minimize cutting force and surface roughness, it is necessary that high cutting speed, low feed rate, low depth of cut and short machining time are employed whereas minimization of tool wear requires low feed rate and low cutting speed.Surface roughness is a predominant characteristic in evaluating surface quality of the machined component which is included in the machining drawing [6]. It’s usually related to correct performance of a part. Hence, obtaining good surface quality is required in most machining applications, so that it has a vital role in influencing the customer satisfaction in manufacturing, however machined surface quality demands significantly affect cost of production and increase the price of a product. Surface roughness is affected by many factors in machining process. Machined components during their useful life are significantly influenced by surface roughness which affects several properties such as; corrosion resistance and fatigue strength, wear resistance, coefficient of friction, ability of distributing and holding a lubricant, load bearing capacity, heat transmission, and coating [7]. Therefore, control of the machined surface roughness is essential and appropriate processes parameters have to be selected to reach the desired surface quality machined parts [8]. Surface roughness is measured by the vertical deviations of a real surface from its horizontal ideal form. If these deviations are relatively large, the surface is rough; if they are relatively small, the surface is smooth [9].Based on the movement, then in operating the lathe must know and able to calculate the setting parameters of the movement to produce smooth surface. Therefore it is necessary to conduct a test to produce parameters that include the value of the roughness of the cut surface to produce products in accordance with the desired quality demands. From the data of research result that is processed by using RSM method (Response Surface Methodology) hence will get the most influential factor in determining level of surface roughness at machining process by using lathe [10].The purpose of this research are:1. Knowing the level of surface roughness of carbon steel S45C resultof cutting in lathe process based on variations of spindle speed, feed rate and depth of cut using cutting tools insert tip Finishing VBMT 16.2. Provides parameter setting information for spindle speed, feed rate and depth of cut on the resulting surface roughness level.
2. Experimental Methods
Materials used as specimens are S45C commonly used as materials for machining products because S45C material has advantages in machineability, weld ability, and ability to process heat treatment. The design form of the cylinder specimen dimensions ø27x45 mm, as shown in Figure 1.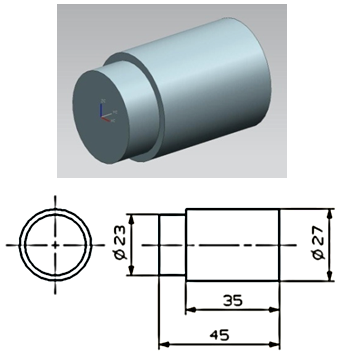 | Figure 1. Specimen Design Test |
Tools used:1. Computer-based Lathe Machine (CNC) brand Tornado 100 (Figure 2).2. Surface roughness test kit, Research Tesa 10 Roughness Gauge, which is a direct measure instrument using the stylus needle method as the reader sensor and the roughness rate can be viewed directly on the digital display / LCD display (Figure 3).3. The slitting knife used in the manufacture of specimens is a type of insert tip Finishing VBMT 16 brands Sanvic Holder SVJBR 2020K. (Figure 4).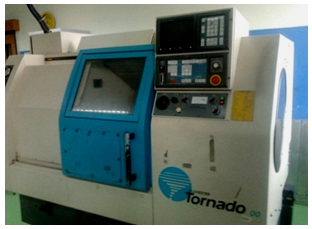 | Figure 2. Tornado100 Lathe Machine |
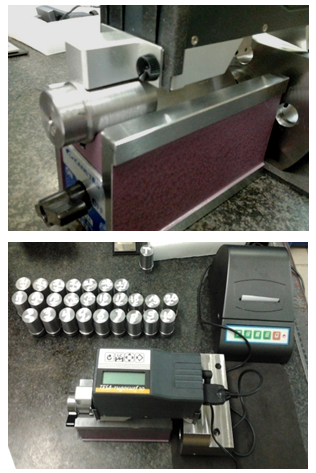 | Figure 3. Surface roughness test device, Tesa Rugosurf 10 Roughness Gauge |
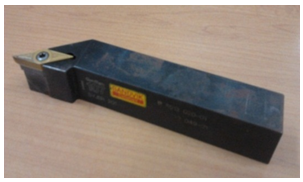 | Figure 4. Cutting knife VBMT 16 - SVJBR 2020K |
Research design:1. Preparation of lathe, and parameter to be tested. The setting parameters consist of:a. Spindle speed, rpm: 400, 500 and 600b. Feed rate, m/min: 130, 180 and 240c. Depth of cut, mm: 0.5, 1.0 and 1.52. Preparation of specimens S45C.3. Performed cutting process with variation of spindle speed, feed rate and depth of cut.4. Measurement of roughness by testing the roughness of the test specimens resulting from the lathe process, and recording the test results. This test uses Rugosurf Tesa10 Roughness Gauge.5. Analysis and discussion with statistical calculations.
3. Result and Discussions
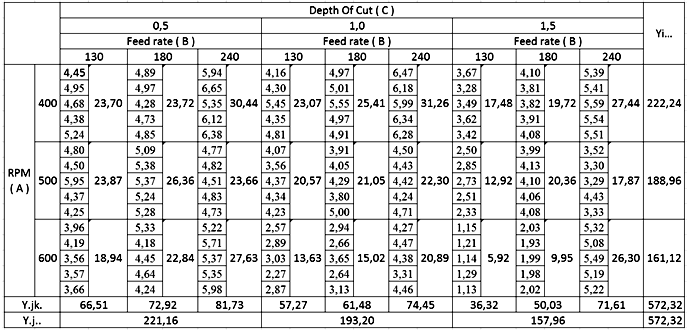
The results of measurements on various variations of the specimens, obtained surface roughness level (Ra) as in Table 1:Table 1. Test result
 |
| |
|
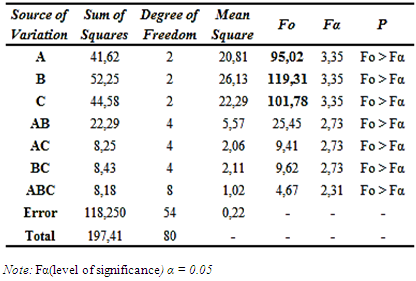
To measure the level of surface roughness by using the 3³ design analysis of general factorial design with level of significance α = 95%, α = 0,05 [11]. The independent variable is defined as: A = spindle speed, B = feed rate and C = depth of cut.There are 7 pairs of hypotheses (H0 and H1) that can be tested:a. Based on variation of spindle speed (A):§ Ho: τ1 = τ2 = ... ... = τa = 0; spindle speed does not affect the level of roughness.§ H1: at least one τi ≠ 0; spindle speed affect the level of roughness.b. Based on variation of feed rate (B):§ Ho: β1 = β2 = ... ... = βb = 0; the speed of the feed rate does not affect the level of roughness.§ H1: at least one βj≠0; the speed of the feed rate affect the level of roughness.c. Based on variation of depth of cut (C):§ Ho: γ1 = γ2 = ... ... = γb = 0; depth of cut does not affect the level of roughness.§ H1: at least one γj ≠ 0; depth of cut affect the level of roughness.d. Based on the interaction between spindle speed (A) and feed rate (B):§ Ho : (τβ) ij = 0 for all i, j; the interaction between A and B does not affect the level of roughness.§ H1: at least one (τβ) ij ≠ 0; the interaction between A and B influences the level of roughness.e. Based on the interaction between depth of cut (C) and feed rate (B):§ Ho : (γβ) ij = 0 for all i, j; the interaction between C and B have no effect on the level of roughness.§ H1: at least one (γβ)ij ≠ 0; the interaction C and factor B influences the level of roughness.f. Based on the interaction between spindle speed (A) and depth of cut (C):§ Ho: (τγ) ij = 0 for all i, j; the interaction between A and C have no effect on roughness level.§ H1: at least one (τγ) ij ≠ 0; the interaction between A and C influences the level of roughness.g. Interaction of three factors A, B and C:§ Ho: (τβγ) ij = 0; the interactions between A, B, and C have no effect on roughness. § H1: (τβγ) ij ≠ 0; the interaction between A, B, and C affects the level of roughnessThe calculation of the surface roughness level (Ra) in the Table 2:Table 2. Analysis of variance surface roughness level
 |
| |
|
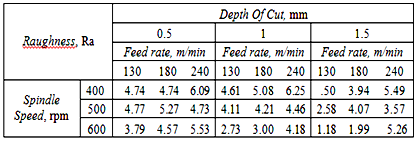
The value of Fo in Table 2 is compared with the value of Fα (F table). If Fo > Fα then the factor has an influence on the variable being tested and if Fo < Fα then the factor has little or no effect. Thus the values of Fo and Fα in Table 2 can be seen and concluded whether the factors affect or not to the level of surface roughness.a. Based on spindle speed variation (A), Fo = 95.02 > Fα = 3.35 then H1 accepted that spindle speed effect on surface roughness with 5% significance level.b. Based on variation of feed rate (B), Fo = 119.31 > Fα = 3.35 then H1 is accepted that feed rate affect the level of surface roughness with 5% significance levelc. Based on the variation of depth of cut (C), Fo = 101.78 > Fα = 3.35 then H1 is accepted that depth of cut affect the level of surface roughness with 5% significance level.d. Based on the interaction between A and B, Fo = 25.45 > Fα = 2.73 then H1 accepted that the interaction between spindle speed variation and feed rate affect the level of surface roughness with 5% significance level.e. Based on the interaction between A and C, Fo = 9.41 > Fα = 2.73 then H1 accepted that the interaction between spindle speed variation and depth of cut affects the level of surface roughness with 5% significance level.f. Based on the interaction between B and C, Fo = 9.62 > Fα = 2.73 then H1 accepted that the interaction between feed rate and depth of cut affects the level of surface roughness with 5% significance level.g. And based on the interaction of A, B and C , Fo = 4.67 > Fα = 2.31 then H1 accepted that the interaction between spindle speed, feed rate and depth of cut affects the surface roughness level with 5% significance level.Table 2 showed FoB value (feed rate) = 119.31, FoC value (depth of cut) = 101.78 while FoA (spindle speed) = 95.02. Of the three variables, the most influential on the level of surface roughness of the lathe process are: feed rate, followed by depth of cut and the last is spindle speed.To know the value of the smallest and largest surface roughness level based on the interaction of three factors, namely spindle speed, feed rate and depth of cut can be seen in table 3.Table 3. Average surface roughness level (Ra)
 |
| |
|
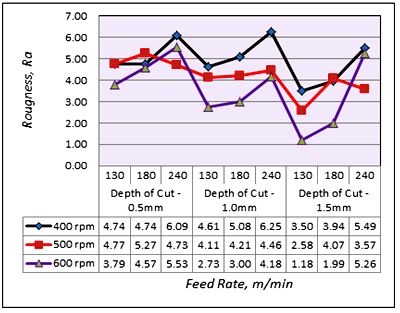 | Figure 5. Relation of surface roughness with spindle speed (A), feed rate (B) and depth of cut (C) |
Table 3 and Figure 5 showed that the surface roughness value with the smallest Ra value/ smooth surface is at 600 rpm spindle speed, 130 m/min feed rate and 1.5 mm slice of 1.18 μm. And the level of surface roughness with the largest Ra(rough surface) is found in the interaction of 400 rpm spindle speed, 240 m/min feed rate and 1.0 mm cutting depth at 6.25 μm.Table 4. The level of surface roughness influences factors A and B
 |
| |
|
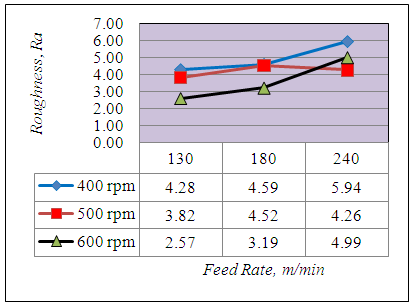 | Figure 6. The influence of A and B factors on surface roughness |
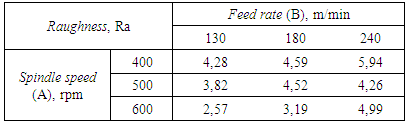
Based on the interaction of two factors, the relationship of surface roughness value with spindle speed variation can be seen in Table 4 and Figure 6, where the value of surface roughness level (Ra) smallest (smooth) is in spindle 600 rpm interaction and 130 m/min cutting speed of 2.57 μm. The highest (rough) surface roughness rate (Ra) is found in spindle 400 rpm interaction and 240 m/min cutting speed of 5.94 μm.Table 5. The level of surface roughness influences factors A and C
 |
| |
|
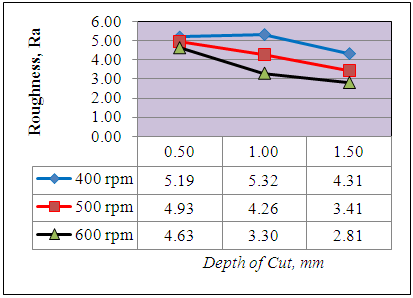 | Figure 7. The influence of A and C factors on surface roughness |
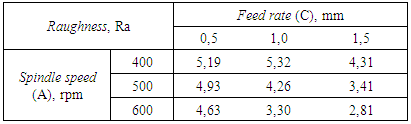
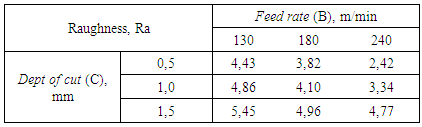
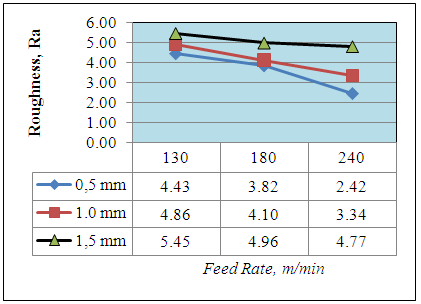
The correlation of surface roughness based on the interaction between spindle speed variation with variation of depth of cut can be seen in Table 5 and Figure 7, which showed the smallest level of surface roughness (Ra) is present in the 600 rpm spindle spindle interaction, and 1.5mm cutting depth of 2.81 μm. And the highest (rough) surface roughness rate (Ra) is found at spindle spindle interaction speed 400 rpm, and cutting depth of 1 mm is 5.32 μm.Table 6. The level of surface roughness influences factors B and C
 |
| |
|
 | Figure 8. The influence of B and C factors on surface roughness |
The correlation of surface roughness based on the interaction between depth of cut variation with variation of feed rate can be seen in table 6 and figure 8.The Response Surface Methodology (RSM) is a collection of statistical and mathematical techniques useful for analyzing the problems of some independent variables that affect the dependent variable of the response, and aims to optimize the response [10, 12]. Thus, the surface response methodology can be used to find a suitable approach function for predicting future responses and determining the values of the independent variables that optimize the responses learned.The independent variable is defined as: A = spindle speed, B = feed rate, C = depth of cut, while the response (Y) is the result of surface roughness. The result of surface roughness (Y) is a function of spindle speed variation (A), feed rate (B), and depth of cut (C), and can be expressed as follows:Y = f (A, B, C)The RSM method will produce graphs so that it can be known which parameters can produce the most optimal tensile strength and can predict the future response and determine the values of the independent variables that optimize the response that has been obtained.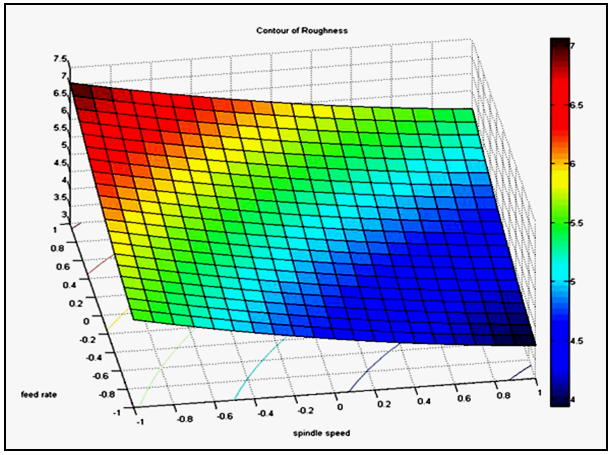 | Figure 9. The relationship between the spindle speed and feed rate |
Figure 9 showed that the higher spindle speed and the slower the feed rate will produce the smoother surface.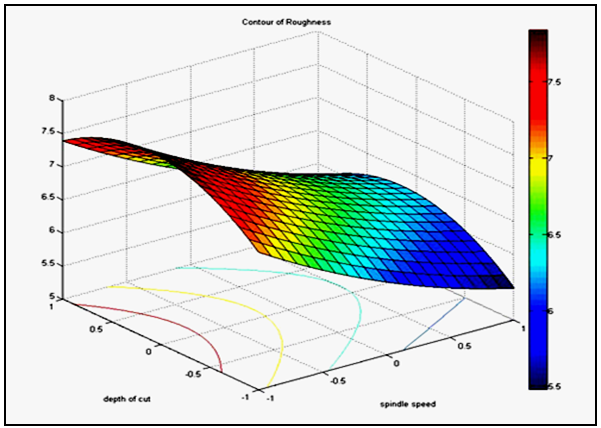 | Figure 10. The relationship between the spindle speed and depth of cut |
Figure 10 showed that the higher spindle speed and smaller depth of cut will result in smoother surfaces.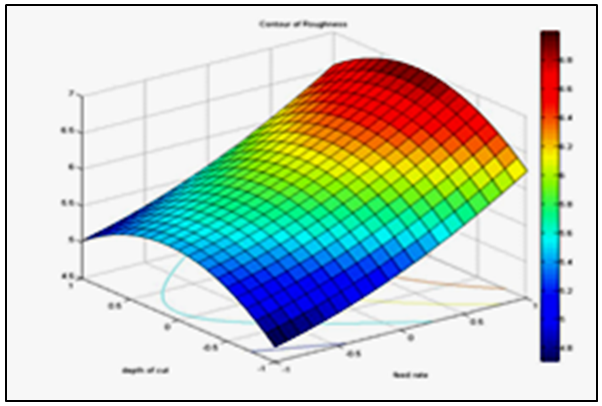 | Figure 11. The relationship between the feed rate and depth of cut |
Figure 11 showed that the slower the feed rate and the smaller the depth of the cut will produce the smoother surface.
4. Conclusions
This study concluded that:1. The spindle speed is the most influential factor on the surface roughness level of S45C carbon steel material in the lathe using the type of insert tip finishing tool VBMT 16 brands SANVIC Holder SVJBR 2020K, followed by feed rate and depth of cut.2. To get the result of smooth surface with roughness level Ra approximately 1.18 μm, setting parameter used is spindle speed 600 rpm, feed rate 130 m/min and depth of cutting 1.5 mm. To obtain a surface roughness level of Ra approximately 6.25 μm, the setting parameters used are 400 rpm spindle speed, 240 m/min feed rate and depth of cutting 1.0 mm.
References
| [1] | T.S. Lee., Y.J. Lin, A3D Predictive Cutting- Force Model for End Milling of Parts Having Sculptured Surfaces, The International Journal of Advanced Manufacturing Technology, Vol :16 , 2000 , pp. 773-783. |
| [2] | Altintas Y, Direct Adaptive Control of End Milling Process, International Journal of Machine Tools and Manufacture, Vol: 34, pp. 461- 472. |
| [3] | Aquino, Thomas W, Modul Teori Praktek Manufaktur Dasar 1 Section Turning, Politeknik Manufaktur Astra Jakarta, 2012. |
| [4] | Kalpakjian S, Schmit R. Steven, Manufacturing Engineering and Technology, Fourth edition, London: Prentice, 2002. |
| [5] | R. Suresh, S. Basavarajappa, V.N. Gaitonde and G.L. Samuel, Machinability Investigations on Hardened AISI 4340 steel using coated carbide insert, Int. J. Refract. Metals Hard Mater.33: (2012), 75-86. |
| [6] | P.N. Rao, Manufacturing Technology Metal Cutting & Machine Tools, McGraw-Hill Companies Inc., USA, 2000. |
| [7] | Natarajan C, S. Muthu and P. Karuppuswamy, Investigation of Cutting Parameters of Surface Roughness for a Non-Ferrous Material Using Artificial Neural Network in CNC Turning, Journal of Mechanical Engineering Research Vol. 3(1), 2011, pp. 1-14. |
| [8] | Ilhan A, Mehmet Ç, Modeling and Prediction of Surface Roughness in Turning Operations Using Artificial Neural Network and Multiple Regression Method, ELSEVIER, Expert Systems with Applications, Volume 38, Issue 5, May 2011, Pages 5826–5832. |
| [9] | Hassan Abdel - Gawad El-Hofy, Fundamental of Machining Processes, CRC Press, Taylor & Francis Group, 2014. |
| [10] | Bradley, Nuran, The Response Surface Methodology, Departement of Mathematical Sciences Indiana University of South Bend, 2007. |
| [11] | Montgomery, Douglas C. 2005. Design and Analysis of Experiments: Response surface method and designs. New Jersey: John Wiley and Sons, Inc. |
| [12] | Myers, Raymond H., Khuri, Andre I. and Carter, Walter H., Jr. 1989. Response surface methodology: 1966-1988. Technometrics 31 (2): 137-153 http://wwwjstor.org/ (accessed January 29, 2007). |

 Abstract
 Reference
 Full-Text PDF
 Full-text HTML