-
Paper Information
- Paper Submission
-
Journal Information
- About This Journal
- Editorial Board
- Current Issue
- Archive
- Author Guidelines
- Contact Us
Journal of Mechanical Engineering and Automation
p-ISSN: 2163-2405 e-ISSN: 2163-2413
2017; 7(5): 164-171
doi:10.5923/j.jmea.20170705.08

Effects of Surface Tension on Liquid Film Behavior and Interfacial Shear Stress of Two-Phase Annular Flow in a Vertical Pipe
 Abstract
 Reference
 Full-Text PDF
 Full-text HTML
Fuminori Matsuyama1, Akimaro Kawahara2, Michio Sadatomi2, Kenji Nakashima1, Yuuki Johno3
1Department of Mechanical Engineering, National Institute of Technology, Sasebo College, Sasebo, Japan
2Department of Graduate School of Science and Technology, Kumamoto University, Kumamoto, Japan
3Department of Chemical and Biological Engineering, National Institute of Technology, Sasebo College, Sasebo, Japan
Correspondence to: Fuminori Matsuyama, Department of Mechanical Engineering, National Institute of Technology, Sasebo College, Sasebo, Japan.
| Email: |  |
Copyright © 2017 Scientific & Academic Publishing. All Rights Reserved.
This work is licensed under the Creative Commons Attribution International License (CC BY).
http://creativecommons.org/licenses/by/4.0/

The purpose of the present study is to clarify experimentally the effects of surface tension on liquid film in upward annular flows in a vertical pipe of 19.2 mm i.d. and 5.4 m long. In the experiment, air was the test gas, while water and/or a dilute water solution of Polyoxyethylene-Lauryl-Ether (PLE for short) the test liquid. The surface tension of water was 72 dyne/cm and that of PLE 45 dyne/cm, but the viscosity and the density were nearly the same between these liquids. The liquid film behavior was studied using both the photograph and the time and spatial characteristics of peripheral-mean liquid holdup, which was detected with a series of 63 liquid holdup sensors each axially 15 mm apart in a constant current method. The data showed that the liquid film behavior strongly depends on the surface tension, i.e., the passing frequency of the large waves for PLE decreased remarkably; the wave height of the large waves for PLE became lower like small waves; the passing frequency of the small waves for PLE increased; and the small wave velocity for PLE became faster. Furthermore, the experimental data on the mean liquid film thickness and the gas-liquid interfacial shear stress were analyzed and discussed based on the result of the liquid film behavior.
Keywords: Two-Phase flow, Annular Flow, Surface Tension, Interfacial Friction
Cite this paper: Fuminori Matsuyama, Akimaro Kawahara, Michio Sadatomi, Kenji Nakashima, Yuuki Johno, Effects of Surface Tension on Liquid Film Behavior and Interfacial Shear Stress of Two-Phase Annular Flow in a Vertical Pipe, Journal of Mechanical Engineering and Automation, Vol. 7 No. 5, 2017, pp. 164-171. doi: 10.5923/j.jmea.20170705.08.
Article Outline
1. Introduction
- Gas-liquid annular two-phase flow is the flow which is composed of annular liquid film on the tube wall and a continuous gas core with or without liquid entrainments. Such annular flow is frequently appeared in many types of equipment, e.g., steam generators in power plants, various boilers and air conditioners. The high temperature water and refrigerant used in these equipments have lower surface tension than normal temperature water. However, the effects of surface tension on the liquid film flow behavior have never been reported besides Sadatomi et al. [1]. On the liquid film in general, there are various waves, different in behavior, such as velocity and height, and the spatial distribution of individual wave changes with time as reported by, e.g., Fukano et al. [2], Furukawa et al. [3], Al-Sarkhi et al. [4] and Sato et al. [5]. The liquid film in annular flow, therefore, shows a very complicated behavior. The structure of liquid film consisting of such complicated waves must affect not only on the gas-liquid interfacial shear stress and the flow mechanism inside the liquid film but also on the heat transfer characteristics of the liquid film flow.Following to the above studies, the purpose of the present study is to clarify experimentally the effects of surface tension on the liquid film behavior, such as the time-spatial distribution of the liquid film thickness, the wave height, and the mean velocity and the passing frequency of the waves.In the experiments, water and a dilute water solution of Polyoxyethylene-Laury-Ether (PLE for short), having a surface tension of 45 dyne/cm, were used as the test liquids, while air as the test gas. Why the dilute water solution of PLE was used is that it reduces the surface tension but does not induce the drag reduction as reported by Fang et al. [6]. One of the test liquid and air at room temperature and atmospheric pressure flowed co-currently vertical up in a 19.2 mm i.d. circular tube. Experimental data were obtained for the liquid film thickness, the height, the velocity and the passing frequency of the waves, the interfacial shear stress and the interfacial friction factor, in order to determine the effects of surface tension. The results of such experiments and the analyses of the respective data are presented in this paper.
2. Experimental Methods
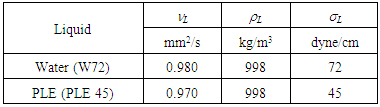
- The properties of the test liquids are shown in Table 1. The kinematic viscosity (L) and the density (L) are nearly equal between water and the dilute water solution of PLE. The surface tension (L) of the dilute water solution of PLE is 45 dyne/cm, about 60 % of 72 dyne/cm for the test water. These test liquids hereafter are abbreviated as PLE45 and W72 by accounting for the surface tension.
|
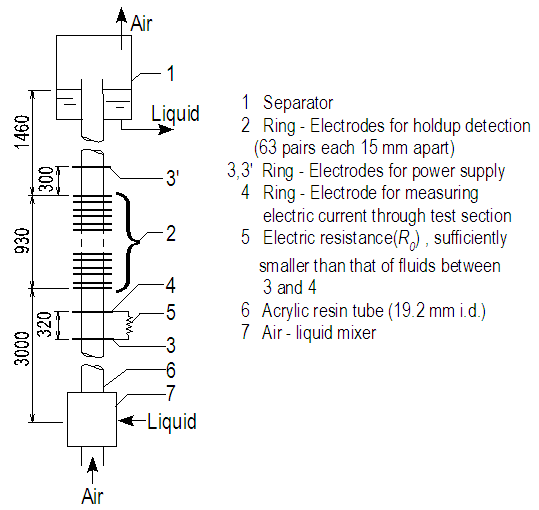 | Figure 1. Test rig |
3. Experimental Result and Discussions
3.1. Liquid Film Behaviour
- Figure 2 show the time-spatial characteristics map (referred to as TS map in this paper) of the liquid film thickness, tf, respectively for (a) air-W72 and (b) air-PLE45. In the TS map, tf signals from 63 pair holdup sensor are simultaneously shown on the respective axial distances with the same ordinate scale. The liquid film thickness, tf, is calculated by substituting the liquid holdup,
 , data into the following equation:
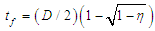 | (1) |
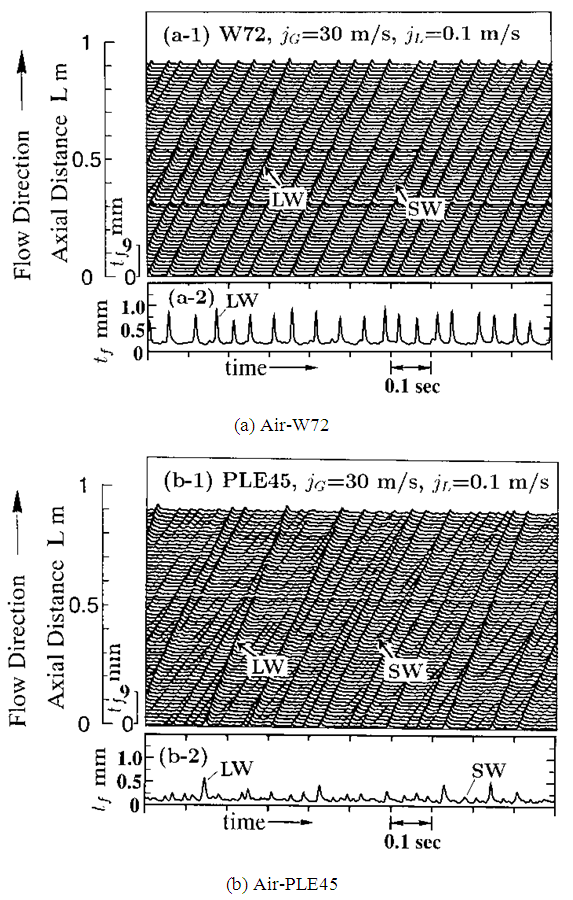 | Figure 2. Time-spatial characteristics map of liquid film thickness for air-W72 and air-PLE45 |
 , for PLE45 at jG = 20 m/s and jL = 0.1 m/s, and the corresponding passing frequency of each wave with different height. The frequency for W72 is also shown in Figure 4. The passing frequency,
  , was determined by the number of waves intersecting the line of arbitrary holdup value,
  , in Figure 3 per unit sampling time. The abscissa of Figure 4, tf, is determined from
  value by substituting into Eq. (1).
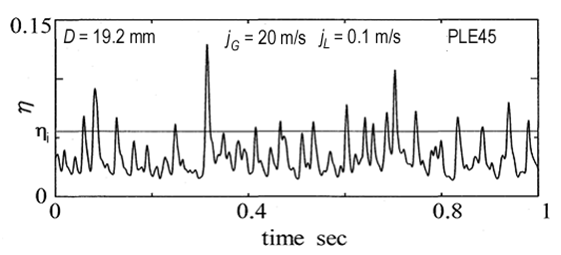 | Figure 3. Example of time variation data of liquid holdup signal,  |
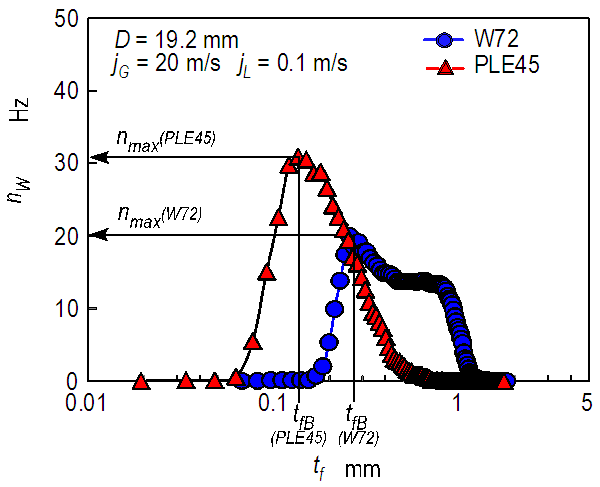 | Figure 4. Effects of surface tension on passing frequency of each wave with different height |
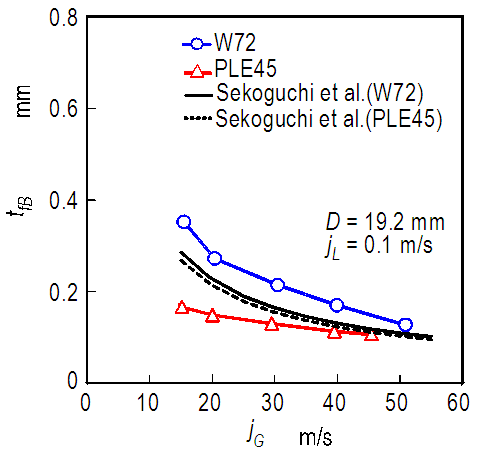 | Figure 5. Effects of surface tension on base film thickness, tfB |
3.2. Mean Values of Wave Velocities and Passing Frequencies for LW and SW
- Figure 6 shows the calculation method of the velocity and the passing frequency of individual wave in LWs and SWs in the TS map. Firstly, we picked up two tf signals from arbitrary two adjacent holdup sensors, each LP = 15 mm apart in axial direction. After studying the existing time or distance of individual wave, we discriminated LW from SW. Secondly, we calculate the transit time, tP, for example, A to A’, by a cross-correlation of the two waves. Finally, we determine the velocity of wave A, uW, as follows.
 | (2) |
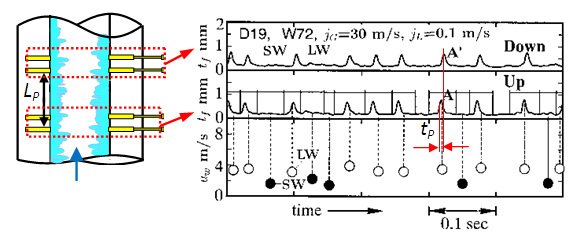 | Figure 6. Example of tf signals at two adjacent axial positions for determination of each wave velocity |
 and
and  , and the passing frequencies, NLW and NSW, were obtained as follows.
 | (3) |
 | (4) |
 | (5) |
 | (6) |
 and
and  at a fixed jL = 0.1 m/s. Also plotted as asterisk symbols are Nakasatomi’s data for air-water upward flows in a 25 mm i.d. vertical pipe [12]. Solid curve and broken curve are calculations by Sekoguchi et al.’s correlation [11]. Both
  and
and  increased with jG, and
  for PLE45 became much faster than that for W72 at the same jG.
  for PLE45, however, became a little faster than that for W72. In addition, the present
  data agree well with the Nakasatomi’s data irrespective of the difference in pipe diameter. From a comparison of
  and
and  for PLE45 and W72, the difference in the mean velocity between LWs and SWs for W72 is larger than that for PLE45. Similar tendency was also seen at other jL conditions. The cause of these is probably that the drag force on SW by air flow in the gas core is stronger for PLE45 depending on the denser SWs on the base film as mentioned before.
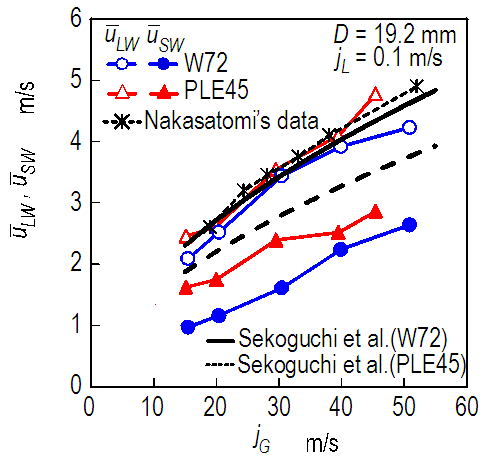 | Figure 7. Effects of surface tension on mean wave velocities, respectively for LWs and SWs |
 and NLW and the calculations shows qualitative agreement between them for W72. For PLE45, on the other side, the agreement of
  between them is not quantitative, and the agreement of NLW is bad. The cause of these is probably that Sekoguchi et al.’s correlation was based only on air-water data despite the correlation contains a surface tension term. Thus, Sekoguchi et al.’s correlation has a room of improvement.
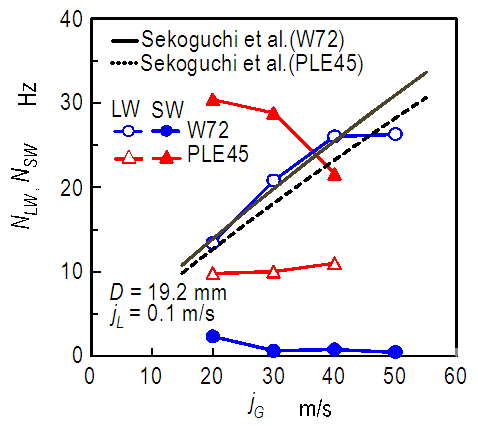 | Figure 8. Effects of surface tension on passing frequencies, respectively for LWs and SWs |
3.3. Gas-liquid Interfacial Shear Stress
- Figure 9 shows the gas-liquid interfacial shear stress data,
 , and the mean liquid velocity data,
  against jG at a fixed jL = 0.1 m/s. Here,
  data were determined from force balance equation in the gas core by neglecting hydrostatic head loss, i.e., determined by substituting pressure drop data, - dp/dz, into:
 | (7) |
 | Figure 9. Effects of surface tension on interfacial shear stress,  |
 increased with jG irrespective of difference in test liquid because the drag force on gas-liquid interface increase with jG. In addition,
  for PLE45 is larger than that of W72, because the liquid film surface for PLE45 became rougher with denser SWs like sharkskin than that for W72 as described in section 3.1. From the liquid film behavior in Figure 2, we believe that the effects of the denser SWs for PLE45 are larger than those of the sparser LWs for W72 on the interfacial shear stress. Furthermore, the mean liquid velocity, uL, for PLE45 is faster than that for W72 at all jG in Figure 9. Similar trend was also seen at other jL conditions.
3.4. Gas-Liquid Interfacial Friction Factor
- If we assume no liquid entrainment in the gas-core, we can determine the gas-liquid interfacial friction factor,
 , by substituting experimental data on the gas density,
  , the mean gas velocity, uG, and the gas-liquid interfacial velocity, ui, into the following equation:
 | (8) |
 where the mean liquid hold up can be determined as 1 - (1 - 2tfm / D)2. Since the mean value of the measured wave velocity was much slower than uG, the interfacial velocity, ui, is negligible in comparison to uG. In addition,
  was determined from Eq. (7). Thus, in the present study, Eq. (8) is reduced to:
 | (9) |
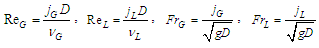
 , against the superficial gas Reynolds number,
 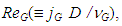 at a fixed jL of 0.1 m/s. Besides the present data for W72 and PLE45, Nakasatomi’s data for air-water upward flows in a 25 mm i.d. vertical pipe [12] are simultaneously plotted as square symbols. The trend of his data is similar to that of the present data, but his data is about 40% higher than the present data for W72, probably due to the difference in pipe diameter.Also shown on Figure 10(a) is the curve calculated by Blasius’ equation for single-phase turbulent flow in a pipe with hydraulically smooth wall:
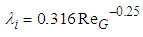 | (10) |
 data mentioned above show similar trends to the calculated curve by Blasius’ equation, but they show much higher value because of interfacial waves. In addition, the present data for PLE45 show higher value than that for W72, because the liquid film surface for PLE45 became rougher and denser like sharkskin than that for W72, as described in relation to Figure 2. Regarding the interfacial friction factor,
  , various correlations have been proposed so far. So, in the present study the correlations by Wallis [13], Moeck [14], Akagawa [15], Hori et al. [16], Fukano et al. [2] and Fore et al. [17] were tested against the present data. In Figure 10(a), calculated results by Akagawa’s correlation [15], Eq. (11), and Hori et al.’s correlation [16], Eq. (12), are drawn respectively as heavy solid and broken curves.
 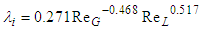 | (11) |
 | (12) |
 | (13) |
 is the viscosity of water at 20°C. Eq. (11) was based on air-water upward annular-mist flow data in 50.8 mm i.d. vertical pipe by Chien et al. [18]. The gas and the liquid Reynolds numbers covered were 70000 < ReG < 350000 and 1250 < ReL < 22100. On the other side, Eq. (12) was based on air-aqueous solution of glycerin upward annular ripple flow data in 19.8 mm i.d. vertical pipe. The kinematic viscosity of the aqueous solution was 10-5 m2/s, and the gas and the liquid Reynolds numbers covered were 15000 < ReG < 85000 and 5 < ReL < 55.
 data for W72 are higher than those determined by Eq. (11) and (12), but approach Eq. (11) as ReG increases. The cause of the difference in
  between W72 data and Eq. (12) is probably due to the difference in wave structure, i.e., disturbance wave for W72 data and ripple for Eq. (12). On the other side,
  data for PLE45 are two-times (or four-times) or more higher than those determined by Eq. (11) (or (12)) though the wave structure for PLE45 is similar to ripple since the waves for PLE45 mainly consist of SWs.
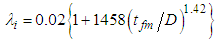
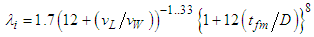
  correlations as a function of the mean liquid film thickness, tfm, have been proposed by Wallis [13], Eq. (14), Moeck [14], Eq. (15), Fore et al. [17], Eq. (16), and Fukano et al. [2], Eq. (17):
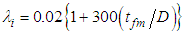 | (14) |
 | (15) |
 | (16) |
 | (17) |
 , by these correlations are drawn as six kinds of different curves against tfm/D. Eqs. (14) – (16) cannot fit the PLE45 data but can fit reasonably well the W72 data. Eq. (17) was based on systematic experiments using high viscosity liquids as the test liquid and includes liquid viscosity ratio to water at 20°C,
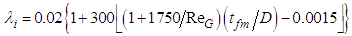
  . Eq. (17), however, over-predicts a little the W72 data, and under-predicts the PLE data. Thus, all these four equations cannot fit PLE45 data. Since the difference between the calculations and the PLE data increase with (tfm/D), Fore et al.’s correlation [17], Eq. (16), is tentatively modified by including
  ratio in the present study as follows:
 | (18) |
 correlation, we must collect
  and tfm data using a variety of liquids with different properties and different diameter test pipes in our future studies.
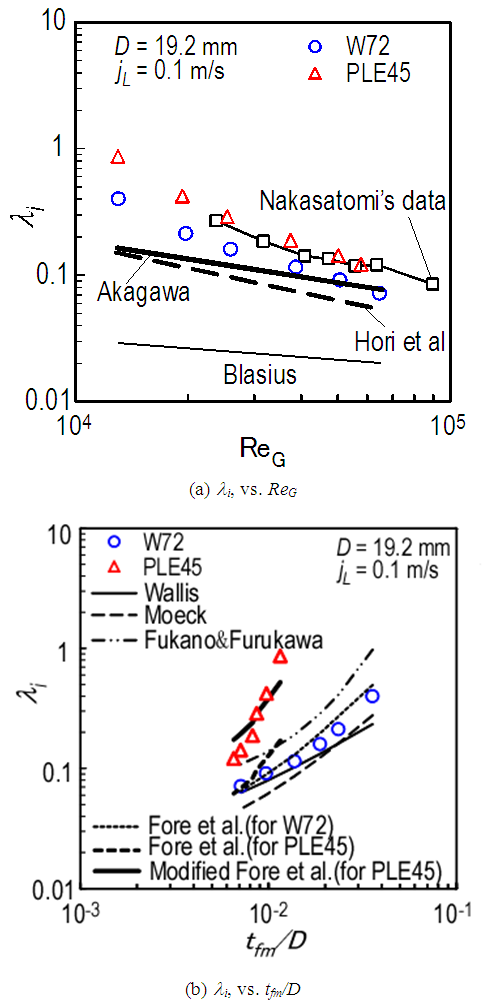 | Figure 10. Comparison of interfacial friction factor between experimental data and calculations by several correlations |
4. Conclusions
- In order to clarify the effects of surface tension on liquid film behaviour, experiments were conducted for upward annular flow in a 19.2 mm i.d. vertical pipe. As the test liquids, water and a dilute water solution of PLE were used. Main findings are as follow:1. By the reduction of surface tension, the passing frequency of LWs decreased, while that of SWs extremely increased. The surface of the base film for PLE45 became rougher and denser like sharkskin, and the film thickness became thinner than W72.2. Mean wave velocity of SWs,
 , for PLE45 became much faster than that for W72. That of LWs,
  , for PLE45, however, became a little faster than that for W72. Thus, the difference in velocity between LWs and SWs for W72 was higher than that for PLE45.3. The interfacial shear stress,
  , for PLE45 was larger than that of W72, because the liquid film surface for PLE45 became rougher and denser like sharkskin. The effects of denser SWs for PLE45 must be larger than those of sparser LWs for W72 on the interfacial shear stress.4. For interfacial friction factor,
  , Akagawa’s and Hori et al.’s correlations under-predict the present data for W72, but that by Akagawa approaches as ReG increases. Wallis’s, Moeck’s and Fore et al.’s correlations could not fit the PLE45 data but could fit reasonably well the W72 data. Fukano et al.’s correlation over-predicts a little the W72 data, and under-predicts the PLE data.5. Modified Fore et al.’s correlation proposed in the present study, which include surface tension effect, could fit reasonably well with the PLE45 data though it is tentative. In order to further improve
  correlation, we must collect
  and tfm data using a variety of liquids with different properties and different diameter test pipes in our future studies.