Victoria Akpan1, Chinwuba Victor Ossia1, Folajimi Fayemi2
1Offshore Technology Institute, ETF Gas Engineering Building, UniPark (Abuja) Campus, University of Port Harcourt, Nigeria
2TechnipFMC Nigeria Ltd, Ikoyi, Nigeria
Correspondence to: Chinwuba Victor Ossia, Offshore Technology Institute, ETF Gas Engineering Building, UniPark (Abuja) Campus, University of Port Harcourt, Nigeria.
| Email: |  |
Copyright © 2017 Scientific & Academic Publishing. All Rights Reserved.
This work is licensed under the Creative Commons Attribution International License (CC BY).
http://creativecommons.org/licenses/by/4.0/

Abstract
Wellhead systems experience varying types of fatigue loads from drilling to abandonment. Incidents of wellhead failure in the past has raised concerns about wellhead fatigue issues among operators. Different UWD-15 wellhead models have been studied for VIV fatigue in the Gulf of Guinea. MetOcean data from a typical offshore field in the Gulf of Guinea were obtained. Details of materials used for the wellhead models (Standard and RLSD system) were obtained from their design documents. The analysis was done using Strouhal numbers (St) 0.2 and 0.5, water depths ranged from 500 m to 1,200 m and return periods ranging from 1-year to 100-years. The natural frequencies for the RLSD system were observed to be higher than that for the Standard, with the fundamental frequency being 84.6 Hz and 69.3 Hz, respectively. The highest vortex shedding frequency which the RLSD and Standard systems will experience were found to be 0.151 Hz and 0.190 Hz, respectively at St = 0.5, 500 m water depth and 100-years return period. For both wellhead models, the natural frequencies were found to be greater than their respective vortex shedding frequencies, hence, VIV “Lock-in” phenomenon is unlikely. Since the given metOcean conditions are same from drilling to abandonment, it is unlikely that neither Standard nor RLSD wellhead systems will be affected by VIV fatigue phenomenon in the Gulf of Guinea, rather, other sources of fatigue loading may be relevant.
Keywords:
Subsea wellhead, Vortex shedding frequency, Lock-in frequency
Cite this paper: Victoria Akpan, Chinwuba Victor Ossia, Folajimi Fayemi, On the Study of Wellhead Fatigue due to Vortex Induced Vibration in the Gulf of Guinea, Journal of Mechanical Engineering and Automation, Vol. 7 No. 1, 2017, pp. 8-15. doi: 10.5923/j.jmea.20170701.02.
1. Introduction
1.1. Background
About one-third and one-fifth of the world’s energy needs are provided for by oil and natural gas respectively [1]. Huge volumes of these fossil fuels are found underwater and are also challenging to access [2].Offshore drilling comes with numerous challenges, including large water depths, rough seas etc [3]. In the bid to surmount these numerous challenges and prevent environmental pollutions, oil and gas companies now employ larger Blowout Preventer (BOP) stacks and massive oil rigs [4]. These large equipment sizes coupled with great water depths and harsh environmental conditions in turn increases fatigue loadings on subsea equipment such as casing and wellhead [5-8].Fatigue refers to the process of progressive localized permanent structural change occurring in a material subjected to conditions that produce fluctuating stresses and strains at some point or points and that may culminate in cracks or complete fracture after a sufficient number of fluctuations [9].The wellhead system is a control mechanism fitted at the top of a well. It allows casing strings to be hanged off on the wellhead while also serving as a structural foundation for the BOP weight and Christmas Tree [10].Wellhead systems are permanent structures installed during drilling operations [11]. Whether the well is abandoned or suspended for future re-entry or completed for production through to the decommissioning stage, the wellhead is subjected to diverse forms of fatigue loadings [12, 13].At the moment, there is no generally acceptable methodology for accessing wellhead fatigue [14]. Numerous studies have been done regarding wellhead fatigue some of which include wellhead fatigue monitoring [15] and wellhead fatigue calculation methodology [16]. Developing a universal wellhead fatigue calculation methodology is one of the focuses of the Structural Integrity Joint Industry Project (JIP). A product of this Joint Industry Project (JIP) is the Recommended Practice, DNVGL-RP-0142: Wellhead Fatigue Analysis [16]. However, this RP only provides a framework for assessing fatigue of wellhead/casing systems due to wave-induced loading and does not include VIV loads.
2. Materials and Methods
2.1. Modal Analysis
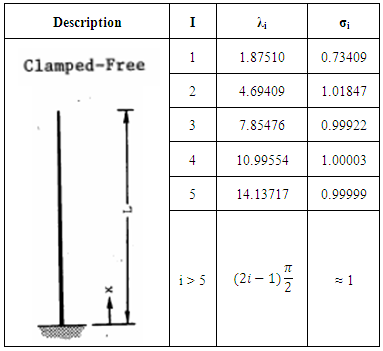
The wellhead system as installed subsea is considered a cantilever beam, clamped at one end and free at the other. Sea water is considered to be the internal fluid in the wellhead during the well suspension phase. The mode shapes for a cantilever beam subjected to free vibration is given as Equation (1) [17]. | (1) |
Where i = 1, 2, 3 … ∞.Table 1. Values of λ and σ at different modes [17]
 |
| |
|
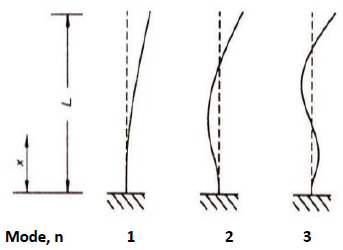
The natural frequency in hertz is given Equation (2).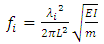 | (2) |
And I, the moment of inertia of the beam, for a circular cross-section is given as Equation (3) [18]. | (3) |
 | Figure 1. First three mode shapes and frequency parameters for a cantilever beam [18] |
2.2. Vortex Induced Vibration (VIV) Analysis
The frequency at which vortices were shed on the wellhead was determined by Equations (4a) and (4b). | (4a) |
 | (4b) |
The outer diameter of the rigid lock seal assembly was used in calculating the vortex shedding frequency for the Rigid Lock Stack Down wellhead system.In addition, vortex shedding frequencies for both wellhead systems were calculated for Strouhal number 0.2 and 0.5.Environmental data like current velocity with different return periods ranging from 1 – 100 years was also used. Variation of the current velocity relative to the water depth was also considered.After identifying the lock-in frequency, the second differential of equation (1) was obtained, Øn''.The bending moment was determined by Equation (5). | (5) |
The maximum bending stress was obtained using Equation (6). | (6) |
The UWD-15 Standard and RLSD both have butt welds on them and the Stress Concentration Factor (SCF) to be applied was also obtained.
2.3. Assessment of Fatigue
The DNV-RP-C203 was used as a guideline in assessing the fatigue life of the wellheads due to VIV when the phenomenon of “Lock-in” takes place. The fatigue life assessment is based on the S-N curve method. The design S-N curves are based on the mean-minus-two-standard-deviation curves for relevant experimental data.The S-N curves are thus associated with a 97.7% probability of survival [19].The basic design S-N curve is given by Equations (7) – (9) [19]. | (7) |
The fatigue life can be expressed as: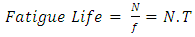 | (8) |
The fatigue criterion is given as: | (9) |
The main aim of the fatigue assessment is to ensure that the fatigue life is within the subjected design life of the system.
2.4. Fatigue Assessment Workflow
To ensure the wellhead satisfies the fatigue criterion as mentioned in equation (9), the workflow for adequately assessing the fatigue life of the wellhead system is as represented in Figure 2.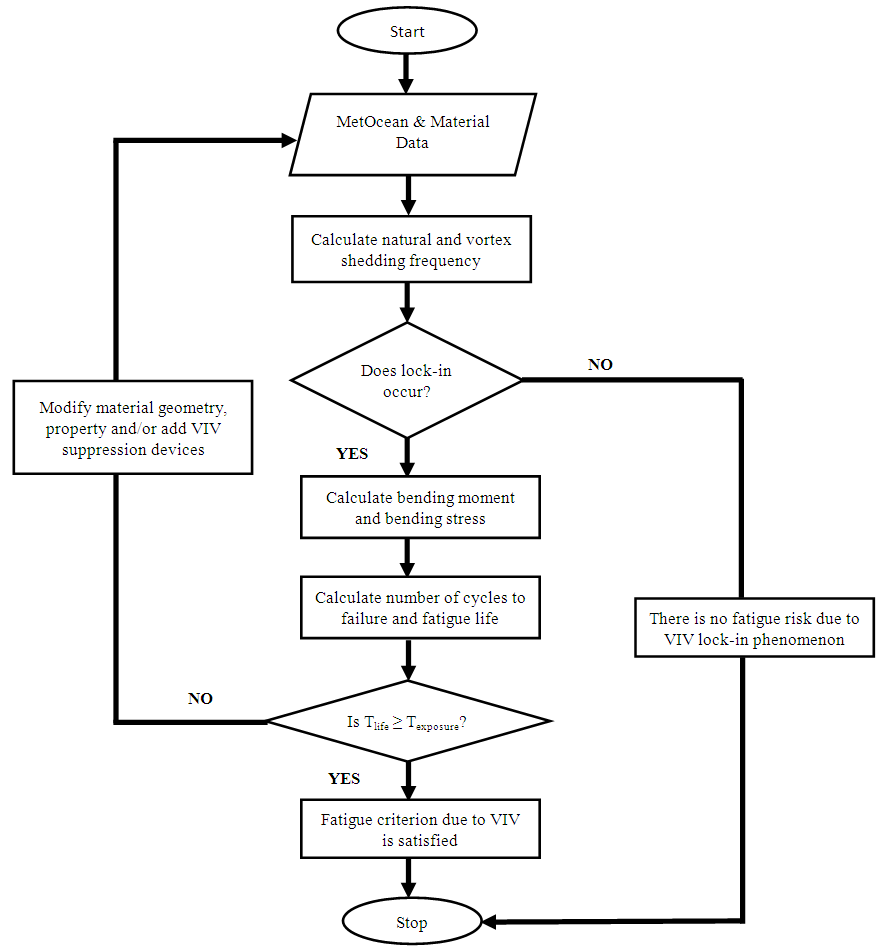 | Figure 2. Flowchart for VIV Assessment |
3. Results and Discussion
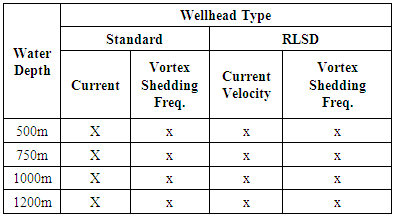
3.1. Vortex Induced Vibration (VIV) Matrix
The Table 2 shows a matrix of the VIV analysis carried out.The analysis was performed for the Standard and the RLSD wellhead systems. A combination of metOcean conditions was used. The Vortex Shedding frequency at Strouhal number 0.2 and 0.5, current velocity at different water depth and flood return period were determined. The natural frequency for the Standard and RLSD wellhead systems were also evaluated. The relationship between water depth, current velocity and flood return periods was also appraised.Table 2. VIV analysis matrix
 |
| |
|
3.2. Relationship between Current Velocity, Water Depth and Flood Return Period
Extreme metOcean design conditions for current speed for varying return period in years were obtained for this study and are represented in Figure 3.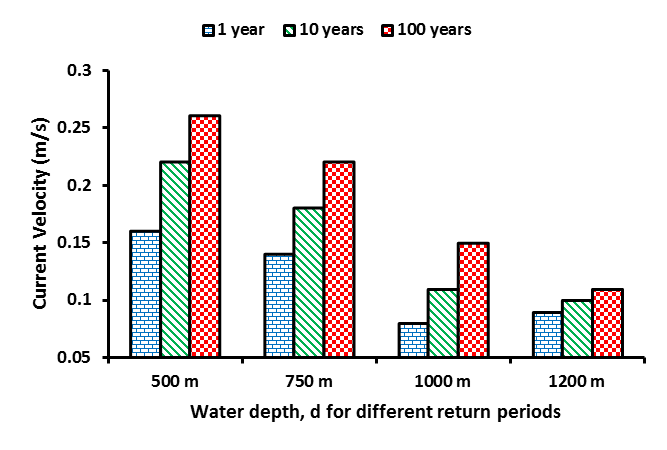 | Figure 3. Sea bottom currents for different water depths and return periods |
From Figure 3 which depicts the current profile, it is observed that the current velocity increases as the return period in years increases. The strongest current experienced in the data available is 0.26 m/s. For a typical design life of 25 years, the wellhead must be able to withstand a minimum 100-year metOcean condition (which has 1% chance of occurring in a year). Expectedly, it was also observed that the current velocity decreased with increasing depth as illustrated in Figure 4. From this Figure 4, irrespective of the flood return period all current velocity profiles will converge at the static sea bed speed - because of zero-slip condition.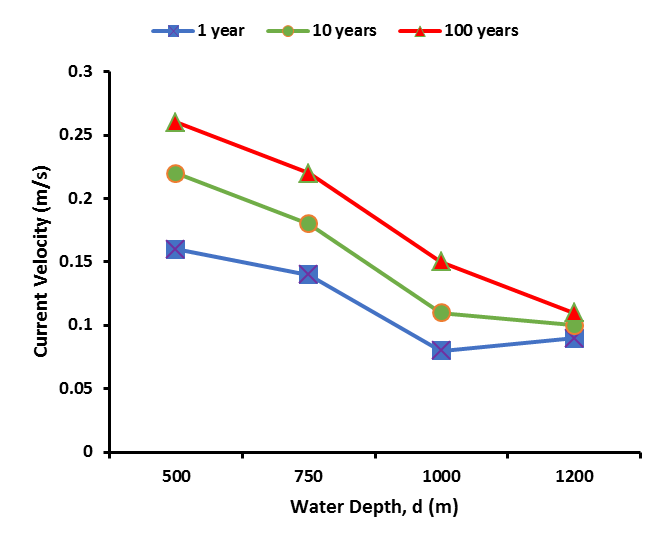 | Figure 4. Variation of current velocity with water depth |
The current velocities for the different returns periods are seen to be converging as depicted in Figure 4. It is a general known fact that current velocity reduces with increasing water depth which is due to some loss of energy by the water body as the depth increases and converges to the seabed velocity. The convergence is also related to the no-slip condition, where the resistance to water flows occurs mostly at the interfaces between the water and the seabed, as such, the current velocity equals that of the seabed velocity.
3.3. Vortex Shedding Frequency for Standard Wellhead System
The vortex shedding frequency for the Standard wellhead system, as represented in Figures 5 and 6, was evaluated at water depths ranging from 500 m to 1,200 m below MSL and at current velocity for return periods ranging from 1 to 100 years.For a Strouhal number 0.2, the highest vortex shedding frequency of 0.076 Hz experienced for the Standard Wellhead system occurred at a water depth of 500 m below MSL and at 100 years return period. It is also seen that the vortex shedding frequency decreases with decreasing depth which results from decreasing current velocity as water depth increases as explained earlier.Considering a 100-year design condition and Strouhal number. of 0.5 for the Standard wellhead system, the highest frequency at which the system will shed vortices will be 0.19 Hz and at a water depth of 500 m below MSL.It can also be observed that the vortex shedding frequency, fv, increased with a higher Strouhal number which corroborates the linear relationship between the vortex shedding frequency and Strouhal number as stated in equation (4b).Evaluating the graphs in Figures 5 and 6, we can observe that the system is more prone to a higher degree of fatigue damage at a water depth of 500 m should the VIV “Lock-in” phenomenon occurs.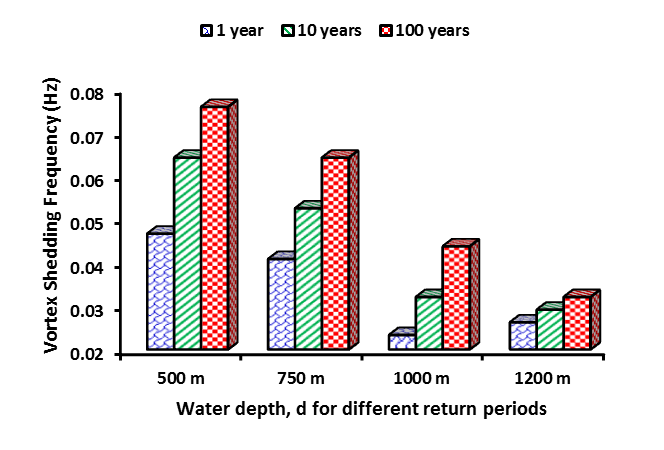 | Figure 5. Vortex Shedding Frequency for SWS at St. = 0.2 |
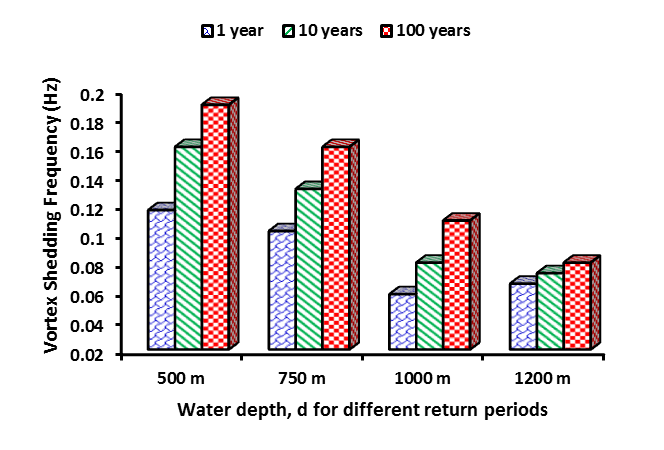 | Figure 6. Vortex Shedding Frequency for SWS at St. = 0.5 |
3.4. Natural Frequency for Standard Wellhead System
The natural frequency for the Standard wellhead system was also evaluated for mode numbers 1 to 5 as represented in Figure 7.The natural frequency at the first mode (fundamental frequency) was found to be 69.3 Hz. It was noted that the natural frequency increased with the consecutive modes of excitation. From Figures 5, 6 and 7, it can observed that it is only the first mode of excitation that makes the system more prone to the VIV “Lock-in” phenomenon. However, the value of the natural frequency at the first mode of excitation is way greater than the maximum frequency at which the Standard wellhead system can shed vortices at both Strouhal numbers 0.2 and 0.5 with respect to water depth ranging from 500 m to 1,200 m and a maximum of 100 years return period. As such the likelihood of the VIV “Lock-in” phenomenon occurring is very slim.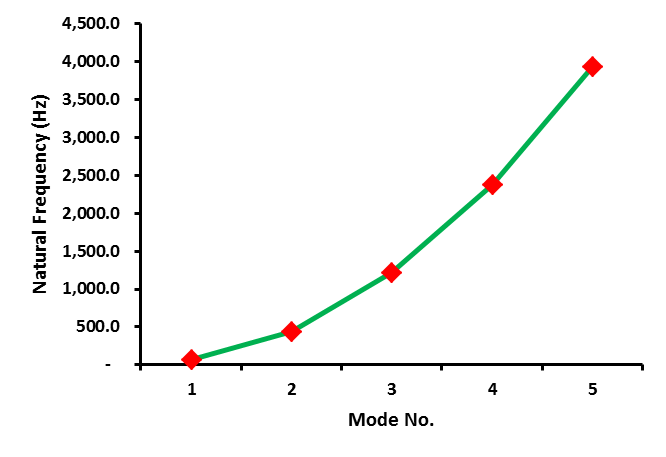 | Figure 7. Natural frequency variation with mode number for SWS |
3.5. Vortex Shedding Frequency for RLSD Wellhead System
In like manner, considering water depths of 500 m to 1,200 m below MSL and current velocity for return periods of 1 to 100 years, the frequency at which vortices are shed by the RLSD wellhead system was also evaluated. The result is represented in Figures 8 and 9.For a Strouhal number 0.2, the highest vortex shedding frequency of 0.06 Hz experienced for the Standard Wellhead system occurred at a water depth of 500 m below MSL and at 100 years return period. It is also seen that the vortex shedding frequency decreases with decreasing depth which results from decreasing current velocity as water depth increases as explained earlier.For the RLSD wellhead system, at a Strouhal number 0.5, the highest vortex shedding frequency experienced by the system is 0.151 Hz for a 100-year design condition and occurs at a water depth of 500 m below MSL.Comparing Figures 8 and 9, it is seen that with increased Strouhal number, the vortex shedding frequency increases likewise, thus validating equation (4b).In addition, the results shown in Figures 8 and 9 shows that the system is more prone to a higher degree of fatigue damage at a water depth of 500 m should the VIV “Lock-in” phenomenon occur. Here, the current velocity is highest based on the data under consideration. It is also important to note that this trend is similar with that for the Standard wellhead system.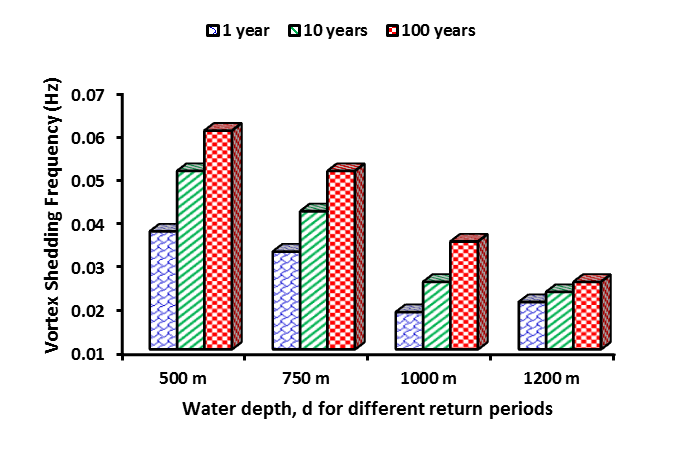 | Figure 8. Vortex Shedding Frequency for RLSD at St. = 0.2 |
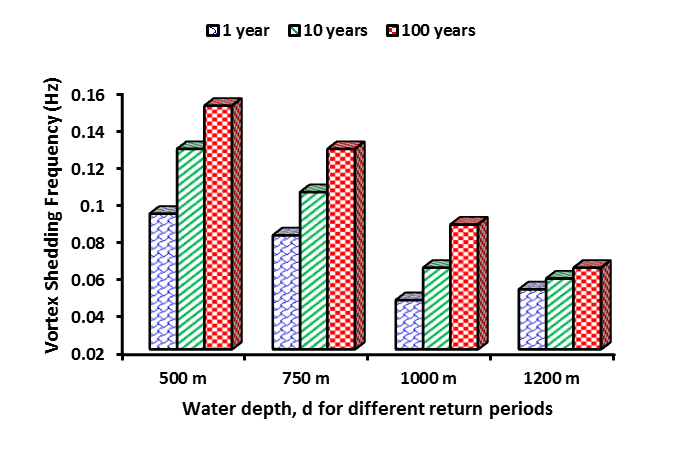 | Figure 9. Vortex Shedding Frequency for RLSD at St. = 0.5 |
3.6. Natural Frequency for RLSD Wellhead System
Similarly, as done for the Standard wellhead system, the natural frequency for the RLSD wellhead system was also evaluated for mode numbers 1 to 5 as represented in Figure 10.From Figure 10, it is seen that the natural frequency increases with the consecutive modes of excitation. The natural frequency at the first mode (fundamental frequency) was found to be 84.6 Hz. Considering the graphs in Figures 8, 9 and 10, we can observe that it is only the first mode of excitation that makes the system more prone to the VIV “Lock-in” phenomenon. However, for Strouhal numbers 0.2 and 0.5, water depth ranges of 500 m to 1,200 m, 100 years flood return period, the value of the natural frequency at the first mode of excitation is far greater than the maximum frequency at which the RLSD wellhead system can shed vortices. As such the likelihood of the VIV “Lock-in” phenomenon occurring is very narrow.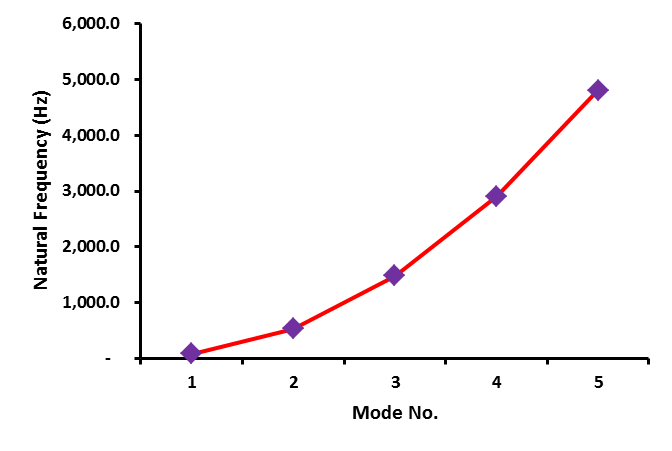 | Figure 10. Natural frequency variation with mode number for RLSD |
3.7. Comparison of Natural Frequency for Standard and RLSD Wellhead System
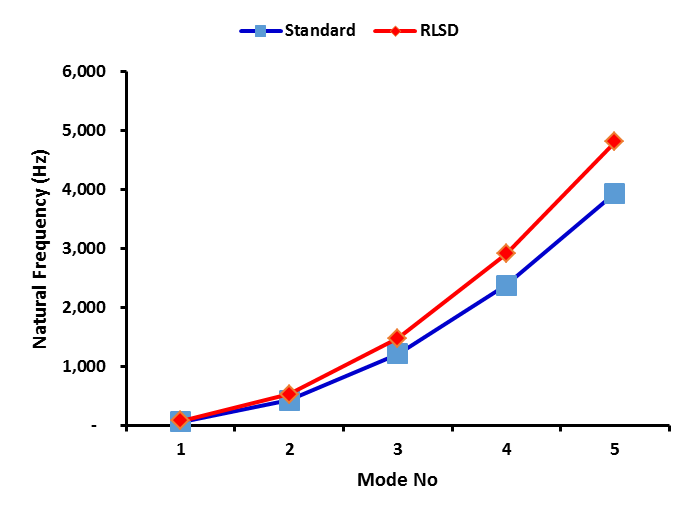
The natural frequency for the Standard and RLSD wellhead system was evaluated for the first five modes of excitation. The variation of the natural frequency for both wellhead systems is represented in Figure 11. 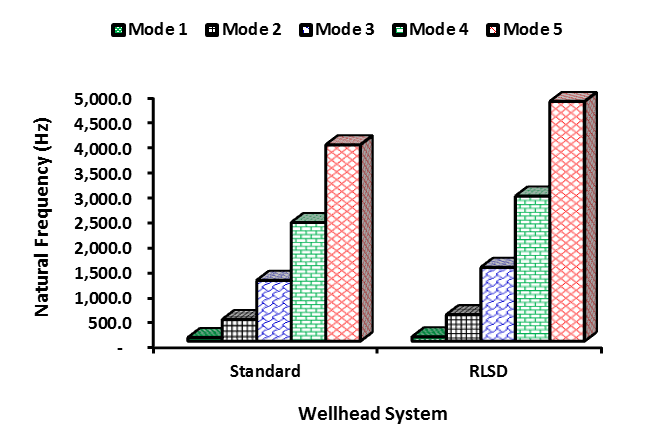 | Figure 11. Comparison of Natural frequency for SWS and RLSD |
The natural frequency of the RLSD system is seen to be higher than that for the Standard wellhead system as shown in Figure 11. This is due to the larger outer diameter of the RLSD system resulting from the addition of the RLSA meant to rigidize the wellhead component.
3.8. Comparison of Vortex Shedding Frequency and Natural Frequency for Standard and RLSD Wellhead Systems
The vortex shedding frequency of the Standard and RLSD wellhead system was compared with their respective natural frequencies and the result shown in Figures 12 and 13. Evaluating the graphs in Figures 12 and 13, we can observe that the vortex shedding frequency for the Standard wellhead system is higher than that for RLSD wellhead system resulting from the larger outer diameter of the RLSD. This is not same for the natural frequency, the RLSD has a higher value than that for the Standard wellhead system. However, it is noted that the gap between the vortex shedding frequency and the natural frequency for the Standard wellhead system is lower than that for the RLSD wellhead system.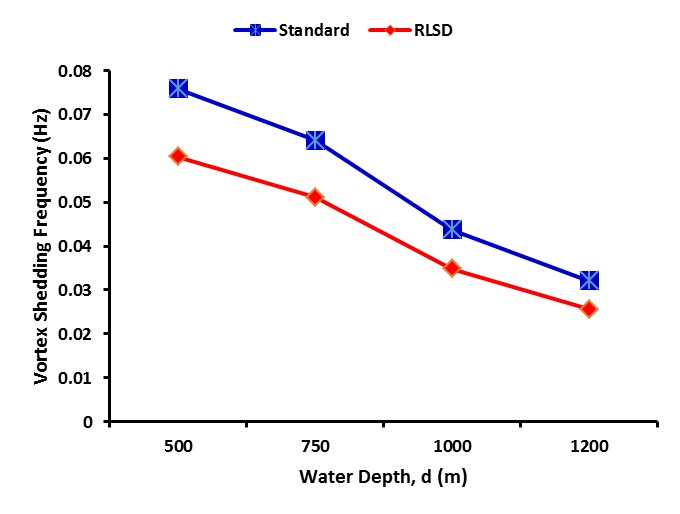 | Figure 12. Vortex Shedding frequency for Standard and RLSD at 100 year return period and St. = 0.2 |
 | Figure 13. Natural frequency for SWS and RLSD |
3.9. Condition for VIV “Lock-in”
The current velocity at which the VIV “Lock-in” phenomenon can occur in the Standard and RLSD wellhead system was also determined. At Strouhal number 0.2, a current velocity of 237.8 m/s and 364.4 m/s is needed to shift the system into the “Lock-in” zone in both Standard and RLSD wellhead system respectively. While at Strouhal number 0.5, a current velocity of 95.2 m/s and 145.7 m/s will be required for the “Lock-in” phenomenon to take place in the Standard and RLSD wellhead system respectively. The calculated current velocities are not practicable as maximum current velocity of 4 m/s have been recorded in places with strong surface current. In the event that “Lock-in” occurs, the welds between the low pressure wellhead housing, high pressure wellhead housing and the casing strings are more prone to fatigue damage.
4. Conclusions
From the results discussed, there is a wide margin between the vortex shedding frequency and the natural frequency for the both wellhead models under consideration. In addition, the current velocity required for the “Lock-in” phenomenon to occur is quite unrealistic. Hence, there is remote possibility of the VIV “Lock-in” phenomenon occurring.For a typical design life of 25 years, 100-year metOcean conditions, and different water depths ranging from 500m to 1200m, the both wellhead systems were found to have no issue of VIV fatigue. Subsequently, there is no need for installing VIV passive control devices.Extending the result further, since the metOcean conditions obtained are same from drilling to abandonment, therefore, throughout the life of field, Standard and RLSD wellhead systems are not affected by VIV fatigue issues in the Gulf of Guinea deepwaters, rather other sources of fatigue like wave-loading may be relevant.The results have closed a gap in well/wellhead integrity in the Gulf of Guinea thus ensuring increased safety of offshore operations.
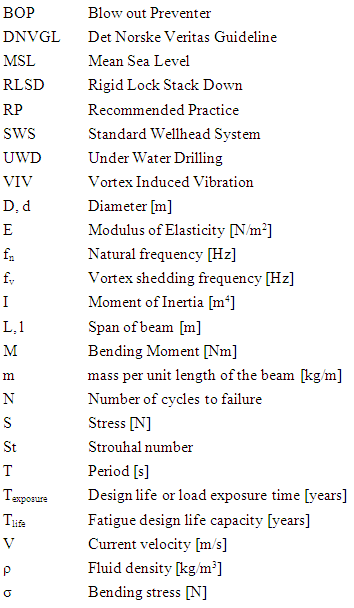
Nomenclature
References
| [1] | Gonzalez, M. and Lucky, M. (2013). Fossil Fuels Dominate Primary Energy Consumption [online] Worldwatch Institute. Available at: http://www.worldwatch.org/fossil-fuels-dominate-primary-energy-consumption-1 [Accessed 27 December, 2016]. |
| [2] | Lamb, R. (2008). How Offshore Drilling Works [online] How SuffWorks. Available at: http://science.howstuffworks.com/environmental/energy/offshore-drilling.htm [Accessed 25 Sept. 2016]. |
| [3] | McNeill, C., Agarwal, P., Kluk, D. and Bhalla, K. (2015). Exploring the Benefits of Wellhead Fatigue Monitoring. In: Offshore Technology Conference. Texas: OTC, pp. 1. |
| [4] | San Pedro, I., Hamilton, M.E. and Bhalla K. (2015). Assessing Uncertainties in Wellhead System Fatigue Life Prediction. In: Offshore Technology Conference. Texas: OTC, pp. 1. |
| [5] | Lim T., Koska R. and Tellier E. (2013). Overcoming Installation Challenges to Wellhead and Conductor Fatigue. In: International Offshore Mechanics and Arctic Engineering Conference. Nantes: OMAE. |
| [6] | Sunday, K., Ward, P., Griffin, C. and Lorenson, P. (2015). Detailed Approach for the Assessment of Accumulated Wellhead Fatigue. In: SPE Offshore Europe Conference and Exhibition. Aberdeen: SPE, pp. 2. |
| [7] | Howells, H., Baker, R. and Rimmer, A. (2015). Measurement of Wellhead Fatigue. In: Offshore Technology Conference. Texas: OTC. |
| [8] | McNeill, C., Agarwal, P., Kluk, D., Bhalla, K. and Young, R. (2014). Subsea Wellhead and Riser Fatigue Monitoring in a Strong Surface and Submerged Current Environment. In: Offshore Technology Conference. Texas: OTC, pp. 2. |
| [9] | ASTM E 1150 (1987). Standard Definitions of Fatigue, 1995 Annual Book of Standards, ASTM, 1995, pp. 753-762. |
| [10] | Petrowiki.org, (2015). Petrowiki [online] Available at: http://www.petrowiki.org/Subsea_wellhead_systems [Accessed 27 December, 2016]. |
| [11] | Cantinelli Sevillano, L., De Andrade, J., Sangesland, S. and Stanko, M. (2016). Thermal Effects on Subsea Wellhead Fatigue During Workover Operations. In: SPE Bergen One Day Seminar. Norway: SPE Bergen. |
| [12] | DTI (2001). An Overview of Offshore Oil and Gas Exploration and Production Activities [online] Available at: www.gov.uk/government/uploads/system/uploads/attachment_data/file/197799/SD_SEA2EandP.pdf [Accessed 17 Sept. 2016]. |
| [13] | Aer.ca (2016). How are Wells Suspended [online] Alberta Energy Regulator. Available at: https://aer.ca/abandonment-and-reclamation/how-are-wells-suspended [Accessed 26 December, 2016]. |
| [14] | Buchmiller, D., Hørte, T., Grytøyr, G. and Haug, L.T. (2012). Establishing an Industry Best Practice on Subsea Wellhead Fatigue Assessment. In: IADC/SPE Drilling Conference and Exhibition. California: IADC/SPE, pp. 2. |
| [15] | Ward, P., Rimmer, A. and Howells, H. (2013). Evaluation of Wellhead Fatigue Using In-Service Structural Monitoring Data. In: Offshore Technology Conference. Texas: OTC, pp. 12-13. |
| [16] | DNVGL-RP-0142 (2015). Det Norske Veritas Recommended Practice, Wellhead Fatigue Analysis. Oslo, Norway. |
| [17] | Blevins R.D. (1979). Formulas for Natural Frequency and Mode Shape. New York: Van Nostrand Reinhold Company, p.108. |
| [18] | Iitg.vlab.co.in (2011). Free Vibration of a Cantilever Beam (Continuous System) [online] Sakshat Virtual Labs. Available at: iitg.vlab.co.in/?sub=62&brch=175&sim=1080&cnt=1 [Accessed 26 December, 2016]. |
| [19] | DNV-RP-C203 (2011). Det Norske Veritas Recommended Practice, Fatigue Design of Offshore Steel Structures. Oslo, Norway. |

 Abstract
 Reference
 Full-Text PDF
 Full-text HTML