Takao Hirai1, Fumiyasu Kuratani2, Tatsuya Yoshida2
1Mechanical Engineering, Graduate School of Engineering, University of Fukui, Fukui, Japan
2Mechanical Engineering, Faculty of Engineering, University of Fukui, Fukui, Japan
Correspondence to: Takao Hirai, Mechanical Engineering, Graduate School of Engineering, University of Fukui, Fukui, Japan.
| Email: |  |
Copyright © 2016 Scientific & Academic Publishing. All Rights Reserved.
This work is licensed under the Creative Commons Attribution International License (CC BY).
http://creativecommons.org/licenses/by/4.0/

Abstract
In this paper, we consider a joined structure in which a long plate is sandwiched between two short plates, and we investigate the effect of the size of an overlapping region, i.e., the short plate length, on damping characteristics. For this, we calculate energy dissipation due to friction at the contact interface, which produces damping, using static contact analysis. In the contact analysis, a surface load is applied at the contact interface and then a distributed forced displacement is applied. For the distributed displacement, mode shape is used to estimate the modal damping ratio for each mode. The results show that the dissipated energy increases with short plate length for all modes, though this increase differs between them. This indicates that the modal damping ratio depends on both the short plate length and the mode. This is explained by changes in the slip displacement and contact force with the short plate length for each mode.
Keywords:
Finite Element Method, Damping, Energy Dissipation, Mode Shape
Cite this paper: Takao Hirai, Fumiyasu Kuratani, Tatsuya Yoshida, Effect of an Overlapping Region on Damping due to Friction in Joined Plate Structures, Journal of Mechanical Engineering and Automation, Vol. 6 No. 5, 2016, pp. 101-109. doi: 10.5923/j.jmea.20160605.02.
1. Introduction
In built-up structures, bolted or riveted joints are the primary source of damping. This damping is caused by energy dissipation due to friction at a contact interface of the joint. Prediction of the energy dissipation due to friction is an important issue and has been the subject of many studies.Endo et al. [1] considered a plate structure in which two identical plates are joined with multiple spot welds or bolts and experimentally examined the effects of the number and positions of the joints on damping. Goodman et al. [2] proposed a formula for determining the amount of dissipated energy when a cantilever beam consisting of two identical beams pressed together was loaded at the free end. Bournine et al. [3] presented an analysis of the damping behavior of two steel beam columns bolted together and derived analytical expressions for energy dissipated due to friction. Almost all of these studies considered a cantilever beam consisting of two identical beams. Metherell et al. [4] investigated the damping behavior of a lap shear joint and derived expressions for energy dissipation. Chen et al. [5] examined the effect of friction on the damping response of interfaces using a finite element (FE) method. Asadi et al. [6], Dovstam et al. [7] and Kishimoto et al. [8] demonstrated a technique for the simulation of friction damping using a linear FE model. These studies considered joined plate structures with a partial overlapping region but focused on only the fundamental bending mode. Abbadi et al. [9] presented a nonlinear model of two substructures connected by a single welding spot. In that study, the time history of dissipated energy and velocity response were calculated using nonlinear transient analysis, i.e., dynamic contact analysis, and then, modal damping ratios for higher modes were identified from the simulation data. However, the effect of mode shape on damping characteristics was not mentioned. In addition, note that when plates are joined with multiple spot welds, it is difficult to carry out dynamic contact analysis because complex contact situations between metal surfaces in the joint often cause severe convergence difficulties. Singh et al. [10] and Mohanty et al. [11] investigated relations between the damping capacity of a joined cantilever beam and parameters such as cantilever length, thickness and excitation amplitude. However, these studies did not describe in detail these effects.In Kuratani et al. [12] and Hirai et al. [13], we presented a procedure for calculating energy dissipated due to friction at a contact interface in a joined structure with a partial overlapping region. To reduce computational effort and difficulty in contact analysis, we used static contact analysis instead of dynamic contact analysis. By using the proposed procedure, we calculated the dissipated energy and estimated modal damping ratios for some modes. The results showed that the proposed method enables us to accurately estimate the modal damping ratios when a surface load was appropriately set. However, we did not discuss in detail the effects of the overlapping region and surface load on damping characteristics.In this paper, we consider a structure in which a long plate is sandwiched between two short plates, essentially a joined structure with a partial overlapping region. The effect of the size of the overlapping region, i.e., the short plate length, on damping characteristics is investigated. For this, we calculate energy dissipated due to friction at the contact interface, which produces damping, using static contact analysis. In the contact analysis, a surface load is applied at the interface and then a distributed forced displacement is applied. For the distributed displacement, mode shape is used to estimate the modal damping ratio for each mode. To reproduce the measured modal damping ratio, we determine for each mode the surface load and its distribution pattern. Then, we discuss for each mode the effect of short plate length on the dissipated energy and damping.
2. Measuring the Damping Ratio
2.1. Test Structure
Figure 1 shows the plate structure considered in this paper, which is a long steel plate sandwiched between two short steel plates. The three plates were joined together using 4xM5 bolts and nuts with a tightening torque of 3 Nm. The long plate was 480 mm long, 80 mm wide and 3 mm thick. The two short plates had three different lengths, 60, 80 and 100 mm, and all were 80 mm wide and 2 mm thick. This enabled us to compare the effect of the short plate length (SPL) on damping characteristics. Two sets of test structures were prepared for each short plate length. | Figure 1. Test structure |
2.2. Experimental Modal Damping Ratio
In this paper, we consider the damping behavior of the structure in bending. To measure the modal damping ratios of the test structure, an impact test was carried out. Figure 2 shows the modal test setup. The test structure was suspended using strings at the nodal lines of the mode shape of the 1st bending mode to realize a free-free boundary condition. In order not to excite torsional modes, the impact point and the locations of two accelerometers were set at the middle of the edge. Excitation force and response accelerations were measured, and frequency response functions (FRFs) for the two measurement points were calculated. From the two measured FRFs, natural frequencies and modal damping ratios were extracted using a single degree of freedom curve-fitting algorithm. | Figure 2. Modal test setup |
Figure 3 shows the mean and the standard deviation of the modal damping ratios measured during the modal testing. For the 100 mm SPL, the damping ratios of the first three bending modes are shown. This is because the FE model was validated for the 1st to 3rd modes as discussed in section 4.1. For all SPLs, the damping ratios have the same tendency, with the 1st and 3rd modes having larger ratios than the 2nd and 4th modes. In addition, for all modes, the longer the SPL is, the larger the damping ratio becomes. However, the change with the SPL is different for each mode: for the 1st mode, the increase in the damping ratio between 80 and 100 mm is almost the same as that between 60 and 80 mm; for the 2nd mode, the increase between 80 and 100 mm is much larger than that between 60 and 80 mm; and for the 3rd mode, the increase between 80 and 100 mm is smaller than that between 60 and 80 mm. | Figure 3. Modal damping ratios measured in the modal testing |
In Figure 3, “Long plate” denotes the damping ratios for the long plate without the short plates. These damping ratios are considered as material damping of the steel plate. In this paper, we focus on energy dissipated due to friction and ignore other damping sources such as material damping. For this, we obtain friction damping ratios by subtracting the material damping ratios from the damping ratios in Figure 3.
3. Calculation Procedure for Dissipated Energy
In this section, we briefly explain a procedure for calculating dissipated energy due to friction [13].
3.1. Flow Chart of Calculation Procedure for Dissipated Energy
Figure 4 shows the flow chart of a calculation procedure for dissipated energy. First, a linear FE model is built and its mode shapes are obtained through vibration analysis. Then, the linear FE model is modified into a nonlinear FE model by defining contact elements on an overlapping region between the long plate and the two short plates. The static contact analysis is carried out using the modified FE model and the contact results, such as the contact pressure, contact area and slip displacement, are obtained. Finally, the dissipated energy is calculated from the contact results and the modal damping ratios are estimated. | Figure 4. Flow chart of calculation procedure for dissipated energy |
In the contact analysis, a scaled mode shape is used as a distributed forced displacement and the distributed displacement is applied to only the long plate. This enables us to calculate the dissipated energy for each mode. Furthermore, a surface load is applied at the contact interface. This load is necessary in static contact analysis to compensate for the bolt clamping pressure and inertia of the plates.
3.2. Energy Dissipated Due to Friction
The energy dissipated due to friction  is obtained by
 | (1) |
where  is the friction coefficient,
  is the contact force at the interface and
  is the relative slip displacement between two plates.
  is calculated as the product of contact pressure and contact area. When the plates deflect, contact force and slip displacement vary with the deflection. In the contact analysis, the distributed displacement, i.e., the scaled mode shape, is applied from zero to maximum deflection step by step. This provides contact results at each deflection step. The dissipated energy at each deflection step is obtained by
 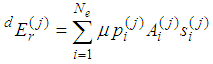 | (2) |
where  is the dissipated energy at the jth step for the rth mode, and
  and
and  are the contact pressure, contact area and slip displacement for the ith element.
  is the number of contact elements. Total dissipated energy
  is obtained by doubling
  during a half cycle.
  is the sum of the dissipated energy
  at each step.
  is the number of divisions of deflection per half cycle.
3.3. Modal Damping Ratio
The modal damping ratio  is calculated from dissipated energy and vibration energy by [14]
  | (3) |
where  is the vibration energy, given by
 | (4) |
where  is the modal kinetic energy obtained by the vibration analysis and is defined by
 | (5) |
where  is the mass matrix of a FE model,
  is the natural angular frequency and
  is the mode shape.
  is a scaling factor defined as the ratio of the distributed displacement component at the node of the FE model corresponding to the excitation point in the modal testing and mode shape component at the excitation point.
4. Vibration Analysis and Static Contact Analysis
In this section, we explain the vibration analysis and the static contact analysis. The vibration analysis and the static contact analysis were carried out using the FE program ANSYS.
4.1. Vibration Analysis
Figure 5 shows the linear FE model of the 80 mm SPL for the vibration analysis. The three steel plates were modeled with solid-shell elements (Solsh 190), the bolt heads and nuts were modeled with solid elements (Solid 185), and the bolt shafts were modeled with beam elements (Beam 188, 5 mm diameter). The material properties of the plates, bolts and nuts were as follow: Young’s modulus E=206 GPa, Poisson’s ratio  and mass density
  The mass density of the bolt shafts was set to zero because the FE model had no bolt holes. A free-free boundary condition was applied to allow for a comparison with the experimental results.
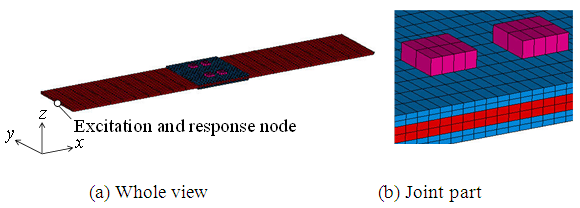 | Figure 5. Linear FE model for vibration analysis |
Figure 6 shows the first four bending mode shapes for the 80 mm SPL. The mode shapes of the 1st and 3rd modes are symmetric about the y–z symmetry plane, whereas those of the 2nd and 4th modes are antisymmetric. Figure 7 shows an enlarged view of the joint part for the 3rd and 2nd mode shapes. For the 3rd mode, the deflection of the long plate is large, whereas that of the short plate is small, and the 1st mode shows similar behavior. In contrast, for the 2nd mode, the long and the short plates do not move away from each other and rotate together, and the 4th mode shows similar behavior.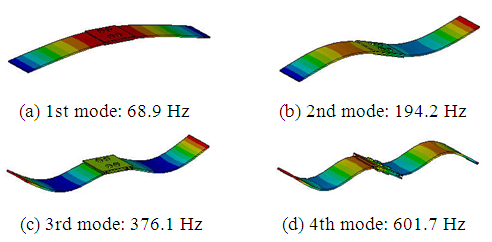 | Figure 6. First four bending mode shapes for the 80 mm SPL |
 | Figure 7. Enlarged view of joint part |
Next, we examine the validity of the linear FE model. Figure 8 shows a comparison of the driving point FRFs predicted from the linear FE model and measured during the modal testing. For the 60 mm SPL, the predicted FRF is in good agreement with the measured FRF below 1500 Hz, and the 1st to 6th modes are included in this frequency range. For the 80 mm, the predicted FRF is in good agreement with the measured FRF below 800 Hz, and the 1st to 4th modes are included in this frequency range. For the 100 mm, the predicted FRF is in good agreement with the measured FRF below 500 Hz, and the 1st to 3rd modes are included in this frequency range. From the comparison results, we can conclude that for the 60 mm SPL, the mode shapes of the 1st to 6th modes can be validly used to calculate dissipated energy using the mode shape. Similarly, the 1st to 4th modes for the 80 mm and the 1st to 3rd modes for the 100 mm are valid. | Figure 8. Comparison of the FE predicted and measured FRFs |
4.2. Static Contact Analysis
To perform a static contact analysis, the linear FE model needs to be modified into a nonlinear FE model. The contact elements (Conta 173 and Targe 170 with Coulomb friction law) were defined within the overlapping region between the long and short plates, as shown in Figure 9. To prevent rigid body motion, the x–z symmetry plane was fixed in the y direction, and the intersection of the y–z symmetry plane and the middle plane of the long plate was fixed in the x direction.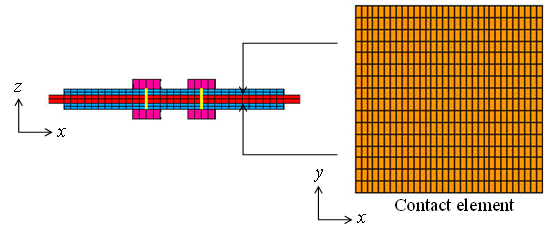 | Figure 9. Nonlinear FE model for contact analysis |
In the contact analysis, surface loads were applied to the lower surface of the upper short plate and the upper surface of the lower short plate. Then, a distributed forced displacement, i.e., the z direction components of the scaled mode shape, was applied to the long plate. As the algorithm of contact analysis, the augmented Lagrangian method with automatic contact stiffness adjustment was used to improve convergence. The friction coefficient of the contact elements was set to 0.25, as measured by Hirai et al. [13], and penetration tolerance was set to 1 µm. The distributed forced displacement was increased from zero to maximum deflection in 100 steps (a quarter cycle of vibration) and then decreased from maximum to zero deflection in 100 steps (a half cycle of vibration). A constant surface load was continuously applied during all the steps. For the analysis results, the contact pressure, contact area and slip displacement were obtained for the total 200 steps during a half cycle.
5. Effect of Surface Load on Dissipated Energy and Damping
To obtain the same dissipated energy, i.e., modal damping ratio, as measured during modal testing using static contact analysis, a surface load is necessary to compensate for the bolt clamping pressure and inertia of the plates. In this section, we determine the necessary surface load and its distribution pattern for each mode.
5.1. Necessary Value of the Surface Load
We examine how a surface load affects energy dissipated due to friction and determine the necessary surface load from the relation between the damping ratio and the surface load. For this, the dissipated energies were calculated and the modal damping ratios were estimated as the surface load was varied from 0 to 1 MPa. A distribution pattern of the surface load was uniform at the interface shown in Figure 9.Figure 10 shows the relations for the 1st to 4th modes for the 80 mm SPL. In each figure, the red dashed line denotes the friction damping ratio obtained from the measured damping ratios shown in Figure 3. From the solid lines, we can see that the estimated damping ratios increase with the surface load for all modes. The intersection of the solid and the dashed lines indicates the necessary surface load for each mode. Table 1 summarizes the necessary surface loads for the three SPLs. In the table, the first six modes for the 60 mm, the first four modes for the 80 mm and the first three modes for the 100 mm are shown as mentioned in section 4.1. The necessary surface load increases with the mode number for all SPLs. In contrast, the modal damping ratio does not increase with the mode number as seen from the dashed lines. This means that the surface load necessary to accurately reproduce the measured damping ratio is different for each mode.Table 1. Necessary Surface Load
 |
| |
|
 | Figure 10. Relation between damping ratio and surface load for the 80 mm SPL |
Since the necessary surface load increased with the mode number, we examine the relation between the necessary surface load and the square of natural angular frequency. The results for the three SPLs are shown in Figure 11. The vertical axis denotes the surface load and the horizontal axis denotes the square of angular frequency on the logarithmic axis. In each figure, the solid line indicates the linear approximation of the surface load with respect to the square of natural angular frequency. The necessary surface load increases approximately in proportion to the square of angular frequency for all SPLs. However, the necessary values for the 1st, 3rd and 5th modes (symmetric modes) seem to be larger than the approximations, whereas those for the 2nd, 4th and 6th modes (antisymmetric modes) appear smaller than the approximations. | Figure 11. Relation between surface load and angular frequency |
5.2. Suitable Distribution Pattern of the Surface Load
In the previous section, we applied a uniformly patterned surface load at the interface to calculate the dissipated energy. In this section, we apply other distribution patterns and examine their effects.One distribution pattern we considered was a trapezoidal distribution in the x direction as shown in Figure 12. In the figure, P1 and P2 are the values of the surface load at the center and the edge of the short plate. The distribution patterns considered are shown in Table 2.  is the mean value of the trapezoidal distribution. As mentioned in a previous paper [15], the effect of the distribution pattern of the surface load on damping characteristics is different for symmetric and antisymmetric modes. Thus, we examined 25 combinations of distribution patterns: five patterns for the symmetric mode and five patterns for the antisymmetric mode. For convenience, the combination of a distribution pattern
  for the symmetric mode and pattern
  for the antisymmetric mode is referred to as pattern
 | Figure 12. Distribution of surface load |
Table 2. Distribution Pattern of Surface Load
 |
| |
|
The necessary surface load and its approximation were calculated for each mode by implementing the same procedure as in section 5.1. To determine a suitable combination of distribution patterns, the following error sum of squares is used | (6) |
where  is the error sum of squares for the combination of distribution pattern
 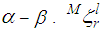 is the modal damping ratio measured for an l mm SPL and the
  mode.
mode.  is the damping ratio estimated using a surface load obtained from the approximation. Nl is the number of modes considered for an l mm SPL. Figure 13 shows the error sum of squares for the 25 combination patterns. In this figure, the value of each pattern is normalized by that of pattern C-C. The 13 combinations exceed “2” and the pattern B-C is the smallest of all combination patterns, reducing the error sum of squares by 70% compared with pattern C-C.
 | Figure 13. Error sum of squares between the measured and estimated modal damping ratios |
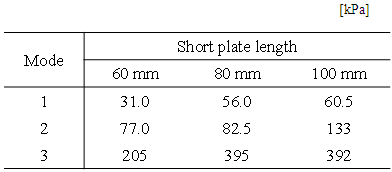
Table 3 shows the necessary values of the surface load for pattern B-C in the first three modes. Comparing Tables 1 and 3, we find that for the 1st and 3rd modes, the necessary surface loads of pattern B-C are low compared with pattern C-C, whereas for the 2nd mode, they remain the same. This is because the distribution pattern changes from C to B in the symmetric mode.Table 3. Necessary Surface Load for Pattern B-C
 |
| |
|
6. Effect of Short Plate Length on Dissipated Energy and Damping
In this section, we discuss how the SPL affects dissipated energy, i.e. damping ratio based on contact analysis results when pattern B-C is applied as the surface load distribution. The first three modes are considered because only those modes were discussed for the 100 mm SPL.
6.1. Change in Dissipated Energy with the Short Plate Length
Total slip displacement is calculated as the sum of slip displacement for each contact element at each deflection step. Similarly, contact force is calculated as the sum of the product of contact pressure and contact area.Figure 14 shows the total slip displacement and the total contact force during a half cycle of vibration. The slip displacement and the contact force increase with SPL for all the modes. Consequently, the dissipated energy increases with SPL for all the modes because it is obtained as the product of the slip displacement and the contact force. Therefore, larger damping ratios were measured for the 100 mm SPL as shown in Figure 3.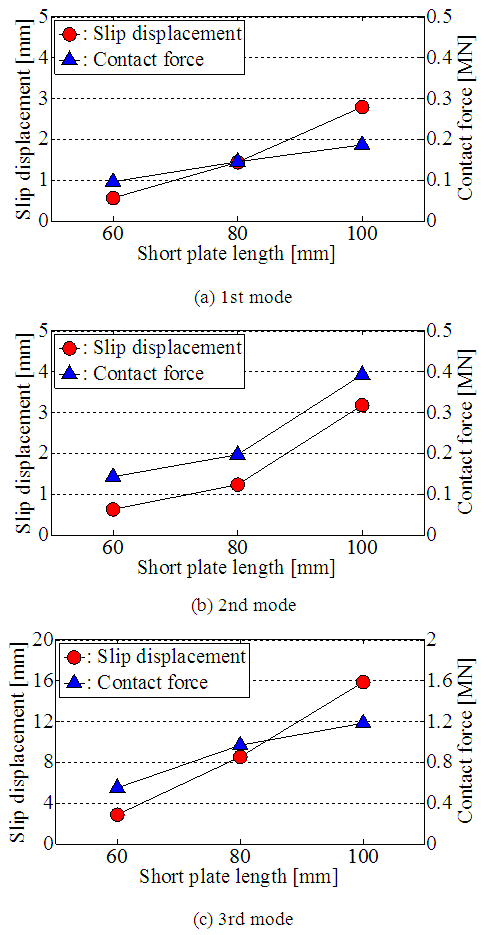 | Figure 14. Total slip displacement and total contact force during a half cycle of vibration |
Furthermore, for the 1st mode, the increase in the slip displacement between 80 and 100 mm is almost the same as that between 60 and 80 mm. The increase in the contact force shows the same tendency as in the slip displacement. As a result, an increase in dissipated energy between 80 and 100 mm is almost the same as that between 60 and 80 mm. For the 2nd mode, the increase in the slip displacement between 80 and 100 mm is larger than that between 60 and 80 mm. The increase in the contact force shows the same tendency as does slip displacement. As a result, an increase in the dissipated energy between 80 and 100 mm is much larger than that between 60 and 80 mm. For the 3rd mode, the increase in the slip displacement between 80 and 100 mm is almost the same as that between 60 and 80 mm. However, the increase in the contact force between 80 and 100 mm is smaller than that between 60 and 80 mm. As a result, an increase in the dissipated energy between 80 and 100 mm is smaller than that between 60 and 80 mm.These results show that the changes in slip displacement and contact force with the SPL depend on the mode. Consequently, a change in the dissipated energy, i.e., damping ratio, is different for each mode. This is consistent with the measured results in Figure 3.
6.2. Difference in Change in Dissipated Energy for the Modes
We explain why the change in the dissipated energy is different for each mode based on contact zone distribution within the overlapping region between the long and the lower short plates. The contact zone distribution was obtained when the long plate convexly deflected in its mode shape as shown in Figure 15. Figure 16 shows the contact zone distributions for the first three modes. Red indicates the contact zones and yellow indicates the non-contact zones. | Figure 15. Deformation of the overlapping region when the long plate deflects in its 3rd mode for the 80 mm SPL |
 | Figure 16. Contact zone distribution within the overlapping region  |
For the 1st and 3rd modes, the contact zone distribution is symmetric about the centerline for all SPLs, i.e., the long and the lower short plates are in contact at the middle and along both edges of the short plate. In addition, the large slip zones within the contact zones are mainly located at both edges of the short plate for all SPLs. This can be seen from the mode shapes: for the 1st and 3rd modes, the long plate and the short plate have different radii of curvature, with the radius of curvature of the long plate being smaller than that of the short plate. In this case, large slip occurs at the edges. In contrast, for the 2nd mode, the contact zone distribution is antisymmetric. In addition, a slip zone within the contact zone is not limited at the edges. For example, there is a large contact zone between the middle and the edge on the right-hand side, which is regarded as a slip zone. This is because for a mode shape of the 2nd mode, the long and the short plates do not move away from each other and rotate together. In this case, slip displacement seems to increase gradually from the middle to the edge of the short plate.
6.2.1. Difference in Change in Slip Displacement for the Modes
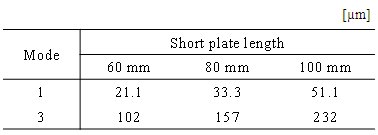
We explain why the change in the slip displacement shown in Figure 14 is different for each mode.For the 2nd mode, as mentioned before, there is a large slip zone between the middle and the edge, and its area probably varies with contact area. In addition, as can be seen from Figure 16(b), the contact area rapidly increases between 80 and 100 mm compared to between 60 and 80 mm. Therefore, an increase in the slip displacement between 80 and 100 mm is larger than that between 60 and 80 mm. For the 1st and 3rd modes, an increase in the slip displacement between 80 and 100 mm is almost the same as that between 60 and 80 mm. To explain this, we examine the deflection of the long plate at the edge of the short plate. As shown in Figure 15, the deflection of the long plate at the edge of the short plate can be calculated by subtracting a displacement in the vertical direction at the edge of the short plate from that at the center. The results are shown in Table 4. For both modes, the increase rate of the deflection between 80 and 100 mm is 50%, which is almost the same as that between 60 and 80 mm. Consequently, the increase in slip displacement is almost the same between 80 and 100 mm and between 60 and 80 mm. This can be seen from that as stated in [3], a relative slip displacement between two beams is almost proportional to deflection at the tip when a cantilever beam consisting of the two identical beams is loaded at the tip. Table 4. Deflection of the Long Plate at the Edge of the Short Plate
 |
| |
|
6.2.2. Difference in Change in Contact Force for the Modes
We explain why the change in the contact force shown in Figure 14 is different for each mode based on necessary surface load and contact area. This is because the contact force is calculated as the product of contact pressure and contact area.Table 5 shows the total area of the contact zone in Figure 16. For the 1st and 3rd modes, the contact area increases with SPL. In contrast, for the 2nd mode, the contact areas are almost the same for the 60 and 80 mm, whereas it rapidly increases from 80 to 100 mm. As shown in Table 3, the necessary surface load for the 1st and 2nd modes increases with SPL. In contrast, the necessary surface loads for the 3rd mode are the same for the 80 and 100 mm, whereas it rapidly increases from 60 to 80 mm.Table 5. Total Area of the Contact Zone
 |
| |
|
Consequently, for the 1st mode, the increase in the contact area between 80 and 100 mm is larger than that between 60 and 80 mm. The increase in the necessary surface load between 80 and 100 mm is smaller than that between 60 and 80 mm. As a result, an increase in the contact force between 80 and 100 mm is almost the same as that between 60 and 80 mm. For the 2nd mode, the increases in both the contact area and the necessary surface load between 80 and 100 mm are larger than those between 60 and 80 mm. As a result, an increase in the contact force between 80 and 100 mm is larger than that between 60 and 80 mm. For the 3rd mode, the increase in the contact area between 80 and 100 mm is larger than that between 60 and 80 mm. The increase in the necessary surface load between 80 and 100 mm is much smaller than that between 60 and 80 mm. As a result, an increase in the contact force between 80 and 100 mm is smaller than that between 60 and 80 mm.From the above discussion of the slip displacement and the contact force, we can understand why the effect of SPL on the dissipated energy is different for each mode.
7. Conclusions
In this paper, we considered a joined structure in which a long plate is sandwiched between two short plates. The effect of the size of the overlapping region, i.e., the short plate length, on damping characteristics was investigated. For this, we calculated energy dissipated due to friction at the contact interface, which produces damping, through static contact analysis. In the contact analysis, surface load was applied at the contact interface and then the distributed forced displacement was applied. For the distributed displacement, mode shape was used and this enabled us to estimate the modal damping ratio for each mode. To reproduce the measured modal damping ratio, we determined the surface load and its distribution pattern. Then, we discussed the effect of short plate length on the dissipated energy and damping for each mode. The results showed that the dissipated energy increased with short plate length for all modes, though the change was different for each mode. This indicates the modal damping ratio depends on both the short plate length and the mode. The reason for the difference in the change in dissipated energy for each mode was explained by the different changes in slip displacement and contact force with the short plate length for the symmetric and the antisymmetric modes.
References
| [1] | H. Endo, T. Ueno and E. Marui, “Effect of spot welding and bolted joint on damping capacity or static rigidity of plate structures”, Journal of Japan Society for Design Engineering, Vol.41 No.6 (2006), pp.295-300. |
| [2] | L.E. Goodman and J.H. Klumpp, “Analysis of slip damping with reference to turbine-blade vibration”, Transactions of the ASME Journal of Applied Mechanics, Vol.23 (1956), pp.421-429. |
| [3] | H. Bournine, D.J. Wagg and S.A. Neild, “Vibration damping in bolted friction beam-columns”, Journal of Sound and Vibration, Vol.330 (2011), pp.1665-1679. |
| [4] | A.F. Metherell and S.V. Diller, “Instantaneous energy dissipation rate in a lap joint – Uniform clamping pressure”, ASME Journal of Applied Mechanics, Vol.35 (1968), pp.123-128. |
| [5] | W. Chen and X. Deng, “Structural damping caused by micro-slip along frictional interfaces”, International Journal of Mechanical Sciences, Vol.47 (2005), pp.1191-1211. |
| [6] | K. Asadi, H. Ahmadian and H. Jalali, “Micro/macro-slip damping in beams with frictional contact interface”, Journal of Sound and Vibration, Vol.331 (2012), pp.4704-4712. |
| [7] | K. Dovstam, P. Goransson and O. Gartmeier, “On linear modeling of interface damping in vibration structures”, Journal of Sound and Vibration, Vol.331 (2012), pp.4299-4312. |
| [8] | Y. Kishimoto and M. Endo, “Development of an estimation method of dynamic characteristics of structures with bolted joints”, Journal of the Japan Society of Mechanical Engineers, Series C, Vol.73 No.729 (2007), pp.1566-1573. |
| [9] | Z. Abbadi, D. Aubby, S. Germes, L. Jezequel and F.V. Herpe, “An Improved model for dissipation in welding spot joints”, Proceedings of ISMA 2004 (2004), pp.1207-1220. |
| [10] | B. Singh and B.K. Nanda, “Estimation of damping in layered welded structures with unequal thickness”, Journal of Shock and Vibration, Vol.19 (2012), pp.1463-1475. |
| [11] | R.C. Mohanty, R.K. Mohanty and B.K. Nanda, “Study on improvement of damping in jointed cantilever beams using FEM”, International Journal of Innovative Research in Science, Engineering and Technology, Vol.3 Issue 6 (2014), pp.13030-13037. |
| [12] | F. Kuratani, T. Hirai, K Koide and I. Kido, “Damping in joined friction plates with partially overlapping interfaces”, Proceedings of 11th International Conference on Recent Advances in Structural Dynamics (2013), Paper No.1019. |
| [13] | T. Hirai, F. Kuratani, K. Koide and I. Kido, “Damping estimation of joined plate structures using static contact analysis”, Proceedings of the 12th International Conference on Motion and Vibration (2014), Paper No.2A12. |
| [14] | The Japan Society of Mechanical Engineers ed., The damping technology for vibration, (1998), p.63, Yokendo. |
| [15] | T. Hirai and F. Kuratani, “Estimating damping characteristics for bending mode of joined plates”, Proceedings of JSAE Annual Congress (Spring) (2015), Paper No.S308. |

 Abstract
 Reference
 Full-Text PDF
 Full-text HTML