Agus Santoso, Daiki Goto, Tomoaki Takehira, Akimaro Kawahara, Michio Sadatomi
Graduate School of Science and Technology, Kumamoto University, Japan
Correspondence to: Agus Santoso, Graduate School of Science and Technology, Kumamoto University, Japan.
| Email: |  |
Copyright © 2016 Scientific & Academic Publishing. All Rights Reserved.
This work is licensed under the Creative Commons Attribution International License (CC BY).
http://creativecommons.org/licenses/by/4.0/

Abstract
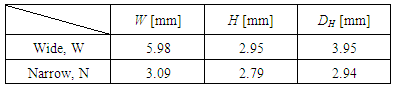
Experimental investigations were conducted for gas–liquid two-phase flow through sudden contraction in horizontal rectangular minichannel. The cross-sectional dimensions of the channel with the height (H), the width (W) and the hydraulic diameter (DH) for the narrow channel are 2.79 mm, 3.09 mm and 2.94 mm, while those for the wide channel are 2.95 mm, 5.98 mm and 3.95 mm. In order to know the effects of liquid properties, water and viscoelastic liquid, namely 0.1 wt % polyacrylamide (PAM) aqueous solution are selected as the working liquid, while air as the working gas. The local pressures upstream and downstream from the contraction were measured with calibrated pressure sensors, and the pressure distribution map was drawn to determine the frictional pressure drop in the test channel and pressure drop at the contraction for single-phase liquid flows. The flow pattern, the bubble velocity, the bubble length, and the void fraction were measured with a high-speed video camera. The flow pattern map is developed from the observed flow pattern i.e. bubble flow, slug flow and annular flow in the wide channel, while slug flow and annular flow in the narrow channel. The bubble length data were compared with the calculation by the scaling law proposed by Garstecki et al. Results of such experiment and analysis are reported in the present paper.
Keywords:
Rectangular minichannel, Two-phase flow, Sudden contraction
Cite this paper: Agus Santoso, Daiki Goto, Tomoaki Takehira, Akimaro Kawahara, Michio Sadatomi, Two-Phase Flow Characteristics across Sudden Contraction in Horizontal Rectangular Minichannel, Journal of Mechanical Engineering and Automation, Vol. 6 No. 3, 2016, pp. 58-64. doi: 10.5923/j.jmea.20160603.03.
1. Background
The flow channel normally involves several geometrical singularities such as abrupt area changes (sudden expansion, sudden contraction, valve, orifice, etc.). The flow of two-phase mixtures across sudden expansions and contractions is commonly seen in piping connections as well as relevant to many applications such as chemical reactors, power generation units, oil wells and petrochemical plants (Wang et al., 2010). In particular, the small and narrow channels are widely adopted in compact heat exchangers (Chen et al., 2009). One of the simplest arrangements for the heat removal is using the liquid flow and convection heat transfer with or without phase change in small rectangular channels (Chen et al., 2007). Recently, such a flow through singularity in micro and minichannels of 100 μm to 10 mm becomes popular because compact heat exchangers with phase change, such as cooling devices of electronic equipment and refrigerators, are miniaturized (Sadatomi et al, 2013). Therefore, the understanding of the characteristics on two phase flow through the singularities in minichannel is essential for designing such small scale devices. A number of researches have been reported on two-phase flows in smallchannel with singularities.Kawahara et al. (2015) conducted experimental investigations on gas-liquid two phase flows through a sudden contraction in rectangular microchannels. Two rectangular microchannels with different contraction ratio were used. The widths of the wide channels upstream of the contraction were 0.53 or 0.78 mm (0.230 mm in height), while those of the narrow ones downstream were fixed at 0.270 mm (0.230 mm in height). Distilled water, ethanol 49 wt% aqueous solution, pure ethanol and hydrofluoroether (HFE)-7200 were used as the test liquids, and nitrogen as the test gas. Sadatomi et al. (2013) investigated flow regime, pressure drop, bubble velocity and void fraction for air-water two phase flow through U-bend, sudden expansion and sudden contraction in rectangular minichannel. Kusumaningsih et al. (2013) conducted experimental investigations on nitrogen gas-liquid (distilled water, ethanol 49 wt % aqueous solution, pure ethanol and HFE 7200) two-phase flows in two kinds of rectangular microchannels with the widths of in the wide channels upstream of the contraction 0.53 or 0.78 mm (0.240 mm in height), while 0.240 mm (0.240 mm in height) in the smaller ones.Abdelall et al. (2005) performed an experimental study of pressure drop cause by abrupt flow area changes in small circular channels. The larger and smaller tube diameters were 1.6 and 0.84 mm, respectively. Deionized water and air were used as two-phase working fluids. Chen et al. (2008) conducted experimental investigation of the two-phase flow characteristics across sudden contraction using air and water. The contraction test section was from small rectangular channels (3x6 mm and 3x9 mm in short and long sides) into a small tube (3 mm in diameter). Padilla et al. (2013) conducted experimental studies on two-phase flow of HFO-1234yf, R-134 and R-410A refrigerants in sudden contractions. This study presents qualitative two-phase flow visualizations of R-134a in a 10 mm glass tube with a cross-section area ratio (σA) of 0.49. Flow patterns across the sudden contraction are simultaneously observed by top and side views with a high speed high resolution camera. The perturbation lengths up- and down-streams of the sudden contraction are experimentally investigated and their contribution to the pressure drop is identified. The experimental pressure drop data are compared against six prediction methods from the literature. In this connection, the aim of this study is to investigate experimentally the effects of liquid physical properties on the two-phase flows characteristics, such as the bubble velocity, the bubble length, the void fraction and the pressure drop. Adiabatic experiments were conducted to obtain such data for gas-liquid two phase flows in horizontal rectangular minichannel with the contraction ratio of σA = 0.49. In order to study the effects of both surface tension and viscosity, water and aqueous solution of 0.1 wt% were used as the working liquid, while air as the working gas. The present results obtained from air-water and air-PAM system will be compared with those from the other results by previous researchers.
2. Experimental Methods
Figure 1 shows a schematic diagram of the test channel with a sudden contraction placed on a horizontal plane. The test channel is rectangular in cross-section and is made of transparent acrylic resin for visual observation. Table 1 shows the cross-sectional dimensions of the test channel with the width (W), the height (H) and the hydraulic diameter (DH): They are 5.98 mm, 2.95 mm and 3.95 mm for the wide channel, while 3.09 mm, 2.79 mm and 2.94 mm for the narrow channel, thus the ratio of contraction σA is about 0.49.Table 1. Dimensions of test channel cross section
 |
| |
|
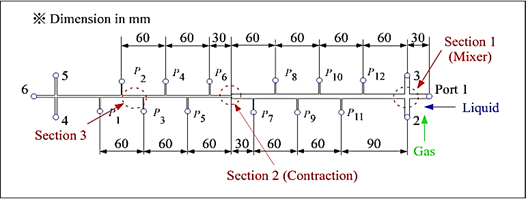 | Figure 1. Test channel with sudden contraction |
The ports #1 and #2 in Fig. 1 were the liquid and the gas inlet ports. Therefore, two phases were supplied through a T-junction type gas-liquid mixer. The port #6 was the outlet of the gas-liquid mixture to atmosphere. The ports #3, #4 and #5 were closed in the present experiment. It is noted that if ports #5 and #6 were used as the inlet ports of gas and liquid, and ports #4, #2 and#3 were closed, the sudden expansion test can be conducted with the same test channel. P1 to P12 were the pressure taps, and the pressure at P4 was measured with a gauge type pressure transducer (Yokogawa, FP101-L31-L20). The pressures at other pressure taps were determined from the difference in pressure between the respective taps and P4 tap measured with a differential pressure transducer (Validyne, DP15-32 and DP15-26 depending on the pressure range). The accuracy of the pressure measurement was confirmed within 3.5 Pa from a calibration test. Volume flow rate of air was measured with a flow meter (KEYENCE, FD-A10 and FD-A1 depending on the flow rate range) within 2%, while that of liquids with a flow meter (KEYENCE, FD-S) within 1%. In order to obtain accurate time averaged values of air and water flow rates and pressures, the output signals from the respective sensors were fed to a personal computer via A/D converter at nominally 1 kHz over 10 sec.In this study, water and aqueous solution of 0.1 wt % polyacrylamide (PAM) were selected as the working liquid, while air at room temperature as the working gas. Polyacrylamide aqueous solution is known as a kind of non-Newtonian fluid having viscoelasticity (Chhabra et al., 1984). Also, PAM aqueous solution has shear thinning effect where the fluid’s viscosity decreases with increasing of shear rate and is often expressed by the Ostwald-de Waele power law model as follows: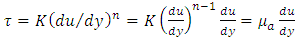 | (1) |
where  is the shear stress,
  the shear rate, K the consistency coefficient, n the flow index and
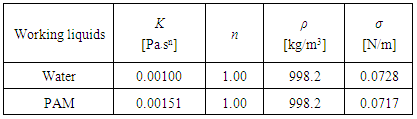
 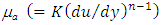 the apparent viscosity. In this study, the values of K and n for the test liquids were determined with a capillary method (Farooqi et al., 1980), and are listed in Table 2 together with the density and the surface tension. n for PAM aqueous solution is nearly equal to unity because the concentration of PAM is quite low and the shear rate tested is relatively high (= 500 – 7500 1/s). In addition, the density and the surface tension are nearly the same between water and PAM aqueous solution. So, any changes in the test results are due mainly to the change in the viscosity of the test liquid.
 Table 2. Physical properties of test liquids
 |
| |
|
For single-phase flow experiments, the range of Reynolds number ( , where u is the mean velocity) in the narrow channel ReN was from 320 to 9600 for water, and from 290 to 5900 for PAM aqueous solution. For two-phase flow experiments, the ranges of volumetric fluxes of liquid and gas were 0.2 < jL < 2 m/s and 0.1 < jG < 10 m/s for both test liquids. In two-phase flow experiments, in addition to the above pressure drop measurements, flow pattern was observed with a high-speed video camera (KEYENCE, VH-Z00R) in three sections marked with broken circles in Fig. 1, and bubbles velocity, uG, in bubbly and slug flows in the straight channels was measured with the high-speed video camera. Furthermore, void fraction, α, data was obtained by substituting the measured uG and the gas volumetric flux, jG, into α = jG/uG.
3. Experimental Results and Discussions
3.1. Data Reduction
Figures 2 (a) and (b) show examples of pressure distribution data obtained for air-water and air-PAM aqueous solution two-phase flows. The ordinate is the gauge pressure, while the abscissa is the distance from the singularity. The total pressure drop across sudden contraction, ∆pc, was determined by the extrapolations of the axial pressure profiles upstream and downstream from the contraction. ∆pc consists of the irreversible and reversible pressure drop, and could be expressed by the following Kays’s equation (Kays, 1950):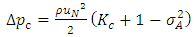 | (2) |
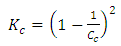 | (3) |
where ρ is the density of working fluid,  the mean velocity in the narrow channel, Kc the contraction loss coefficient and CC the contraction coefficient.
  | Figure 2. Pressure distribution along upstream and downstream from contraction for typical two-phase flows |
In order to check the accuracy of the pressure measurement, the single-phase friction factors were determined from the fully developed upstream and the downstream pressure gradients. Figs. 3 (a) and (b) show the Darcy friction factor data respectively for the channels upstream and downstream of the contraction of σA = 0.49. The data are plotted against the Reynolds number, based on the hydraulic diameter. The present data in laminar flow region are compared with calculated curve by Shah and London (1978) which is a function of aspect ratio,  , for a rectangular channel:
  | (4) |
In addition, the data in turbulent flow are compared with calculated curve by Sadatomi et al. (1982).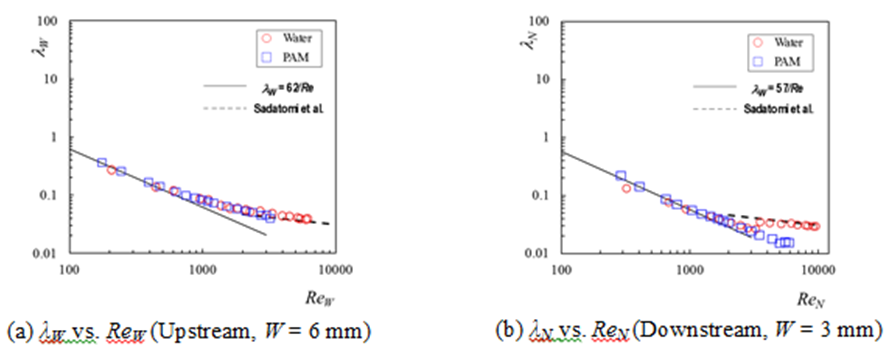 | Figure 3. Single-phase friction factors in channels upstream and downstream from the contraction |
Figure 4 shows the present contraction coefficient data for single-phase liquid flows, CC, against Reynolds number in the narrow channel. Solid line shows the calculation by Geiger’s correlation (Geiger, 1964) which is applicable to turbulent flows in a conventional size circular channels: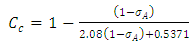 | (5) |
This correlation was developed based on the data for turbulent flow in 9.70 mm, 12.87 mm and 16.10 mm diameter circular channels with the contraction ratio of 0.144 to 0.398. Fig. 4 shows that the CC data increase with the Reynolds number, and approach to the calculated value by Geiger’s equation in turbulent flow region. 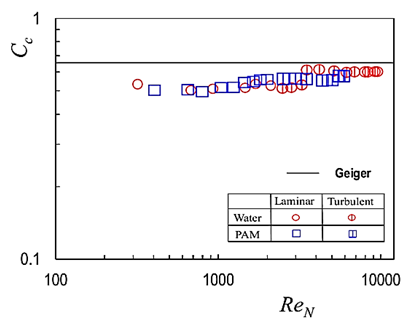 | Figure 4. Contraction coefficient data against Reynold number in the narrow channel for single-phase liquid flow |
3.2. Flow Pattern in Two-phase Flow
Figures 5 (a) and (b) show the flow pattern map for the test channel upstream and downstream from the contraction in the present experiment. The ordinate and abscissa are the volumetric fluxes of liquid (water and PAM) and air. The effects of liquid viscosity are small in the present experimental range, and there existed no bubble flow in the channel downstream. 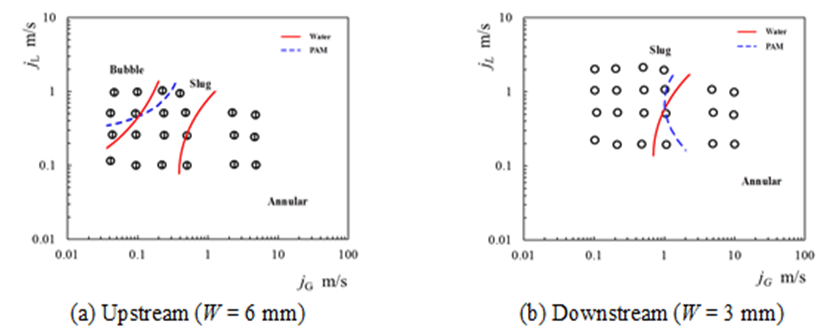 | Figure 5. Flow pattern map |
Figures 6 (a)-(c) show typical air-water flows in the test channel, respectively for a bubbly flow at jG = 0.1 m/s, jL = 1 m/s, a slug flow at jG = 0.5 m/s, jL = 1 m/s and an annular flow at jG = 5 m/s, jL = 1 m/s. In bubble flow case, bubbles in the narrow channel (downstream from the contraction) are similar size to the channel width, thus the flow pattern becomes slug flow.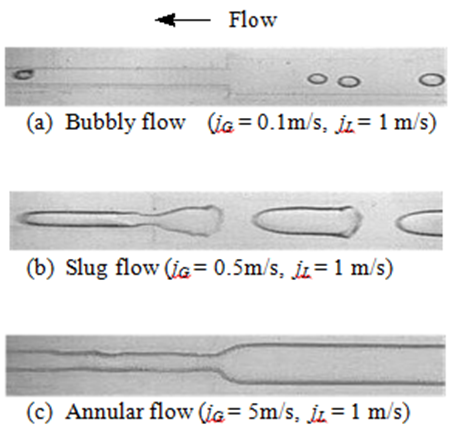 | Figure 6. Flow pattern (air-water flow) |
Figures 7 (a) and (b) compare air-water and air-PAM flows at jG = 0.5 m/s, jL = 0.2 m/s. In air-water flow case, gas bubbles in the wide channel become slender after entering into the narrow channel and become large gas bubbles, being longer than the channel width. In air-PAM flow case, on the other side, large gas bubbles in slug flow in the wide channel become longer in the narrow channel. The liquid film thickness around large gas bubbles is thicker in air-PAM flow than air-water flow, as clearly seen in the narrow channel.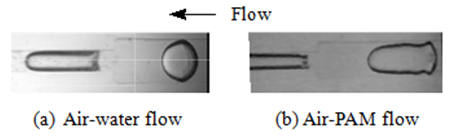 | Figure 7. Typical flows in test channel (jG = 0.5 m/s, jL = 0.2 m/s) |
3.3. Bubble Velocity and Void Fraction in Two-phase Flow
Figure 8 shows the bubble velocity data, uG, in the present experiment against the total volumetric flux of gas and liquid, jG + jL. Bubble velocity data for both the narrow channel and the wide channel upstream and downstream from the contraction are simultaneously plotted. The solid line of uG = j is applicable to homogenous flows, while the broken line represents the calculation by Nicklin et al.’s correlation (1962): | (6) |
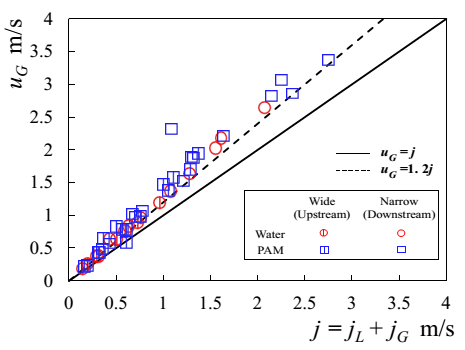 | Figure 8. Bubble velocity (uG vs. j) |
Figure 9 shows the void fraction data, α, in the present experiment against the gas-phase volume flow rate fraction, 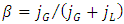 . The solid line of α = β is applicable to homogeneous flow, and the dashed line represents the Armand’s correlation (1946),
  . Almost all the α data, especially for air-water case, agree reasonably with the calculation by Armand’s correlation. The most data for air-PAM flow case are lower than air-water flow case because liquid film around large gas bubbles becomes thicker than that in air-water case.
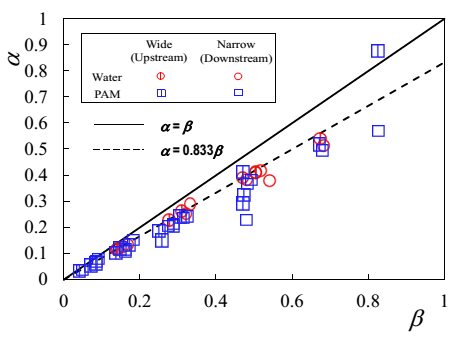 | Figure 9. Void fraction (α vs. β) |
3.4. Bubble Length
Figure 10 shows the bubble length data divided by the channel width, LG/w. The abscissa is the ratio of the gas volume flow rate to the liquid one, QG/QL. The solid curve represents calculation by Garstecki et al.’s correlation (Garstecki, 2006): 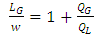 | (7) |
The data for both the upstream and the downstream channels have a similar trend to the solid curve, but shows higher values as QG/QL increases.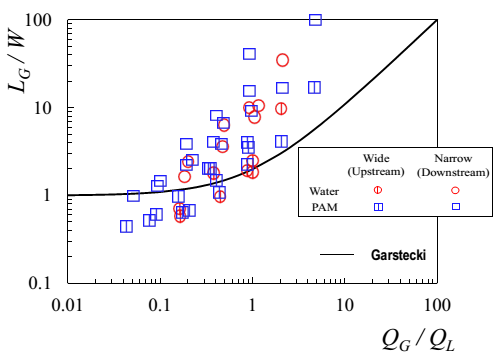 | Figure 10. Dimensionless bubble length data plotted against gas-liquid volume flow rate ratio in the upstream and the downstream channels |
Figure 11 shows the present data on the ratio of bubble length, LG, to unit cell length, 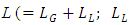 is the liquid slug length), against the homogeneous void fraction
  in the upstream and the downstream channels. The solid curve shows the calculation by Kawahara et al.’s correlation (Kawahara et al., 2011):
 | (8) |
Eq. (8) was based on the data for horizontal straight microchannels with square and circular cross-sections. The data for the air-water flow case distribute around the curve. The data for the air-PAM flow case, however, are higher than the calculation by Eq. (8). The large gas bubbles in air-PAM flow case are elongated as a result of the thickening of the liquid film around the bubbles. In order to develop better LG/L correlation, further experimental studies are needed by increasing the PAM concentration in water, i.e., the liquid viscosity. | Figure 11. Length ratio of large gas bubble to unit cell plotted against homogenous void fraction |
4. Conclusions
Liquid single-phase flow and air-liquid two phase flow experiments were conducted at room temperature and at near atmospheric pressure using a horizontal rectangular minichannel with a sudden contraction. The width and the height of the channel was changed from 6 mm by 3 mm to 3 mm by 3 mm. In order to study the effects of liquid viscosity, water and polyacrylamide (PAM) aqueous solution with mass concentration of 0.1 wt % were used as the test liquid. From the present experimental investigation, the conclusions can be summarized as follows:1. Contraction coefficient data for the single-phase flows increased with Reynolds number and gradually approached to the calculation by Geiger’s correlation in turbulent flow region.2. As for the flow pattern, bubble flow, slug flow and annular flow were observed in the wide channel, while slug flow and annular flow in the narrow channel.3. The bubble velocity data for both water and PAM liquid were higher than that calculated by homogenous flow model, but agreed reasonably with the calculation by Nicklin et al.’s correlation. 4. Almost all the void fraction data, especially for air-water case, agreed reasonably with the calculation by Armand’s correlation. The most data for air-PAM flow case were lower than those for air-water flow.5. The bubble length data for both the upstream and the downstream channels were longer for air-PAM flow case than air-water one.
References
| [1] | Abdelall, F. F. et al. (2005). Pressure drop caused by abrupt flow area changes in small channels. Experimental Thermal and Fluid Science, 29, 425-434. |
| [2] | Armand, A. A. (1946). The resistance during the movement of a two-phase system in horizontal pipes. Izvestia Vses. Teplotekh. Inst., 1, (AERE-Lib/Trans 828) 16-23. |
| [3] | Chen, I. Y. et al. (2009). Two-phase flow pressure change subject to sudden contraction in small rectangular channels. International Journal of Multiphase Flow, 35(3), 297-306. |
| [4] | Chen, I. Y. et al. (2007). Two-phase flow characteristics across sudden expansion in small rectangular channels. Experimental Thermal and Fluid Science, 32(8), 696-706. |
| [5] | Chen I. Y., et al. (2008). Two-phase flow characteristics across sudden contraction in small rectangular channels. Experimental Thermal and Fluid Science, 32(8), 1609-1619. |
| [6] | Chhabra, R.P. et al. (1984). Isothermal two-phase flow of air and aqueous polymer solutions in a smooth horizontal pipe. Chemical Engineering and Design, 62, 22-32. |
| [7] | Farooqi, S.I., et al. (1980). Rheological behavior of kaolin suspensions in water and water glycerol mixtures. Transactions of the Institution of Chemical Engineering, 58, 116-124. |
| [8] | Garstecki, P. et al. (2006). Formation of droplets and bubbles in a microfluidic T-junction-scaling and mechanism of break-up. Lab on a Chip, 6(2), 437-446. |
| [9] | Geiger, G.E. (1964). Sudden contraction losses in single and two-phase flow. Ph.D. thesis, University of Pittsburgh, USA. |
| [10] | Kawahara, A. et al. (2015). Characteristics of gas–liquid two-phase flows through a sudden contraction in rectangular microchannels. Experimental Thermal and Fluid Science, 66, 243-253. |
| [11] | Kawahara, A., Sadatomi, M. & Shimokawa, S. (2012). Bubble and liquid slug length for two-phase flows in rectangular microchannel with T-junction type gas-liquid mixer. Multiphase Science and Technology,24(3), 234-256. |
| [12] | Kays, W.M. (1950). Loss coefficient for abrupt changes in flow cross section with Reynolds number flow in single and multiple tube systems. Trans. ASME, 72(50-s-7), 1067-1074. |
| [13] | Kusumaningsih, H.et al. (2013). Effects of singularities on single-phase and gas-liquid two phase flows in rectangular microchannel. Proc. of International Conference on Multiphase Flow 2013, Jeju, Korea, 14 pages. |
| [14] | Nicklin, D.J., et al. (1962). Two-phase flow in vertical tubes. Transactions of the Institution of Chemical Engineering, 40, 61-68. |
| [15] | Padilla, M. et al. (2013). Two-phase flow of HFO-1234yf, R-134a and R-410A in sudden contractions: Visualization, pressure drop measurements and new prediction method. Experimental Thermal and Fluid Science, 47, 186–205. |
| [16] | Sadatomi, M. et al. (2013). Air-water two-phase flow through U-bend, sudden expansion and sudden contraction in rectangular mini-channels. WIT Transactions on Engineering Sciences, 78, 63-75. |
| [17] | Sadatomi, M., Sato, Y. & Saruwatari, S. (1982). Two-phase flow in vertical noncircular channels. International Journal of Multiphase flow, 8(6), 641-655. |
| [18] | Shah, R.K., London, A.L. (1978). Laminar Flow Forced Convection in Ducts. Academic Press, New York. |
| [19] | Wang, C.C. et al. (2010). A new correlation and the review of two-phase flow pressure change across sudden expansion in small channels. International Journal of Heat and Mass Transfer, 53(19-20), 4287-4295. |

 Abstract
 Reference
 Full-Text PDF
 Full-text HTML