Mukhtar M. A. Morad1, Ahmad Murad1, Abdulwahab Ali Alnaqi1, Hasan Mulla Ali1, Esam AM Husain1, Ahmad Alkandari2
1Department of Automotive and Marine Engineering Technology, College of Technological Studies - PAAET, Kuwait
2Department of Electrical Engineering Technology, College of Technological Studies - PAAET, Kuwait
Correspondence to: Abdulwahab Ali Alnaqi, Department of Automotive and Marine Engineering Technology, College of Technological Studies - PAAET, Kuwait.
| Email: |  |
Copyright © 2016 Scientific & Academic Publishing. All Rights Reserved.
This work is licensed under the Creative Commons Attribution International License (CC BY).
http://creativecommons.org/licenses/by/4.0/

Abstract
The two major areas of engine development in the automobile industry is concentrating and putting its major development effort on the emission control and improve fuel efficiency. The objective of this study is to develop a methodology and typically to validate the results with experimental data, this development either directly or indirectly impact the vehicle performance requirement significantly, during the test carried out under different running condition, the results shows the electric vehicles (EVs) have better operation especially in urban area. The theoretical analytical calculation have been performed for both pure electrical and mechanical vehicles, this study will help to compare the consumption cost there by saving time and effort to choose the lower running cost.
Keywords:
Electric vehicles, Fuel consumption, Experimental analysis
Cite this paper: Mukhtar M. A. Morad, Ahmad Murad, Abdulwahab Ali Alnaqi, Hasan Mulla Ali, Esam AM Husain, Ahmad Alkandari, The Comparison Cost of EVs Charging via Plug-in Electricity and Gasoline Source, Journal of Mechanical Engineering and Automation, Vol. 6 No. 1, 2016, pp. 1-7. doi: 10.5923/j.jmea.20160601.01.
1. Introduction
The internal combustion engines powered vehicles have been in constant use ever since these where invented. There have been many innovations and developments in the design and manufacture of such vehicles. However, in recent years it has become apparent that today’s fuel powered vehicles are far from ideal for urban use. These not only produce air pollution, but also suffer from poor fuel efficiency [1].The stringent regulations imposed upon manufacturers regarding clean air and other environmental problems due to widespread usage of automobiles like traffic noise level, traffic jam, parking difficulties and also the threatening shortages of hydrocarbon fuels, the distribution of world’s oil supplies in 1973 and the soaring oil prices of 1978 have led to serious considerations by researchers and planners to shift towards alternative energy resources, for the transport area [2].There have been considerable reseach on purely electric vehicles since the introduction of automobiles and, in fact, the world’s first automobuile were propelled by electricity and it was an electric car that sot the first official world speed record in 1898 [2, 3]. Improvement in batteries weight reduction might be attractive for widespread acceptance. Electric vehicle differ from fossil fuel-powered vehicles in that the electricity consumers can be generated from many sources, even when power is generated using fossil fuels, electric vehicles usually compared to gasoline vehicle, show significant reductions in emission, and quitter operation [4]. The present work was aimed to compare between EVs and conventional internal combustion engine from fuel consumption point view.
2. Electricity Sources
There are many ways to generate electricity, of varying costs, efficiency and ecological desirability. Direct connection to generation plant such as generated on board using a gasoline engine coupled to electric generator plant (nearly always when stationary) and then disconnected before motion occurs and the electricity is stored in the battery until needed. Another form of charging the battery, using electric charger, this system directly connecting to the main source to utilize any external source of electricity stored in the rechargeable battery to drive the wheels.
2.1. Battery Types and Specification
a) Lithium-ion BatteryLithium-Ion (and similar Lithium polymer) battery, widely known through their use in laptops and consumer electronics, dominate the most recent group of EVs in development. The most EVs are utilizing new variations on lithium-ion for the reasons provide fine resistance, environmental friendliness very rapid charge (as low as a few minutes) and very long life spans. These variants (phosphates, titamates, spinels) have been shown to have a much longer lifetime, with A123 expecting their lithium-ion phosphate batteries to last for at least 10+ years and 7000+ charge cycles [5], and LG chem expecting their lithium manganese spirel batteries to last up to 40 years. Much work is being done on lithium ion batteries in the lab. to overcome the inconvenient situation occurs during vehicle operations.b) Lead-acidFlooded lead-acid batteries are the cheapest and most common traction batteries available. There are two main types of Lead-acid batteries, automobile engine starter batteries and deep cycle batteries. Automobile alternators are designed to provide starter batteries high charge rates for fast charges, while deep cycle batteries used for electric vehicles like forklifts or golf carts, and as the auxiliary house batteries in RVs, require different multi-stage charging, but deep cycle lead batteries are expensive and have a shorter life than the vehicle itself, typically needing replacement every 3 years.Lead-acid battery should not be discharged below 50% of its capacity, as it shortens the battery life. Flooded batteries require inspection of electrolyte level and occasional replacement of water which gasses escape away during the normal charging cycle. Most electric vehicles have used Lead-acid batteries due to their mature technology, high availability and low cost. Like all batteries these have an environmental impact through their construction, use disposal or recycling. On the upside, vehicle battery recycling rates top to 95% in the United States. Charging and operation of batteries typically results in the emission of hydrogen, oxygen and sulfur, which are naturally occurring and normally harmless. If not vented properly, unpleasant sulfur smells would leak into cabin immediately after charging [5-6].c) Nickel Metal hydrideNickel metal hydride batteries are now considered a relatively mature technology. While less efficient (60-70%) in charging and discharging than even lead-acid, they boast an energy density of 30-80 wh/kg. far higher than lead-acid. When used properly, Nickel-metal hydride batteries can have exceptionally long life has been demonstrated in their use in hybrid cars and surviving NiMHRAV 4EVs that still operate well after 100,000 miles (160.000 km) and over a decade of service. Downsides include the poor efficiency, high self-discharge, very finicky charge cycle and poor performance in cold weather [6].
3. Theoretical Analysis
3.1. Performance Characteristics of Battery
The battery applied consist of 8 cells. The battery used was 100 Ampere-Hour. (hour rating) 24 volt having outside dimensions of 28 × 14.5 ×23.4 cm and net weight of 25.6 kg having 3.v per cell. The battery performance was evaluated by testing the battery during charging and during discharging with different discharge rates. The battery was charge by means of electric generator or plug-in electricity and a portable battery charger whose capable of supplying a maximum charging current of 100 amps. During charging the battery voltage was recorded until the value of the relevant voltage remained unchanged. This indicated that the battery was fully charged. Fig (1) shows the test rig used for battery discharge. The variable resistance in this figure was adjusted during discharging in order to maintain a constant discharge rate. The battery voltage and ambient temperature were recorded during discharging. Test was carried out to give the change of battery voltage with battery capacity from the different discharge rates refereed to Fig (2). Evidently the battery capacity decreases with increase of discharge rate. Also the variation of battery voltage, battery capacity and mean battery power obtained with different discharge currents. In addition to the variation of charger voltage, battery voltage, charging current with time during battery charging with the normal charging rate [7].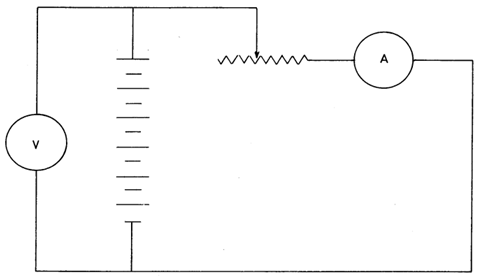 | Figure 1. Test Rig for Battery Discharge |
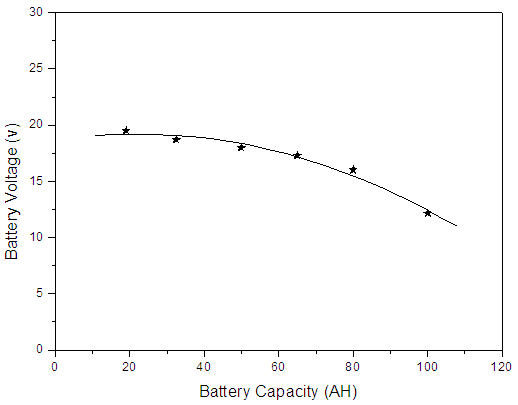 | Figure 2. Battery Voltage vs Battery Capacity |
Battery power is vary throughout the working operation during the test drive by changing the load (changing the current) since the battery voltage is 24 volt at fully charge, while the current is varying accordingly power will be change. Fig (3), Fig (4). | Figure 3. Battery Voltage vs Discharge Current |
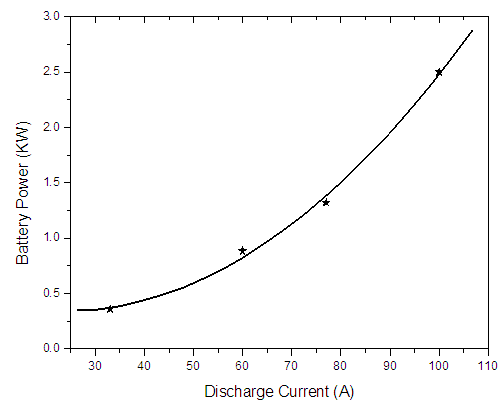 | Figure 4. Battery Power vs Discharge Current |
Since Amp hours is how much charge is stored in the battery, if multiplying the average or nominal battery voltage times the battery capacity in amp-hours gives how many watt-hours the battery contains [8]. | (1) |
Where:E = the energy stored in watt-hoursC = battery capacity in amp-hoursVavg = is the average voltage during dischargeWhere the battery discharged quickly, battery efficiency will reduce. A typical sealedlead-acid battery will give only half of its rated capacity when discharged at the C/1 rate compared with the C/20 rate.If the current drawn is x amps, the time is T hours then the capacity C in amp- hours is | (2) |
If a device is drawing 120mA and it should run for 24 hours It is not good to run a battery all the way down to zero during each discharge cycle. In the case of lead Acid battery you shouldn't run it post 80% of its charge, Leaving 20% left in the battery.This not only extends the number of cycles you get, but lets the battery degrade by 20% before you start getting less run time than the design calls for
  | (3) |
for the above example Then if we take the high rate into account
 Thus we need a 7.2 amp hour sealed lead acid battery to run the device for 1 hour at 20 amps average.
3.2. Performance Characteristics of Torquer
The torquer should be tested at constant terminal D.C voltage of 12, 18, 24 volt,. These terminal voltage are equivalent to these prevailing when the car is working, the torquer is fed from the battery. The torquer load is vary according to the driving conditions. The following test configurations were applied [9, 10].1-Supply voltage 18vFig (5) gives the variation of the motor torque against the motor speed while Fig (6) indicates the corresponding change of motor power with motor speed. And Fig (7) shows the associated variation of the motor efficiency with motor speed.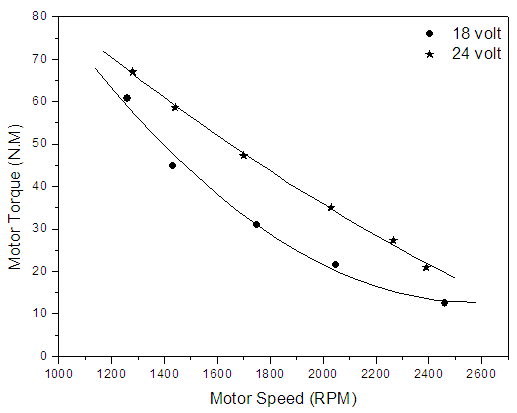 | Figure 5. Motor Torque vs Motor Speed |
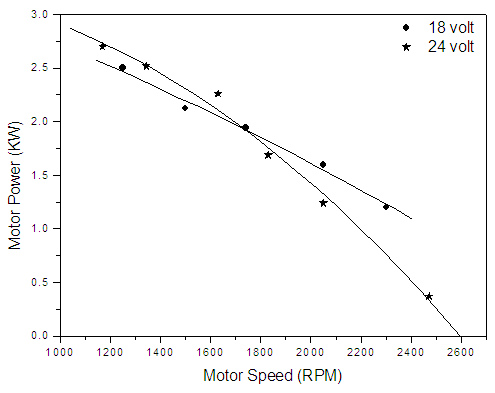 | Figure 6. Motor Power vs Motor Speed |
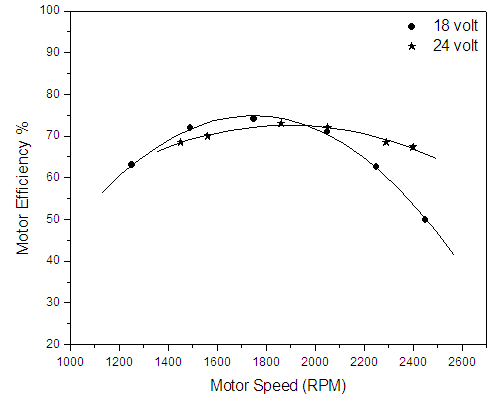 | Figure 7. Motor Efficiency vs Motor Speed |
2-Supply Voltage 24vFig (5) gives the variation of the motor torque against the motor speed while Fig (6) indicates the corresponding change of motor power with motor speed. And Fig (7) shows the associated variation of the motor efficiency with motor speed.The following example classifies the method of solution adapted to compute the torquer efficiency. Assuming a transmission efficiency of 96% when the
  working on level road and constant speed. In this case the power of the torquer is equal to the power absorbed by
 Thus the efficiency of
  It is interesting to compere the fuel cost where using the engine with that obtained under all electric vehicle i.e when applying the electric motor. To obtain the cost of battery charging, referring to fig (8) where the variation of charger voltage, battery voltage and charging current Fig (9) where charging the battery from a commercial charger at a moderate rate of charging, is given as:Charging time = 4 hoursMean charging current to the battery = 20 Amp.Mean charging voltage = 25 voltMean value of A.C. voltage feeding charger = 225vMean value of A.C current feeding charger = 4 Amp.
 A.C charging energy for the battery = 2880 whThus the efficiency of the charger is 0.7
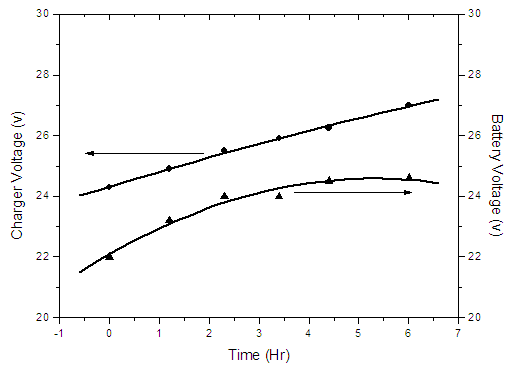 | Figure 8. Variation of Charger Voltage and Battery Voltage with Time |
 | Figure 9. Charging Current vs Time |
This gives a reasonable value for the charger efficiency. However assuming a charger efficiency of 0.8 which is generally used for battery charging & using the local energy cost of 2 fils/kwh the cost of charging the battery = 5.76 fils.Referring to Fig (10) the input power required to run the car at a constant speed of 40 Km/h on the level road = 2.4 k.w For a car speed of 40 km/h., engine speed applying, the given formula.  Thus the distance covered during that time is 10 km.
  | Figure 10. Brake power vs Car speed |
Also the cost of electrical energy supplied during that time excluding, the cost of battery, motor and control system depreciation is 5.76 fils. Thus compared to the Petrol, the petrol cost at the present time in Kuwait is 65 fils/Lit for 95 octane number accordingly the energy cost where using the engine will be 1.56 fils/Km [11].Evidently this sum gives the fuel cost only irrespective of all cost such as maintenance, depreciation etc.
3.3. The Performance Characteristics of the Car
The specifications of the car, that has been selected, have been given in Appendix (1). The traction characteristics of this car are computed throughout the following procedures. In the case of this car the power required is equal to the fuel consumption at different speeds for constant distance on level road [12].Determination of car fuel consumption:-1) Car running on level road with constant speed:The car fuel consumption is estimated at different constant speeds varying from 10-50 km/h, when the car travelling on the level road and assuming using a petrol engine to compose the running cost for different modes of operation, electric or mechanical.A sample of the relevant calculations is given in the following part for one of the reference car speed generally applied in case of the given car [13, 14].Car fuel consumption at 40 km/hThe car tractive effort, Ft is given by | (4) |
Where: Since the car runs on the level road with constant speed, the tractive effort is given by
  | (5) |
The rolling resistance when the car is running on the level road is given by | (6) |
Where:-W = Car weight = 250 kgfr = coefficient of rolling resistance The coefficient of rolling resistance is determined from Andreau's relationship as given by: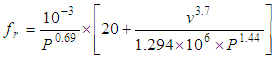 | (7) |
Where:P = Inflation pressure (kp/cm2)v = car speed (km/h)In the present case with P = 6.8kp/cm2V = 40 km/hfr = 0.0761Fr = fr w = 186.6 NIn case of a car speed of 40 km/h the air resistance. eq. is given by | (8) |
Where: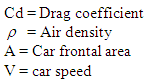 Taking Cd = 0.43 and
  at average atmosphere conditionsFa = 0.25 A V2The value of A is computed from the empirical formula
  | (9) |
Where:- the tractive effort Ft = Fr + Fa = 205.3 N
 | (10) |
Where: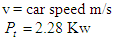
 | (11) |
Where: Assuming a transmission efficiency of 95% on this speed The engine brake power = 2.4 Kw
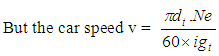 | (12) |
Where: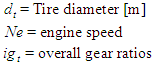 Thus Ne = 2136 r.p.mBut the engine brake power
 | (13) |
Where: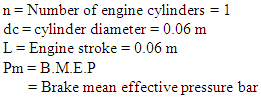 For brake power Pb = 2.4 kwThus Pm = 7.9 barFrom the performance map given in Fig (11) at the given values of Ne & Pm, the brake specific fuel consumption (B.S.F.C) = 290 g/kwh
 | Figure 11. Performance Map Showing Variations of Brake Mean Effective Pressure & Brake Specific Fuel Consumption with Engine Speed |
Thus the engine fuel consumption  | (14) |
But the car fuel consumption 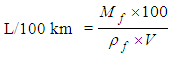 | (15) |
Where: Thus the car fuel consumption = 2.4 L/100 km
4. Conclusions
The fuel economy of an automotive is the fuel efficiency relationship between the distance travelled and the amount of fuel consumed by the vehicle.The objective of this study described in this paper was to investigate the fuel consumption as a function of a constant distance throughout the test for pure mechanical mode. Pure mechanical or all electrical vehicle was tested for the same distance throughout the test under the same condition.In this study a methodology was developed to validate the calculated results with experimental data, this development either directly or indirectly impact the vehicle performance requirement significantly, during the test carried out under different running condition, the results shows the electric vehicles (EVs) have better operation especially in urban area.The cost analysis based on the fuel consumption involving the operation of mechanical modes has been done, the fuel cost has been considered irrespective of all other costs such as maintenance, depreciation..etc.In the electrical mode, the comparable cost excluding the cost of the battery, motor and control system depreciation has been computed. It has been shown that the energy cost for purely electrical model is only 37 percent of the cost of purely mechanical mode. This might be due to prevailing lower cost electricity sales in Kuwait at present.
Appendix (1)

References
| [1] | Fuel economy in automobiles-From Wikipedia the free encyclopedia. |
| [2] | Plug - in Electric vehicles (PEVs), Center for Sustainable Energy California. Retrieved 2010-03-31. |
| [3] | David B. Sandalow. Ed (2009) Plug- In Electric vehicles, what role for Washington. |
| [4] | Code Federal Regulations. Title 49 - Transportation – Section 567.4 Requirement for manufactures of motor vehicle USA 2014. |
| [5] | EVs word wire tesla receives first Panasonic lithium-ion battery, EVworld.com, Retrieved (2010). |
| [6] | Effects of Winter on Tesla Battery Range and regen, teslati.com (2014), Retrieved (2015). |
| [7] | The Theoretical Analysis on the performance of a traction system M.M.A. Murad. Jasem. M. Al-Rajhi., International Journal of Science and Advanced Technology (ISSN 2221-8383) volume 3 no. 8 Aug. 2013. |
| [8] | Andrew English (2014) why electric vehicles must catch on, Daily Telegragh, Retrieved (2014). |
| [9] | The measurement of fuel consumption during rush hours at urban cycle in Kuwait city-Journal of Mechanical Engneering and Automation. M.M.A. Murad, Jasem. M. Al-Rajhi. |
| [10] | Fuel consumption rating (w.w.w.oee.nrcan.gc.caltransporation/ fuel ratings/ ratings-search, cfmattr=8) Government of Canada. January 2011. |
| [11] | Fuel consumption ratings- Government of Canada. January 2011. Retrieved 8 June 2011. |
| [12] | New European Driving Cycle-From Wikipedia, the free encyclopedia. |
| [13] | Development of speed correction cycle. EPA Document MG.SPD.001, sierra Research 6 June 1997. |
| [14] | Gas prices toohigh- 2005/0826 PoL 1-9. |

 Abstract
 Reference
 Full-Text PDF
 Full-text HTML