Francisco Diego L. Moreira, Francisco Petrucio A. da Silva, Jefferson Silva Almeida, Geraldo Luis B. Ramalho
Federal Institute of education, science and technology of Ceará, IFCE - Maracanaú, Fortaleza, Brazil
Correspondence to: Geraldo Luis B. Ramalho, Federal Institute of education, science and technology of Ceará, IFCE - Maracanaú, Fortaleza, Brazil.
| Email: |  |
Copyright © 2015 Scientific & Academic Publishing. All Rights Reserved.
Abstract
Modelling has fundamental importance for study and simulation of processes. The Petri Nets allows simulation and graphical visualization of dynamic discrete process and provides means to identify bottlenecks, deadlocks and optimization parameters. This work presents a model in Petri Nets used to simulate a Machine Condition Monitoring System. The parameters of the simulated model can be used to reduce time and resources in implementing a real time embedded system on microcontrollers. The results of a part of the model are shown to illustrate our proposal.
Keywords:
Simulation, Monitoring System, Machine Condition
Cite this paper: Francisco Diego L. Moreira, Francisco Petrucio A. da Silva, Jefferson Silva Almeida, Geraldo Luis B. Ramalho, A Study of a Machine Condition Monitoring System Using Petri Nets, Journal of Mechanical Engineering and Automation, Vol. 5 No. 3, 2015, pp. 89-93. doi: 10.5923/j.jmea.20150503.01.
1. Introduction
Fault monitoring systems play an important role on predictive maintenance [1] because these systems monitor machine signs of changes in the operating condition of the machines. A classic method of monitor a condition of a machine is analysing the vibration signal obtained by accelerometers of type piezoresistive (PR) or piezoelectric (PE) [2]. The frequency spectrum of the signal contains harmonics of different amplitudes, which represent patterns of faults. In addition, many works have been employing complexity descriptors [3], multi-scale analysis [4, 5], fractal dimension [6], and pattern recognition [7-9] in this task.However, development of embedded systems for these applications is complex and involves a large number of steps to be controlled, for instance: signal sample rate, signal processing, feature extraction, storage, transmission and inference for diagnostic. Each stage has its own complexity and, therefore, should be well planned to avoid interfere in others and degrading the overall system performance. Previous study through simulation of a representative model of this system is a fundamental stage to minimize non-conformities during the system development and implementation. Performance analysis studies may be performed through classical modelling techniques or through computational simulation, provided that model approximates enough the real system [10].The Petri Nets (PN) has been used in modelling a variety of discrete processes on the automation industrial and also in process management field. It has been successfully employed in implementing fault diagnostic systems [9-11]. In [7], PN were used in a fault diagnosis system for induction engines monitoring. Being a formal technique of modelling and analysis, one advantage of PN is the possibility of simulating a model for different conditions, allowing the evaluation of dynamic behaviour of the system and following restrictions necessary for its implementation. In [12] a model in PN was used for to simulate various controllers of an automation system for mixture of propellant solid. The authors concluded that the simulation was useful to avoid non-compliance and to facilitate the detection and correction of potential conflicts prior.This paper presents the simulation results for a simplified model of a machine condition monitoring system using Hierarchical Colored Petri Nets (HCPN). The model allows simulating the dynamic behaviour of the system and was built to enable evaluate the system parameters prior to the implementation on a microcontroller system. Thus, the main objectives are define a logical arrangement for the system architecture and ensure that there are no blockages due to the use of shared resources.In the next section is shown a brief introduction to HCNP and the top-down approach used for monitoring system modelling. Section 3 presents the HCNP model and the results of the analysis. The conclusions and future work are presented in Section 4.
2. Materials and Methods
For this study we adopted HCPN modelling [13] using a top-down approach. We used the free software CPNTOOLS to assist building the model, analysis and reporting. Petri Network (PN) is a tool used in the description and analysis of processes of various types, including competitors, parallel, asynchronous, deterministic and stochastic [14]. Classical PN was initially proposed by Carl Adam Petri in 1962 as a mathematical framework to describe discrete process. The classical PN is based on the Place-Transition approach, the two main elements of the net. The third element, a tag, occupies a space called the place and is transported by an arch, the fourth element, from one place to another when triggering an enabled transition. In classical PN, there is only one type of tag to represent any recourse present in places. A transition may fire only if it is enabled, i.e. whether each place entry contains the number of tags corresponding to the number of arcs that connect that place to its respective transition.PN helps visualization of the dynamics of process model using a diagram or flow chart. The basic graphics elements of a PN are illustrated in Figure 1 (a). A place holds the resources (token) used in the model. The transition represents actions or tasks to be executed using the resources. The resources changes between places when a transition is triggered, representing transformations, developments or processing. Figure 1 (b) illustrates some basic logical structures of the PNs which, combined together, allow building models as complex as desired. Those structures allow modelling resource sharing, sequences of operations, conflicts, parallel tasks and logical operations.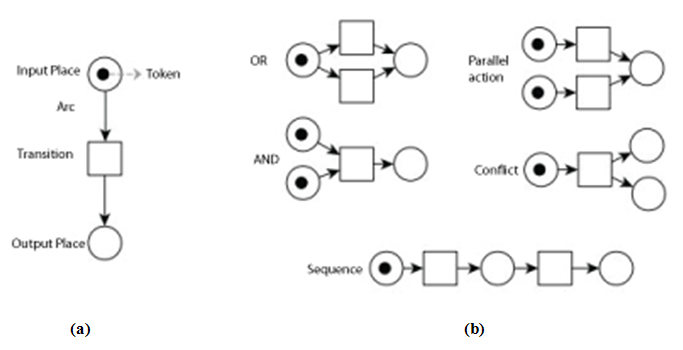 | Figure 1. (a) Basic graphical elements of a Petri Net. (b) Basic logical structures of a Petri Net |
To represent different types of resources on the same net, it was developed the concept of Colored Petri Nets (CPN) [15]. In CPN, the tags are different entities identified by different colors or simply distinct integers. A place can contain tags of different colors. The concept of enabling and triggering a transition is similar to the classic PN. However, this requirement shall be satisfied for each tag color.The hierarchical PN (HPN) is an extension of classical PN Place-Transition type. The hierarchy is strongly related to transitions concept. Each transition is an action that can be represented a full PN model containing task details. This concept makes the top-down modelling strategy a natural choice in this study. Using this approach, the initial model is, in general, abstract, having only semantic meaning. The details of each transition of the abstract model are modelled in a new net-child that depends on the input and output places of transition-father. In general, you can increase this hierarchy for various levels, increasing model detail but keeping its behaviour easy for human interpretation. The Hierarchical Colored Petri Nets (HCPN) merges both concepts of CPN and HPN.In CPNTOOLS tool [13], the concept of color has an implementation at a high level. A set of colors can represent different types of data structures from the literal integer or even records. In addition, CPNTOOLS also incorporates a version of the Markup Language (ML) programming language that allows include subroutines, logical expressions in the arches and transitions. The result is a potential of versatile combination of graphical modelling and validation of models through the mathematical properties of PNs with the flexibility of modelling complex systems and the simulation capabilities of different scenarios.To ensure the requirements defined for the proposed system, behavioural and structural [14, 16, 3] properties were evaluated on the HCPN model. The three key properties of the system evaluated in the model are: vivacity, repeatability and limitation [17].The next section presents the results obtained with the creation of a model in HCPN aided by CPNTOOLS. We also present the result of the implementation of the signal analysis submodel using vibration descriptors adapted from [3].
3. Results and Discussion
Using the top-down approach, we first built a generic model containing only an abstract representation of the system. Later, some actions have been added to match the desired level of detail for this study.The high-level model is illustrated in Figure 2. This model assumes that the machine to be monitored is powered (place "Powered Machine" contains a MAQ tag) and in operation. In pre-defined time intervals, an analysis is performed using the machine vibration signal to determine if it operates normally within acceptable levels of vibration, or if has a vibration level higher than expected. Having defined the operating status of the machine, the MAQ tag is stored either in place "Normal Operation" or "Abnormal Operation". 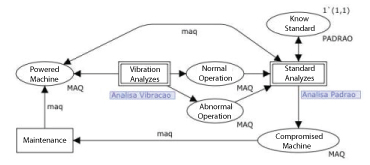 | Figure 2. High-level model of the condition monitoring system |
In the next step the vibration pattern is evaluated using specific metrics, based on multispectral analysis and fractal dimension metrics. If such pattern is unknown, a new pattern is stored in place "Know Standard". The vibration pattern is analysed to determine if the machine must be turned off or can continue in operation. If a MAQ tag is in place "Compromised Machine", only the transition "Maintenance" can be triggered until the fault is corrected.Transitions "Vibration Analyses" and "Standard Analyses" are hierarchically detailed in two subnets. The transition "Vibration Analyses" is shown in Figure 3. This subnet is basically the model of a microcontroller module to collect the digital vibration signal and signal processing order filtering and the calculation of some parameters such as the intensity of vibration (RMS) value. The sampled signal is filtered to minimize effects such as aliasing and noise [18], and stored in a local memory (place "vibration signal"). The collection and signal processing transitions were not detailed because they are irrelevant in this study. 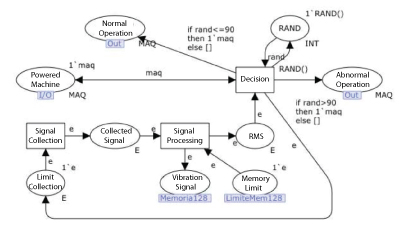 | Figure 3. Model of subnet vibration analysis containing the modules of signal acquisition and processing |
The decision criterion used to simulate this model assumes that 90% of the time the machine works under normal operating conditions. This criterion, however, can be adjusted as more information is obtained from validation tests. A logical expression (if-then-else) on the input arcs of the places "Normal Operation" and "Abnormal Operation" ensures that only one of them will receive the tag. The corresponding random number generated by the ML function RAND() and stored in place RAND models an uniform probability. The model for the subnet “Standard Analyzes” is shown in Figure 4. This subnet performs vibration pattern analysis (transition "Standard Calculates") to describe the condition of the monitored machine. Once a new pattern is identified, it is stored for further comparison. If the pattern is already known, it is used to decide if the machine is compromised or not.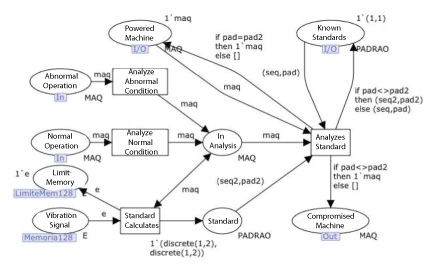 | Figure 4. Model of subnet “Standard Analyses” |
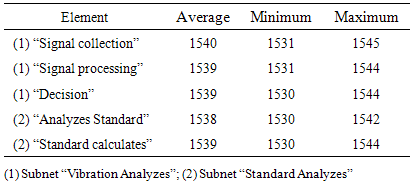
In order to test the model, it was submitted to simulations. First, to perform adjustments, optimizations in the logic blocks and evaluate the process sequence. In this analysis phase, state space diagrams were generated (State Space) using the CPNTOOLS.The state space (SS) analysis allowed identifying and removing deadlocks. It also was possible to classify the model according to their properties as:· Limited: no place tends to contain an unlimited number of records - ensures the use of the system memory is finite.· Reversible: eventually the initial marking is always achieved - ensures the system will work uninterruptible.· Alive: all transitions are shot at least once - ensures all the functions of the system are tested.Those features are desirable in a embedded system, since microcontrollers contain limited memory, should be able to repeat the same process any number of times and should not hang. Therefore, the model conforms to the requirements for proper operation.The model was simulated 100 times for a SS of size 10000. The monitored transitions and their respective triggered counting are listed in Table 1. The numbers are rounded to the nearest integer value. It can be seen that the numbers are very close to the different transitions. This means the tasks have equally tested. Looking at Figures 3 and 4, one can see that these transitions fire sequentially, but with minor variations in the order they are shot.Table 1. Statistical measures of proposed model - Average of triggers for 100 simulations
 |
| |
|
The results in Table 1 have two interpretations. The first is that the sequential nature of the model matches the requirements of using a simple microcontroller processor. As the most important tasks are performed only once, it becomes easier the sequential implementation of these tasks, especially on low memory microcontroller devices.On the other hand, the same results show that it may be necessary to make some parallel process stages to complain with optimizing response time. In the case of samples of the Figure 3 signal, for example, if some kind of noise that could prevent the correct interpretation of the signal is detected, there will be the need to repeat the process of collecting generating a large delay in the following steps. We implemented a simple condition monitoring system to evaluate the proposed model. This system employs many of the functions included in the model, including the vibration signal acquisition, pattern characterization and wireless data transmission. Except for the machine on/off controls, not implemented, this system executes the main functions of the model.Figure 5 shows the result of the embedded condition monitoring system using cheap microcontroller and peripherals. Each mark is a pattern consisting of 3 attributes (FD-fractal dimension, Ej-Energy of Jerk and B-bending energy) similar to the ones described in [3]. The data was collected from a pumping system in the interval of 10 minutes. 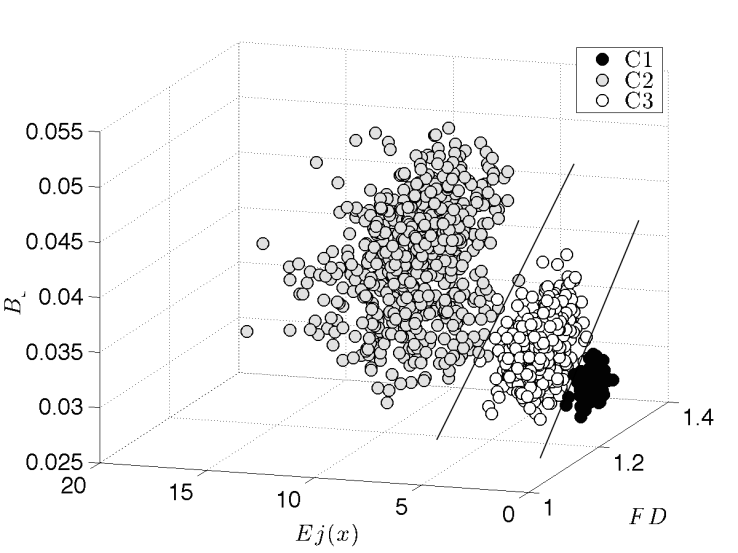 | Figure 5. Conditions provided by a monitoring system implemented using a version of the models “Vibration Analyzes” and “Stardard Analyzes” |
The graphical result shows three conditions of the monitored pump: C1 pump stopped (normal condition); C2 pump working (normal condition); C3 pump cavitation (abnormal condition). Simulations of the “Vibration Analyzes” and “Standard Analyzes” submodels were used to driven the detection and correction of bottlenecks, and to optimize the code for memory use. This partial implementation of the model depicted in Figure 2 provides the data that allows automatic detection of normal and abnormal conditions using discriminant analysis (exemplified by the lines).
4. Conclusions
The first significant result of this work is the assessment of machine condition monitoring system architecture by simulating process optimization, resource optimization and the elimination of the possibility deadlocks. Furthermore, the model is important in the management of embedded systems projects.Since the data of the CPNTOOLS model are stored in a file using the XML standard, the model can be used to automatically generate different versions of code for the microcontroller device. It is also possible to translate it to source code versions or simply determine different system operating logic from different input conditions for the model as we show in the results.This study does not take into account the time constraints inherent to acquisition, processing and transmission of data. This is an important aspect that needs to be further investigated in order to define the parameters for the hardware implementation of the monitoring system using microcontrollers or FPGAs.
ACKNOWLEDGEMENTS
The authors thanks PFRH-PB 28 / PETROBRAS, 001/2014-GDG-PROAPP/DEPPI and13/2013-PRPI-PROINFRA/IFCE for providing financial resources.
References
| [1] | MIYAGI, P.; RIASCOS, L. Modeling and analysis of fault-tolerant systems for machining operations based on Petri nets. Control Engineering Practice, v. 14, n. 4, p. 397–408, abr. 2006. |
| [2] | JARDINE, A.; LIN, D.; BANJEVIC, D. A review on machinery diagnostics and prognostics implementing condition-based maintenance. Mechanical Systems and Signal Processing, v. 20, n. 7, p. 1483–1510, out. 2006. |
| [3] | RAMALHO, G. L. B. et al. Fault Detection in Induction Motors Using Vibration Patterns and ELM Neural Network. HOLOS, v.4, 2014. |
| [4] | CHEN, H.; CHUA, P.; LIM, G. Adaptive wavelet transform for vibration signal modelling and application in fault diagnosis of water hydraulic motor. Mechanical Systems and Signal Processing, v. 20, n. 8, p. 2022–2045, nov. 2006. |
| [5] | CHEN, H.; ZUO, M. J. Fault detection of gearbox with vibration signal analysis by a linear combination of adaptive wavelets. Analysis, n. July, p. 12–15, 2009. |
| [6] | NUGRAHA, H.; LANGI, A. Segmented fractal dimension measurement of 1-D signals: a wavelet based method. In: Asia-Pacific Conference on Circuits and Systems. v. 1, p. 195–198, 2002. |
| [7] | SU, H.; XI, W.; CHONG, K. T. Vibration Signal Analysis for Electrical Fault Detection of Induction Machine Using Neural Networks. 2007 International Symposium on Information Technology Convergence (ISITC 2007), IEEE, p. 188–192, nov. 2007. |
| [8] | YILMAZ, M. S.; AYAZ, E. Adaptive neuro-fuzzy inference system for bearing fault detection in induction motors using temperature, current, vibration data. In: IEEE EUROCON 2009, p. 1140– 1145, 2009. |
| [9] | FUERTES, J. J. et al. Visual dynamic model based on self-organizing maps for supervision and fault detection in industrial processes. Engineering Applications of Artificial Intelligence, v. 23, n. 1, p. 8–17, fev. 2010. |
| [10] | GUDIÑO-MENDOZA, B.; LÓPEZ-MELLADO, E.; ALLA, H. Modeling and simulation of water distribution systems using timed hybrid Petri nets. Simulation: Transactions of the Society for Modeling and Simulation International, v. 88, n. 3, p. 329–347, mar. 2012. |
| [11] | MARUTHI, G.; VITTAL, K. P. Electrical Fault Detection in Three Phase Squirrel Cage Induction Motor by Vibration Analysis using MEMS Accelerometer. In: 2005 International Conference on Power Electronics and Drives Systems. v. 2, p. 838–843, 2005. |
| [12] | BIZARRIA, F. C. P. et al. Simulação por Redes de Petri da Automação do Sistema Misturador Planetário de Propelentes Sólidos. VII Simpósio de Excelência em Gestão de Tecnologia. Resende, out. 2010. |
| [13] | JENSEN, K.; KRISTENSEN, L. M. Coloured Petri Nets. Berlin, Heidelberg: Springer Berlin Heidelberg, 2009. |
| [14] | CARDOSO, J; VALLETE, R. Redes de Petri. Florianópolis: Ed. da UFSC, 1997. |
| [15] | JENSEN, K. Coloured petri nets and the invariant-method. Theoretical Computer Science, v. 14, n. 3, p. 317–336, 1981. |
| [16] | MACIEL, P. R.; LINS, R. D.; CUNHA, P. R. Introdução às Redes de Petri e Aplicações. 1. ed. Campinas: Ed. da UNICAMP, 1996. |
| [17] | MURATA, T. Petri Net: Properties, Analysis and Applications. Proceedings of IEEE. v.77, No. 4, Abril, 1989. |
 Abstract
 Reference
 Full-Text PDF
 Full-text HTML