Ochiche Simeon Ochiche, Barinaadaa Thaddeus Lebele-Alawa
Department of Mechanical Engineering, Rivers State University of Science and Technology, PortHarourt, Nigeria
Correspondence to: Barinaadaa Thaddeus Lebele-Alawa, Department of Mechanical Engineering, Rivers State University of Science and Technology, PortHarourt, Nigeria.
| Email: |  |
Copyright © 2014 Scientific & Academic Publishing. All Rights Reserved.
Abstract
This paper focuses on improving compressor performance of two compressors in operation by reducing discharge pressure while one compressor is shut down. The aim is to minimize Loss Production Opportunity (LPO) while carrying out turnaround maintenance on one out of three compressors in parallel connection. Historic data was studied and analysed with particular attention to compressor performance improvement as a function of suction pressure, discharge pressure, power and efficiency. Discharge pressure was considered as the preferred decision variable for improving the compressor performance due to its ease of control and its minimal impact on the process facilities upstream of the gas compressor. A step change of 5 bar at a time, up to 15bar (drop from 360 to 345 bar) was simulated with prediction that 1bar change in pressure will gain about 0.634kg/s or 2282.4kg/hr of flow rate (2.0mmscfd) for the two compressors. ACompSIM simulation software was utilized for this study. The results were validated with field data from recent turnaround maintenance of one of the gas compressors with percentage deviation of 83% of the predicted throughput. A graph of pressure ratio plotted against efficiency indicated an improvement in efficiency, though minimal, as pressure ratio decreased. The actual LPO saved was about 11MBOPD which amounts to about 230MBOPD for the 21 days duration of the turnaround. The cost saving was estimated at $21MM. The reduction of discharge pressure as a control variable, considering the allowable limits due to reservoir constraint, improves the performance of centrifugal compressors.
Keywords:
Compressor, Performance, Improvement, Oil and gas
Cite this paper: Ochiche Simeon Ochiche, Barinaadaa Thaddeus Lebele-Alawa, Improving Compressor Performance to Reduce Loss Production Opportunities in Oil and Gas Production, Journal of Mechanical Engineering and Automation, Vol. 4 No. 3, 2014, pp. 101-109. doi: 10.5923/j.jmea.20140403.03.
1. Introduction
Loss of production is defined as the difference between the potential production and the actual production (Berdahl, 2011). The potential production rate at a time can simply be described as whatever is less of (i) delivery rate from reservoir, (ii) passing rate through subsea equipment, (iii) processing rate on the platform, and (iv) the export rate/storage capacity. Each of these stages in the upstream process of oil and gas can be a bottleneck for the actual production on an offshore platform. Accordingly, reliability for a continuous production plant should be the fundamental driver (Berdahl, 2011). Under Nigerian legislation driven by the Department of Petroleum Resources (DPR), operators are required to inspect all pressure vessels within a 5 year period / cycle based on prescriptive philosophy. Due to bed space limitation on offshore facilities, multiple turnaround projects are planned and carried out by identifying outage opportunities. This will reduce the work scope of the major turnaround before the expiration of the 5 years cycle. In this case, there are three gas compressors of four compression stages each, with natural gas stream as the working fluid. Each compressor has a capacity of 150mmscfd. These gas compressors were installed for gas re-injection to maintain reservoir pressure. Natural gas re-injection has become widespread over the last ten years (Arnold and Maurice, 1999). One of these three gas compressors is scheduled for a shutdown to carry out turnaround maintenance. Usually, in such operations where gas is separated as a result of oil production with the constraints of zero or minimum environmental impact due to gas flaring, oil production is reduced to compensate for the gas compression requirement lost to the shutdown of one compressor due to turnaround maintenance. See system schematic in Figure 1 below.In a previous work, compressors have been classified into two categories: positive displacement and dynamic compressors (Hansen, 2008). Positive displacement compressors in essence work by entrapping a volume of gas and subsequently reducing this volume which in turn increases the pressure. Dynamic compressors generally work by imparting movement to the gas (Hansen, 2008; Bendinelli et al, 2001). That is, kinetic energy is transferred from the machines internals to the gas. By subsequent reduction of this velocity the kinetic energy is converted into potential energy (pressure). The two main types of dynamic compressors are axial and centrifugal compressors. As the name implies, axial compressors impart movement to the gas in the axial direction. This is done by a series of rotors. Each rotor is followed by a stator where the kinetic energy, imparted to the gas by the rotor, is converted into pressure. Centrifugal compressors, on the other hand, work by imparting movement to the gas in radial direction by an impeller. This outward velocity is then converted in a diffuser. For centrifugal compressors, changes in pressure ratio have a significant effect on the actual flow through the machine. Thus, for a centrifugal compressor operating at a constant speed, the head or pressure ratio is reduced with increasing flow (Kurz et al, 2010). The centrifugal compressor causes the air to travel in radial direction from the impellers and pass through diffusers between stages prior to discharge. The air can be effectively cooled between stages by cooling the housing, resulting in near ideal compression stages. Except in the largest sizes, the overall efficiency of centrifugal compressors is less than that of positive compression machine. Centrifugal compressors provide a stable discharge pressure with wide variation in flow rate. Inter-stage cooling of centrifugal compressors is normally accomplished by water circulation through the casing. Units that discharge at less than 400 kPa (gauge) do not normally require cooling. Centrifugal compressors operate at high speeds with most commercial units running at approximately 20000 revolutions per minutes (rpm). In the aircraft and space industries speeds of 100000 rpm can occur. The advantages of centrifugal compressors become significant at flow rates in excess of 1200 L/s. The major advantages are large capacity, low vibration, compact construction, oil-free air discharge and self-limiting of the units. The major disadvantages include the necessity of a speed increaser (unless turbine driven), close running clearance, and high cost maintenance.Studies have also shown that reducing system pressure drop to increase suction pressure or decrease discharge pressure allows more gas to be compressed through the compressor without modifications (Goldenet al, 2002). On compressor capacity and driver power, it was also reported that Compressor driver power requirements can also limit the compressor maximum flow rate. The compressor suction pressure in the propane refrigeration cycle has been identified as the main decision variable for optimization of the compressor throughput (Hassan et al, 2009). The objective of the model was to minimize the total power cost for the refrigerant compressors. The low performance of centrifugal compressors operating in the oil and gas production facilities, compared with the original design has been examined (Akhtar, 2006). However, the focus of this work is to reduce loss production opportunity during planned turnaround of one out of three gas compressors, by improving the performance of the other two gas compressors in parallel connection with the compressor to be shutdown. This will be achieved by determining the actual capacity of the three gas compressors, evaluating the performance of the remaining two gas compressors (when one is shut down) for the possibility of accommodating the extra volume of gas within the shut down period, and then determine the operating conditions with respect to maximum throughput by altering the key variables of suction pressure, temperature, discharge pressure, and molecular weight. A schematic diagram of the gas stream is shown in figure 1.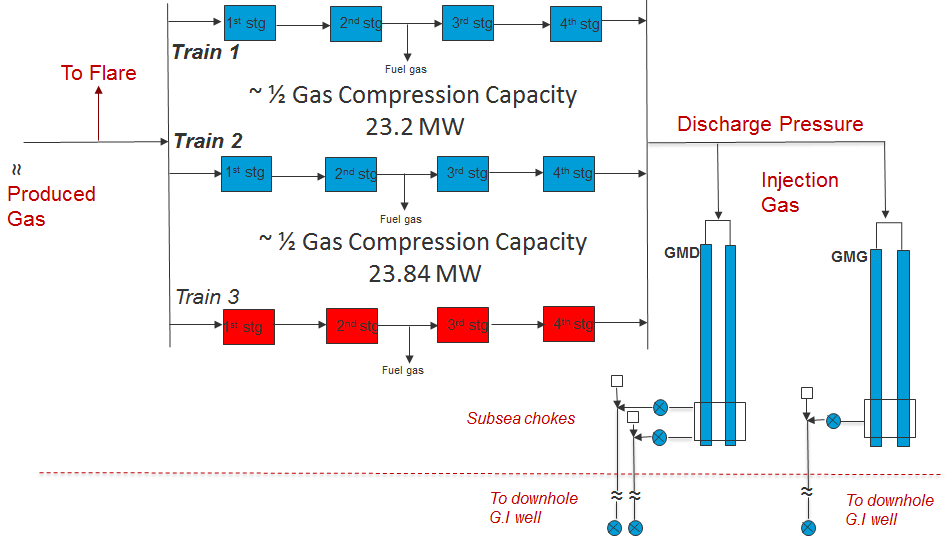 | Figure 1. Simplified Schematic of Gas Stream |
2. Materials and Methods
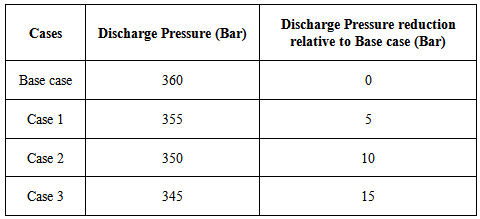
With all the fundamental concepts established, a working model that represents the gas compression system for gas re-injection (CompSIM) designed for simulating compressor performance and for analysis of data historian was used in running the cases generated in the course of this work. The methodology included the following:1. Data gathering and identification of performance parameters: the required data profile gathered includes: power, speed, mass flow, gas turbine compressor (GTC) discharge pressure and temperature. The source of data historians were compressor operating maps from the proprietary software, machinery support centre and distribution control centre (DCS)2. The obtained historic data during the previous shutdown was evaluated and analyzed to build cases for simulation, considering the objective function, variables and constraints.3. The expected total amount of gas to save by improving compressor performance based on data historian was estimated.4. Simulation cases were run on CompSIM to predict effect of discharge pressure reduction on gas throughput.5. The estimated performance improvement result on compressor -01 and 02 while compressor-03 is down for turnaround maintenance was verified.6. Calculation of the actual gain in compression throughput from field test carried out during the turnaround maintenance work was done and compared with the isentropic efficiency.7. Performance improvement results and good conclusions were obtained.In order to address the objective function of reducing “Loss production Opportunities”, minimum discharge pressure, surge limit, choke limit were considered as constraints. Surge and choke limits were built into the CompSIM model while the base cases were built within the confine of the base case discharge pressure of 360 bar and the minimum discharge pressure of 345 bar required for gas injection (as determined by the reservoir pressure of which a discharge pressure below 345 bar would limit volume of gas injected and may cause a back pressure which can damage the compressors).Out of all the performance parameters, only discharge pressure was considered as the appropriate decision variable for improving the compressor performance due to its ease of control and its minimal impact on the process facilities upstream of the gas compressor. From the head formula in Equation 1, head is a function of discharge pressure and as a result, lowering the discharge pressure will lower the head. The following Table 1 lists the cases.Table 1. Cases at 23 MW of Available Power
 |
| |
|
Hand or spreadsheet calculations can be performed if gas properties are known, and will give operators a good idea of how well a machine is performing. Compressor head is presented as in equation 1 (Campbell, 1998).The following formulas (in SI Units) were adapted in the calculation spreadsheet to determine and compare the isentropic efficiencies of the cases as follows:Polytropic Head for a Centrifugal Compressor: whereHp = Polytropic HeadT1 = Suction TemperatureZavg = Average Compressibility Factor (z1 + z2)/2R = Universal Gas Constantn = Polytropic ExponentMW = Gas Molecular WeightP1 = Suction PressureP2 = Discharge pressureAbsorbed Power:
 where:Pw = Gas Powerṁ = Mass Flow RateHp = Polytropic Headηp = Polytropic EfficiencyPolytropic exponent, n:
 where:n = Polytropic Exponentk = Isentropic Exponentηp = Polytropic EfficiencyIsentropic efficiency, s:
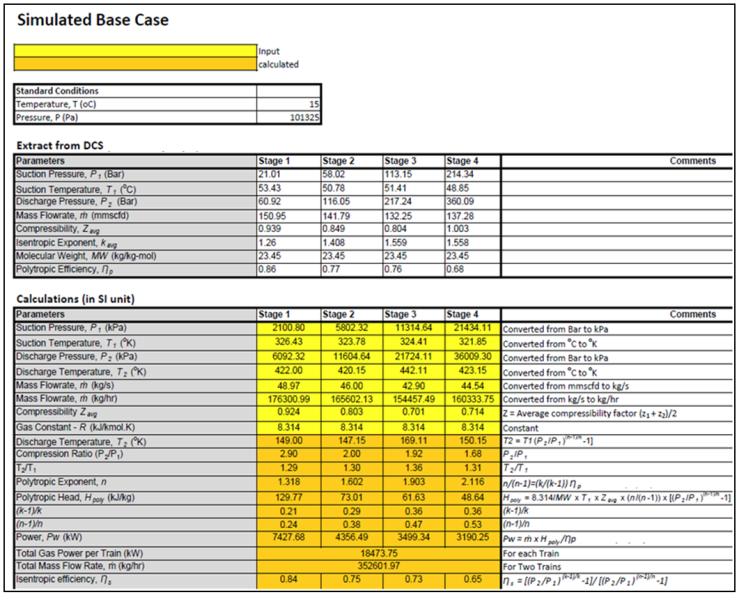
 A review of the compressor map and historic data establishes an approximate target gain 15.5% of the compressors throughput as an opportunity for performance improvement when two compressors are in operation. Discharge pressure was considered as the appropriate decision variable for improving the compressor performance due to its ease of control and its minimal impact on the process facilities upstream of the gas compressor. Therefore a step change of 5 bar at a time, up to 15bar (drop from 360 to 345 bar) of the suction pressure was simulated with prediction that 1bar change in pressure will gain about 0.633kg/s or 2278.8kg/hr of flow rate (2.0mmscfd) for the two compressors. CompSIM simulation software was used to model the compressors based on current set points and operation (see table 2). In order to validate the simulation result, a test was carried out during the shutdown of one out of three gas compressors for turnaround maintenance.
 | Table 2. Calculation for head, polytropic exponent, power and efficiency |
3. Results and Discussions
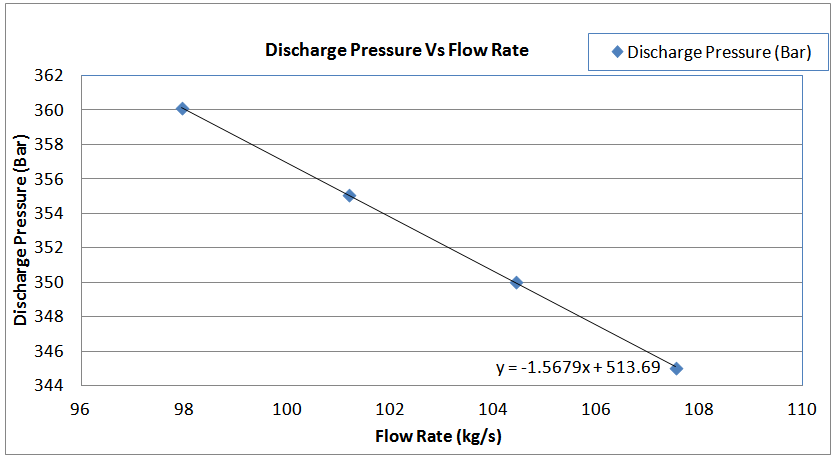
Table 3 shows the impact of GTC discharge pressure drop on mass flow when two compressors were operating. The graphical presentation is shown in figure 2.| Table 3. Effect of reducing discharge |
| | Cases | Injection Gas throughput (Kg/s) Due to Discharge pressure reduction | Discharge Pressure (Bar) | | Base case | 98 | 360 | | Case 1 | 101 | 355 | | Case 2 | 104 | 350 | | Case 3 | 108 | 345 |
|
|
 | Figure 2. Graph showing the effect of simulated discharge pressure reduction on flow rate |
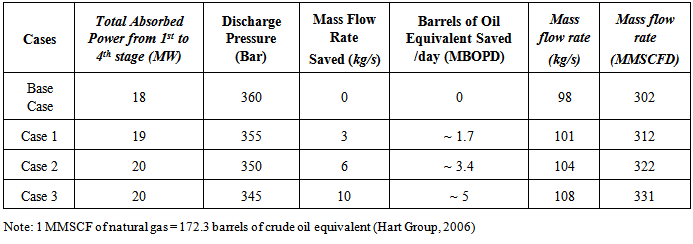
The governing equation for the graph is: Based on Figure 2 and the resultant straight line equation above, it implies that for every one step change in y (pressure), there will be a 0.634 (1 divided by 1.5679) step change in x (mass flow). That means 1bar change in pressure will gain about 0.634kg/s or 2282.4kg/hr of flow rate (2.0mmscfd) for the two compressors at suction conditions. If then we can drop 10bar, it means 6.34kg/s or 22824kg/hr (20mmscfd). The implication is that there is an opportunity to reduce LPO by 6.34 – 9.51kg/s (10 – 30mmscf/d) equivalent of 1.723 – 5.169 MBOPD at a pressure drop of 5 -15bar with two compressors. Note: 1 MMSCF of natural gas = 172.3 barrels of crude oil equivalent (Hart Group, 2006).Results of SimulationTable 4 is the result of the CompSIM steady state simulation that was carried out with a gain of about 10 kg/s at a discharge pressure of 345 bar.
Table 4. Simulation result from CompSIM
 |
| |
|
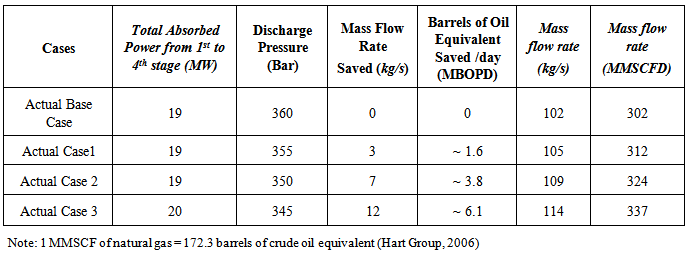
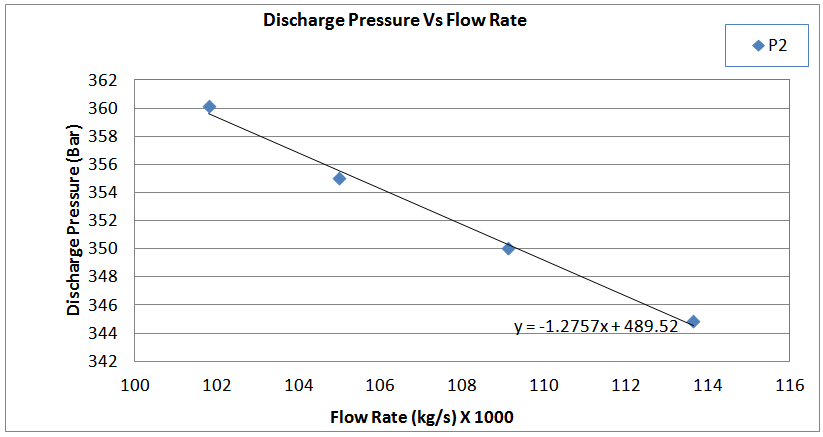
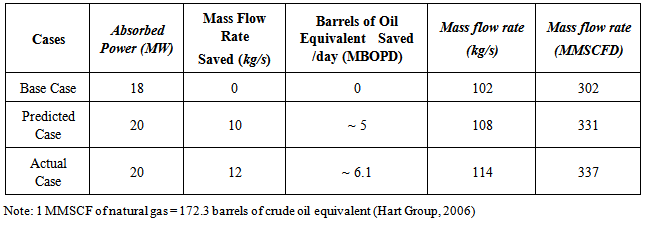
Actual Performance of the two Gas CompressorsIn order to validate the simulation result, a test was carried out during the shutdown of gas compressor-03 for turnaround maintenance while compressor-01 and 02 were still in operation. The results are as reported in Table 5. Actual Performance result of effect of discharge pressure on flow rate for the two compressors in operation compared with base case and Predicted case indicates an improvement in compressor throughput by 83% of the prediction. It was also observed that absorbed power increased by 2 MW from 18 MW of the base case to 20 MW of actual case.As seen in Table 5, the final case of total drop of 15bar of discharge pressure from 360 bar to 345 bar yielded a throughput of 114 kg/s with an additional compression of 12 kg/s. The relationship of the discharge pressure and the flow rate is as presented in the Figure 3 below. Table 5. Actual Performance result of effect of discharge pressure on flow rate for the two compressors in operation
 |
| |
|
 | Figure 3. Graph showing the effect of actual discharge pressure on flow rate |
The base case, predicted case and actual case were put side by side on Table 6 to examine deviation of actual case from the base and predicted cases.Table 6. Result comparison of flow rates of the actual case, base case and predicted case at discharge pressure of 345 bars with two compressors in operation
 |
| |
|
Effect of Compressor performance improvement effort on the Production FacilityThe effect of lowering the discharge pressure is such that less oil production is curtailed to carry out turnaround maintenance since more produced gas can be compressed at an additional rate of ~12 kg/s indicating an obvious increase in gas flow rate.Lowering the discharge pressure enables the Power Turbine speed to increase thus increasing the mass flow rate even at limiting environmental conditionsIncrease in Power Turbine Generator speed also improved the power utilization of the compressors.Gas compression performance comparisonComparison of flow rates with 3 compressors and 2 compressors at 360 bar and comparison of the Normal operation, Base Case, Predicted Case and Actual Caseis as tabulated below:Table 7. Performance comparison
 |
| |
|
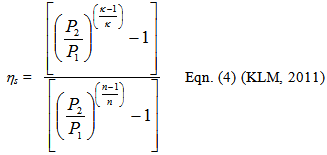
The reason why this compressor performance improvement effort cannot be applied to all three compressors in operation at this time is because the field produces oil and gas at a certain Gas/Oil Ration (GOR) and the three compressors are designed to adequately compress the produced gas. Since the 2 out of the 3 compressors cannot compress 100% of the produced gas, the 3 will always be put to use for load sharing with approximately 88% capacity utilization of each compressor. Therefore, the need to carry out this improved control with lower discharge pressure at normal operation is remote, unless during failure or Turnaround as in the case study.Isentropic Efficiency:In order to calculate the compressor efficiency of the cases, polytropic exponent was calculated based on the design polytropic efficiency using equation 3. Isentropic efficiency was calculated using equation 4. Figure 4 below shows a graph of pressure ratio against efficiency indicating improvement in isentropic efficiency as pressure ratio reduces.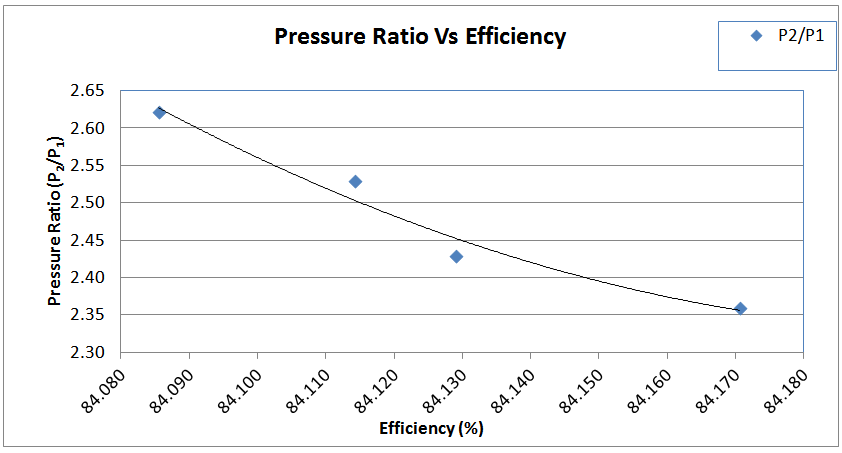 | Figure 4. Pressure Ratio Versus Isentropic Efficiency |
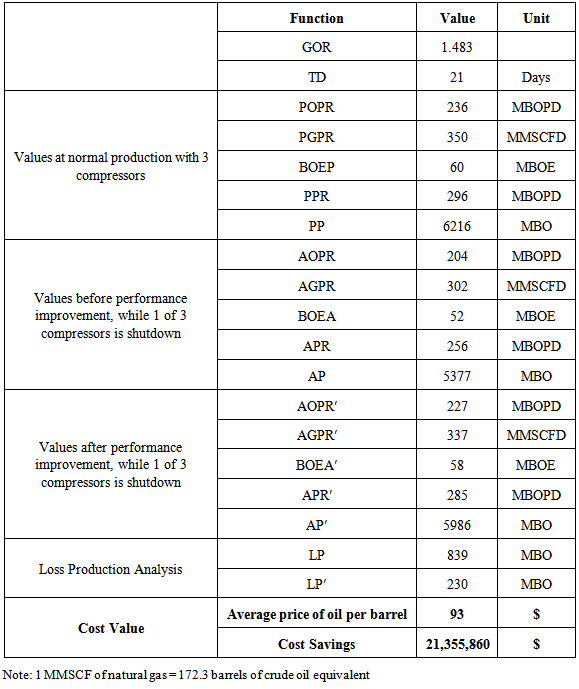
DeviationComparing results of actual flow rate with the predicted case yielded a percentage deviation of 81%.Plausible reasons for deviationsModel was based on designed gas density of 23.45 kg/kg-mol while the actual gas density was found to be 24.35 kg/kg-mol.Cost BenefitSince the aim of this paper is to minimize LPO which is the highest cost element from the list above, reference was made to the definition of Loss of Production by Berdahl (2011) as the difference between the potential production and the actual production. The cost benefits analysis is as shown below (table 8). The givens and actual data as gathered from the field were put into a spreadsheet to determine the cost benefits.Table 8. Deviation between estimated versus actual flow rate gained
 |
| |
|
Table 9. Cost Benefit Analysis
 |
| |
|
4. Conclusions
Increase in the centrifugal compressor mass throughput by approximately 0.634 kg/s (2 mmscf/d) per 1 bar drop in discharge pressure for the two gas compressors was observed, resulting in an actual LPO savings of about 11MBOPD. A graph of pressure ratio plotted against isentropic efficiency indicated an improvement in efficiency, as pressure ratio decreased. Available Power was 23MW while maximum consumed power at improved volumetric performance was 20MW. Decrease in polytropic head was observed at fixed suction pressure and decreasing discharge pressure. About 11MBOPD of loss production opportunity (LPO) was prevented. This translates to about 230MBO savings for the turnaround period of twenty one (21) days duration. At the rate of $93 per barrel of oil, about $21MM dollars was saved from. This improvement is in support of increase in Return On Investment (ROI) as LPO is reduced (Abraha, 2011).The study shows that there exist the potential of improving the performance of centrifugal compressors by reducing the discharge pressure with the objective of minimizing loss production opportunities in gas injection applications. This engineering principle of improving compressor throughput can also be engaged in planning for potential compression demand, as well as Prediction of performance improvement by correlating results of simulated discharge pressure reduction cases and the resultant flow rates in a graph, with the help of a straight line equation.
Nomenclature
AGPR - Actual gas production rate before performance improvementAGPR′ - Actual gas production rate after performance improvementAOPR – Actual oil production rate before performance improvementAOPR′ - Actual oil production rate after performance improvementAP′ - Actual production after performance improvementAP - Actual production before performance improvementAPR′ - Actual production rate after performance improvementAPR - Actual production rate before performance improvementBOEA – Barrels of oil equivalent of actual gas saved before performance improvementBOEA′ - Barrels of oil equivalent of actual gas saved after performance improvementBOEP – Barrels of oil equivalent of potential gas savedDCS - Distribution control centreDPR – Department of petroleum resourcesGOR – Gas oil ratioGTC – Gas turbine compressork - Isentropic exponentLP – Loss productionLP′ - Loss production after performance improvementLPO – Loss production opportunityMBOE – Million barrels of oil equivalentMBOPD – Million barrels of oil per dayMBO - Million barrels of oilMMSCF – Million standard cubic feetMMSCFD – Million standard cubic feet per dayn - Polytropic exponentp – PressurePGPR – Potential gas production ratePOPR – Potential oil production ratePP - Potential production in the turnaround windowPPR – Potential productionTD - Turnaround durationηs – Compressor isentropic efficiency
References
| [1] | Abraha, H.A. (2011). Optimization of Maintenance Performance for Offshore Production Facilities.Master Thesis, University of Stavanger. |
| [2] | Akhtar, M.S. (2006). Determining The Real Performance Of Centrifugal Compressors Operating In Oil & Gas Production Facilities. Middle East Conference, MSE (Consultants) Limited, Carshalton, Surrey UK. |
| [3] | Arnold, K., Maurice S. (1999). Production Operations, Design of Gas Handling Systems and Facilities, 2. Gulf Publishing Company, Houston TX. |
| [4] | Bendinelli P., Camatti M., Giachi M., Rossi E., (2001). Compressor Performance Dynamic in, Hanlon P.C. (ed), Compressor Handbook, McGraw-Hill, New York. 32. |
| [5] | Berdahl, I.L. (2011). ‘Turnaround Strategy Development’. Master Thesis, NTNU Department of Marine Systems, Norway. |
| [6] | Campbell J. M. (1998). Gas Conditioning And Processing. The Equipment Modules, 8th Edition. Robert A.H.,(ed) published by John Campbell and Company. |
| [7] | Golden S., Fulton S.A. and Hanson D.W. (2002). Understanding Centrifugal Compressor Performance in a Connected Process System. Process Consulting Services Inc., Houston, Texas. |
| [8] | Hansen C. (2008). Dynamic Simulation of Compressor Control Systems. M.Sc. Thesis, Aalborg University Esbjerg. |
| [9] | Hart Group (2006). ‘Nigerian Extraction Industries Transparency Initiative – Report on the Process Audit 1999-2004, Refineries And Product Importationin association with Chris Morgan (CMAL) Associate ltd. http://neiti.org.ng/sites/default/files/documents/uploads/appjconversionfactors.pdf. |
| [10] | Hassan, E.A., Hassan F.M., Karima I.A. (2009). Optimizing Compressor Operations in an LNG Plant. Proceedings of the 1st Annual Gas Processing Symposium, Retrieved from http://www.nt.ntnu.no/users/skoge/ prost/proceedings/gas-processing-doha-2009/fscommand/d06. |
| [11] | KLM (2011). ‘Technology Group, Malaysia, Process Design of Compressors’ Rev:01 Retrieved from http://kolmetz.com/pdf/ess/project_standards_and_specifications_compresser_systems_Rev01.pdf |
| [12] | Kurz, R., Winkelmann, B., Mokhatab, Saeid (2010). ‘Efficiency and operating characteristics of centrifugal and reciprocating compressors.’Pipeline & Gas Journal.Oildom Publishing Company of Texas, Inc. 2010. HighBeam Research. Vol. 237, 10. |


 whereHp = Polytropic HeadT1 = Suction TemperatureZavg = Average Compressibility Factor (z1 + z2)/2R = Universal Gas Constantn = Polytropic ExponentMW = Gas Molecular WeightP1 = Suction PressureP2 = Discharge pressureAbsorbed Power:
 where:Pw = Gas Powerṁ = Mass Flow RateHp = Polytropic Headηp = Polytropic EfficiencyPolytropic exponent, n:
 where:n = Polytropic Exponentk = Isentropic Exponentηp = Polytropic EfficiencyIsentropic efficiency, s:
 A review of the compressor map and historic data establishes an approximate target gain 15.5% of the compressors throughput as an opportunity for performance improvement when two compressors are in operation. Discharge pressure was considered as the appropriate decision variable for improving the compressor performance due to its ease of control and its minimal impact on the process facilities upstream of the gas compressor. Therefore a step change of 5 bar at a time, up to 15bar (drop from 360 to 345 bar) of the suction pressure was simulated with prediction that 1bar change in pressure will gain about 0.633kg/s or 2278.8kg/hr of flow rate (2.0mmscfd) for the two compressors. CompSIM simulation software was used to model the compressors based on current set points and operation (see table 2). In order to validate the simulation result, a test was carried out during the shutdown of one out of three gas compressors for turnaround maintenance.

 Based on Figure 2 and the resultant straight line equation above, it implies that for every one step change in y (pressure), there will be a 0.634 (1 divided by 1.5679) step change in x (mass flow). That means 1bar change in pressure will gain about 0.634kg/s or 2282.4kg/hr of flow rate (2.0mmscfd) for the two compressors at suction conditions. If then we can drop 10bar, it means 6.34kg/s or 22824kg/hr (20mmscfd). The implication is that there is an opportunity to reduce LPO by 6.34 – 9.51kg/s (10 – 30mmscf/d) equivalent of 1.723 – 5.169 MBOPD at a pressure drop of 5 -15bar with two compressors. Note: 1 MMSCF of natural gas = 172.3 barrels of crude oil equivalent (Hart Group, 2006).Results of SimulationTable 4 is the result of the CompSIM steady state simulation that was carried out with a gain of about 10 kg/s at a discharge pressure of 345 bar.

 Abstract
 Reference
 Full-Text PDF
 Full-text HTML


