Igor Vilček 1, Jozef Kováč 2, Jaroslava Janeková 2
1The Institute of Technology and Business in České Budějovice, Czech Republic
2Faculty of Mechanical Engineering, Technical University of Kosice, Kosice, Slovakia
Correspondence to: Jaroslava Janeková , Faculty of Mechanical Engineering, Technical University of Kosice, Kosice, Slovakia.
| Email: |  |
Copyright © 2012 Scientific & Academic Publishing. All Rights Reserved.
Abstract
Requirements for flexible manufacturing have been increasing in the last years. In order to insure effective operation of expansive manufacturing equipment, which has to run automatically and unattended, tool monitoring is important. Therefore, the essential problem to be overcome to achieve the full potential of unmanned machining is the development of effective and reliable sensors system to monitor the process and corrective actions in case abnormal operation. The ultimate goal of the development of such production equipment is to enhance the overall economic of the manufacturing process. Even when there are at present many monitoring systems commercially available in the market for turning processes, serious difficulties still remain to be solved to apply monitoring systems successfully in machining centres. Being these difficulties mainly related with the limited accessibility to the rotating tool for sensing purposes in tool driven machining processes. Therefore, the primary objective of this paper assess the feasibility of using force signal analysis as means for monitoring tool condition in drilling
Keywords:
Failure Prediction, Monitoring, Drilling, Cutting Forces, Manufacturing, Coherence Function
Cite this paper:
Igor Vilček , Jozef Kováč , Jaroslava Janeková , "Failure Prediction by Means of Cepstral Analysis and Coherence Function between Thrust Force and Torque Signals", Journal of Mechanical Engineering and Automation, Vol. 2 No. 6, 2012, pp. 108-113. doi: 10.5923/j.jmea.20120206.01.
1. Introduction
After consulting the available literature it is obvious, that only some features of static force component are proposed for drill wear monitoring. The really important task in such roughing drilling operations is to avoid catastrophic failure. It is desirable to make the most of the economic use of the cutting tool without reaching catastrophic failure. Traditionally, the usual approach to tool condition monitoring in drilling was to detect breakage as fast as possible and avoid overloads in the machine tool. These strategies are not enough to ensure the optimum economic performance of the machining process.With increasing wear in the twist drill margin wear causes the increase of the frictional forces between the margin and machined holes wall and leads to torsion vibrations in the cutting tool. This in turn will cause further tool wear and vibrations. If the cyclic process continues - catastrophic failure will occur at a short time. At the moment when these torsion vibrations appear, it is the appropriate time for drill bit change, since from this point on, wear increases rapidly due to the phenomenon of torsion vibrations.Quante et al.[9] recognized the importance of sensing vibrations in the twist drill for wear monitoring as a mean to overcome the difficulties of the slight sensitivity of the static component of the thrust force to wear. They proposed the use of the distance sensor without contact measuring deflections of the drill in a plane normal to the drill axis. A synchronization device was attached to the spindle emitting 256 pulses per revolution. The signal of the distance sensor was high pass filtered at 60 Hz to avoid the effect of the spindle speed frequency at 12 Hz. An increase ranging 5 to 8 times in the signal for a worn drill with respect to the initial value when sharp was reported. The advantage of the system is that since it senses without contact at the tool shank, as was the case with the eddy current torque sensors proposed by Brinksmeier[1], it can be applied to almost any existing machine tool without structural changes. The sensors are expensive and do not interfere with machining process.El-Wardany et al.[2] presented a study on monitoring tool wear and failure in drilling using vibration signature analysis techniques. Discriminate features sensitive to tool wear and breakage were developed in both in time and frequency domain. In the time domain a monitoring feature based on calculating the kurtosis value of both the transverse and thrust vibration for on line detection of drill breakage was reported. This paper presented Failure prediction for drilling small diameters.
2. Experimental Set-up
A series of drilling experiments were carried out on a FV 25 CNC A that is a vertical console milling machine equipped with continuous control, used for milling operations, drilling, finishing thread cutting and more technological operations. Control system is extended by Heidenhain company. Experiments were performed using carbide twist drill bits of diameters 1.5 mm, 2.2 mm, 2.8 mm and 4.5 mm. The work materials are X4CrNiMo16-5 and AK1Ni a disk of 100 mm in diameter and 20 mm in thickness. Thrust force and torque generated by the drilling process were measured by means of a Kistler four-component piezoelectric dynamometer type 9272. The signals were amplified by charge amplifiers Vibrometer AG type T A-3/C with two individual channels. The amplified signals were sampled using a data acquisition card on the hard disk of the computer for further analysis. The schematic diagram of the experimental setup is shown Figure 1. 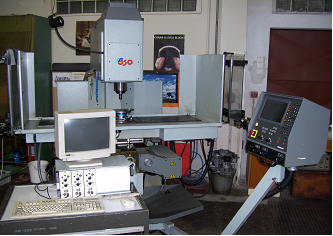 | Figure 1. Experimental system set – up[12] |
3. Software Used for Experiments
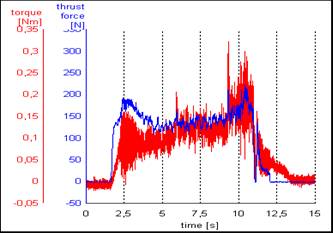 | Figure 2. Experimental data extracted from program “Editace”[12] |
For data acquisition the software Matlab with Real Time Toolbox was used in order to sample cutting force signals from dynamometer. The sampled data were saved on the hard disk of the computer for further processing and analysis. For the analysis a program called “Editace” was used (Figure 2). This program is based on Matlab and is able to import the sampled data. It was used for the first time at the Czech Technical University in Prague by Mr. Vilcek, Madl and Novak[9],[11].The measured signal can be displayed and edited, unwanted parts of the signal can be deleted, and zero can be adjusted. It is possible to compute basic statistical parameters of the selected part of the signal and also to perform regression analysis and fit a curve. The advantage of this program is that it is very user friendly and easy to work with.
4. Failure Prediction by Means of Cepstral Analysis
Harmonics of the basic rotational frequency in fact dominates the spectrum when instability prior to failure is reached. The stronger the unstable wear phenomenon the larger the effect of harmonics. This can be early observed in the power spectral density plots for the both torque signals. Therefore, an effective strategy for twist drill failure prediction would be to detect the occurrence of harmonics and to determine them by cepstral analysis. The cepstrum, strictly speaking power cepstrum, was defined as the power spectrum of the logarithm of the power spectrum[9]. If the forward Fourier transform of a time function fx(t) is denoted by: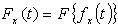 | (1) |
then, the power spectrum may be represented by: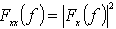 | (2) |
and cepstrum: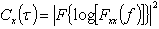 | (3) |
The independent variable τ of the cepstrum is called Quefrency, though it has the dimensions of time. The characteristic feature of the cepstrum is its ability to detect and give a measure of phenomena which exhibits periodicity in the spectrum, such as harmonics. In particular, in complex signals containing a mixture of different families of harmonics, the separation of the various periodicities is greatly facilitated by performing the second Fourier transform to obtain the cepstrum. A point about which different opinions exist is whether the second Fourier transform should be forward or inverse transform. But in fact it is not important, since the result is identical except for a scaling factor. In case an inverse Fourier transform is used, for the sake of consistency, the cepstrum is represented by: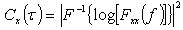 | (4) |
It can be noticed that as the unstable phase begins and harmonics arise, peak in the cepstrum appears at a quefrency of 50 msec. The stronger the intensity of the instability generated by the catch and release wear mechanism, the larger the peak in the cepstrum plot. This peak at a quefrency of 50 msec. Represents a fluctuation in the spectrum characterised by large number of harmonics components with a spacing equal 1/60 msec = 16.6 Hz.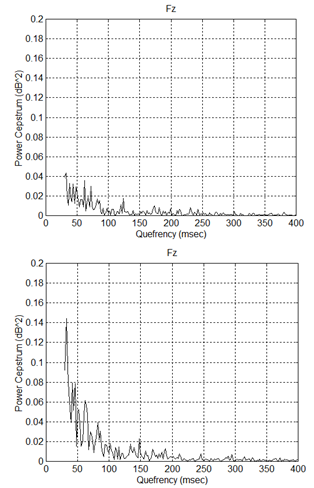 | Figure 3. Power cepstrum of thrust force for the first hole (up) and for the last hole before failure (down) for diameter 4.5 mm |
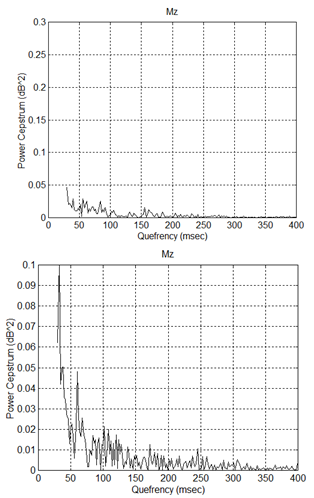 | Figure 4. Power cepstrum of torque signal for the first hole (up) and for the last hole before failure (down) for diameter 4.5 mm |
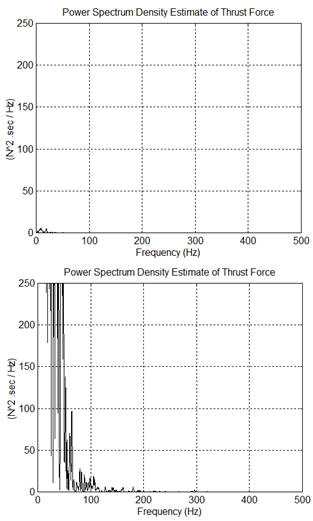 | Figure 5. Power spectrum density estimate of thrust force for the first hole (up) and for the last hole before failure (down) for diameter 4.5 mm |
Evaluation of the power cepstrum of thrust force and power cepstrum of torque signal (Figures 3 and 4) as well as power spectrum density of thrust force and power spectrum density of torque signal (Figures 5 and 6) was carried out for 4.5 mm diameter drill Poldi HSS CSN 22 1121 from steel Gr. 1043 ASTM A510. The experiment was carried out the way when the holes were drilled one after another in series (each series had 5 holes), the time interval between each drilled hole was 20 seconds. Each figure contains two graphs, the first shows the start of the machining process, and the second the moment before the tool destruction.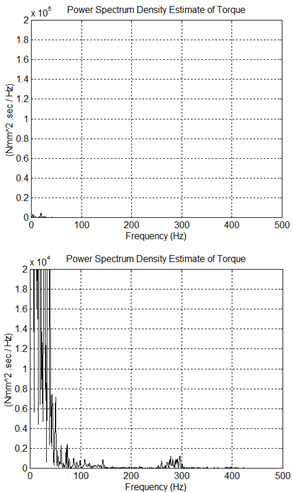 | Figure 6. Power spectrum density estimate of torque signal for the first hole (up) and for the last hole before failure (down) for diameter 4.5 mm |
5. Failure Prediction by Means Coherence Function between Thrust Force and Torque Signals
There is approach presented for catastrophic failure prediction, based on the detection of that specific wear mechanism that has been mentioned before, which occurs in the third stage of tool life, called stage of final accelerated wear. The coherence function indicates the extent to which two signals are correlated with each other. In other words, it could be said that the coherence function gives a measure of the validity of the assumption that both signals results from the same particular generating mechanism or source. The coherence function γxy (f) is defined by: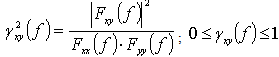 | (5) |
where: Fxy(f) and Fyy(f) are the power spectra of each signal, also called often autospectra and Fxy(f) is the cross spectrum. The cross spectrum Fyy(f) of fx(t) and fy(t) is the forward Fourier transform of the cross correlation function Rxy(τ), which is, in turn, defined by the equation: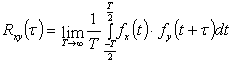 | (6) |
and gives a measure of the extent to which two signals correlate with each other as a function of the time displacement between them. The cross spectrum can alternatively be obtained from the individual Fourier spectra Fx(f) and Fy(f) as follows: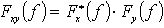 | (7) |
where: Fx*(f) is the complex conjugate of Fx(f).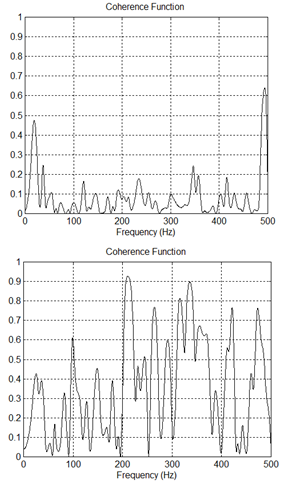 | Figure 7. The course of coherence function during the first hole (up) and during drilling the last hole before the destruction of the tool (down) |
Therefore, three cases are possible. The coherence function can be zero, one or greater than zero and less than the unity. In case γxy2(f)=0 for all frequencies both signals are completely uncorrelated. In case γxy2(f)=1 for all frequencies both signals are completely correlated. If γxy2(f) is between zero and one for all frequencies one or more of the following conditions exist:a) even when both signals y(t) and x(t) are caused partially by the same phenomenon or generating source, each is also caused in part by the other phenomena which affect it individually but does not affect the other signal,b) extraneous noise is present in the measurements,c) bias errors are spectral estimation.A method is presented for prediction of catastrophic failure in drilling, based on the detection of a specific wear mechanism operating at the end of tool life when severe wear is present and leading unavoidably to catastrophic failure.Example of a Coherence function, during the first hole (up) and during drilling the last hole before the destruction of the tool (down) for 4.5 mm diameter, is shown in Figure 7.
6. Wear Mechanism at the End of Drilling Life
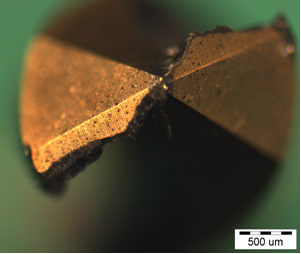 | Figure 8. Example of the drill destruction of machined material X4CrNiMo16-5[12] |
With increasing wear in the twist drill margin wear causes the increase of the frictional forces between the margin and machined hole wall and lead to torsional vibrations in the cutting tool. This in turn cause further tool wear and vibrations. If the cyclic process continues catastrophic failure will be short time. At the moment when these torsional vibrations appear, it is the appropriate time for drill bit change, since from this point on, wear increases rapidly due to the phenomenon of torsional vibrations.
7. Conclusions
A method is presented for prediction of catastrophic failure in drilling, based on the detection of a specific wear mechanism operating at the end of tool life when severe wear is present and leading unavoidably to catastrophic failure. The basic characteristic of this wear mechanism is that it excites highly torsional vibrations of the cutting tool. The proposed method relies in detecting the rise of harmonics in the spectrum of torque signal when the wear mechanism begins to operate by means of the cepstral analysis.Contribution of the work is the proposal to prevent the destruction of twist drills with small diameters in the machining process. Proposed method of vibration measurement tools is for small diameter drills. Designing a program in the Matlab for monitoring power spectrum density estimate of thrust force and torque. Detailed mapping of wear drills with small diameters and their behaviour in the machining process. Based on the research we recommend monitoring tools to use miniature piezoelectric force sensor in the system of machine tool – work piece.
References
| [1] | E. O. Brinksmeier, Prediction of tool fracture in drilling, Annals of the CIRP, 1990, Vol. 39, No. I, pp. 97-100. |
| [2] | R. R. EI-Wardany, D. Gao and M. A. Elbestawi, Tool condition monitoring in drilling using vibration signals analysis, International Journal of Machine Tools and Manufacture, 1996, Vol. 36, No.6, pp. 687-711. |
| [3] | C. Y. Jiang, Y. Z. Zhang and H. J. Xu, In-Process Monitoring of Tool Wear Stage by the Frequency Band-Energy Method, Annals of the CIRP, 1987, Vol. 36, No. 1, pp. 45-48. |
| [4] | W. König, K. Kutzner and U. Schehl, Tool Monitoring of Small Drills with Acoustic Emission, International Journal of Machine Tools and Manufacture, 1992, Vol.32, No.4, pp. 487-493. |
| [5] | L. C. Lee, K. S. Lee and C. S. Gan, On the Correlation Between Dynamic Cutting Force and Tool Wear, International Journal of Machine Tools and Manufacture, 1992, Vol.29, No.3, pp. 295-303. |
| [6] | J. Mádl and L. Tesner, Tool Wear Monitoring in Machining, In. International Congress of Machine Tools, Automation and Robotics in Mechanical Engineering, Praha 25. – 26. 6. 1996, pp. 169-175. |
| [7] | J. Mádl, New Aspects in Monitoring and Control of Machining Processes, Eight World Congress on the Theory of Machines and Mechanisms, August 26-31, 1991, Prague, Czechoslovakia, pp. 247-249. |
| [8] | P. Novák and J. Mádl, Effective evaluation of measured dynamic values of cutting forces and torques, Manufacturing Technology, 2001. ISSN 112386. |
| [9] | F. Quante, H. Fehrnbach and H. E. Meir, Automathische iiberwachung rotierender werkzeuge mit abstands - und schwingungssensoren in der spanabhebenden fertigung, Technisches Messen, 1983, 50. Jahrgangn, Heft 10, pp. 367-371. |
| [10] | R. B. Randall, Application of B & K equipment to frequency analysis, Bruiel and Kjaer Information, 1977, Denmark. |
| [11] | I. Vilček and J. Mádl, Monitoring Tool Conditions for Drilling, In: Proceedings of the 12th International Conference on Flexible Automation & Intelligent Manufacturing. München: Oldenbourg, Wissenschaftsverlag, 2002, pp. 295-300. ISBN 3-486-27036-2. |
| [12] | I. Vilček, J. Kováč and J. Janeková, Failure prediction by means of cepstral analysis and coherence function between thrust force and torque signals, In: IEEE International Symposium on Assembly and Manufacturing: Proceedings: 25th-27th of May 2011, Tampere, Finland. pp. 1-4. ISBN 978-1-61284-343-8. |
 Abstract
 Reference
 Full-Text PDF
 Full-Text HTML