-
Paper Information
- Next Paper
- Previous Paper
- Paper Submission
-
Journal Information
- About This Journal
- Editorial Board
- Current Issue
- Archive
- Author Guidelines
- Contact Us
Journal of Mechanical Engineering and Automation
p-ISSN: 2163-2405 e-ISSN: 2163-2413
2012; 2(4): 74-79
doi: 10.5923/j.jmea.20120204.04
Modeling the Effects of Tool Probe Geometries and Process Parameters on Friction Stirred Aluminium Welds
 Abstract
 Reference
 Full-Text PDF
 Full-Text HTML
H. K. Mohanty 1, D. Venkateswarlu 1, M. M. Mahapatra 1, Pradeep Kumar 1, N. R. Mandal 2
1Mechanical and Industrial Engineering Department, IIT Roorkee, Roorkee, 247 667, India
2Department of Ocean Engineering & Naval Architecture, IIT Kharagpur, Kharagpur, 721 302, India
Correspondence to: M. M. Mahapatra , Mechanical and Industrial Engineering Department, IIT Roorkee, Roorkee, 247 667, India.
| Email: |  |
Copyright © 2012 Scientific & Academic Publishing. All Rights Reserved.
The weld properties of friction stir welding remains as an area of interest with respect to the effect of tool geometry and process parameters. In the present investigation effort has been made to understand the effect of important welding parameters such as tool rotational speed, traverse speed and probe geometries on various mechanical properties of AA1100 aluminium alloys. Ultimate tensile strength, percentage of elongation and hardness were determined experimentally for this purpose. Analysis of variance (ANOVA) was used to observe the main effect of above mentioned parameters on mechanical properties. A regression relationships were developed to predict each output. The experimental and predicted values from the mathematical model were in close agreement.
Keywords: Friction Stir Welding, Regression Analysis, Tool Designs
Article Outline
1. Introduction
- Friction stir welding (FSW) is a solid-state joining process which welds the materials whose characteristics almost remain unchanged as far as possible. Difficult to weld and weldable alloys can be joined by this process without melting and recasting[1]. Welding defects such as porosity and hot cracking are not an issue in FSW and joints with low residual stresses, improved dimensional stability, good mechanical properties and high surface finish are produced. During FSW processing, a non consumable tool attached with a desired designed pin is inserted to butting edge of the plates to be joined. Tool shoulder touches the plate surface with vertical pressure. Under this condition the tool is rotated and traversed along bond line. Frictional heat is generated, material gets softened locally and plastic deformation of the work piece occurs. Tool rotation and translation expedite material flow from front to back of the pin and welded joint is produced[2]. It is essentially a thermo-mechanical process during which the temperature of the material is taken to a range where it can be plastically deformed to yield a fine-grained structure. The heat input to the material depends on the FSW tool geometry and parameters. Many studies conducted on FSW of aluminium alloys show that a number of process parameters can affect the welding conditions and the weld properties[3]. In several studies the influence of stirrer design on the welding process was also investigated. For thispurpose, five different stirrers, one of them square cross-sectioned and the rest were cylindrical with different screw pitched were used to carry out welding process[4]. Microscopic examination of the weld zone and the tension test results showed that the best bonding was obtained with 0.85 mm screw pitched stirrer. The quality of a FSW joint is also affected by tool geometry: in particular the diameter and the shape of the pin as well as the shoulder surface. They strongly influence both metal flow and heat generation[5].Moreover, both rotation speed and feed rate have to be appropriately chosen in order to obtain effective joints[6]. The effects of welding parameters, tool geometry and position of the pin axes were investigated by researchers[7-10] in to obtain high quality welds. A lot of efforts have been undertaken towards understanding the effect of process parameters on the material flow behavior, micr structure formation and hence mechanical properties of friction stir welded joints. Finding the most effective parameters of friction stir welds, as well as realizing their influence on the weld properties is still have been major topics for researchers. The influence of some of these important parameters such as the rotational speed and the traverse speed on weld properties were investigated by Elangovan and Balasubramanian[11]. Blignault et al. considered optimization procedures for friction stir welding (FSW) in 5083-H321 aluminum alloy, via control of weld process parameters and tool design modifications[12]. They used ‘‘force footprint’’ (FF) diagram in providing a real-time graphical user interface (GUI) for process optimization of FSW. Desirability profile charts were presented, which showed the influence of seven key combinations of weld process variables on tensile strength[12]. The friction stir welding process and tool parameters were optimized by Rajakumar and Balasubramanian using multi-response optimization technique to obtain the maximum strength and minimum corrosion rate of FS welded AA1100 aluminium alloy[14].They observed that rotational speed is more sensitive than other parameters followed by axial force, welding speed, shoulder diameter, pin diameter, and tool material hardness[14]. Vijayan et al. reported the optimization of FSW process parameters for AA5083 aluminum alloy with multiple responses based on orthogonal array with gray relational analysis[17]. The authors found the optimum levels of the process parameters to attain maximum tensile strength and minimum power consumption[17]. In spite of these achievements the combined effect of probe geometry and processes parameter on mechanical properties on friction stir welded AA1100 aluminium alloy has not yet been systematically classified. In this present investigation an attempt has been made to find out the key parameters (probe geometry, process parameter) that affect the tensile strength, percentage of elongation, nugget grain size and nugget hardness most, and also to develop a mathematical model to establish the correlation between factors and responses such as tensile strength, percentage of elongation and nugget hardness of friction stir welded AA1100 aluminium alloy joint by using design of experiment, analysis of variance and regression analysis.
2. Experimental Details
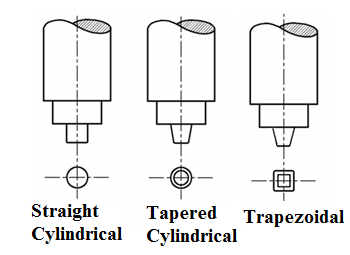 | Figure 1. The schematic of tool geometries |
2.1. Investigation Plan
- This investigation was planned to be carried out in following steps(i) Identifying the important process parameter and finding the range of process parameter such as tool rotational speed and welding speed .(ii) Developing of design matrix and conducting the experiments as per the design matrix.(iii) Collection of experimental data.(iv)Regression analysis (Developing mathematical model and checking the adequacy)(v) Conformity test.(vi)Analysis of the results (Effect of control factors on responses).The important processes parameters (rotational speed, welding speed) and tool probe geometry were identified based on series of trials and author’s earlier study[18]. Tools with different probe geometries, trial experiment runs were conducted to select the range of feasible process parameters such a way that the friction stirred welded joint should be free from any visible external defect. The selected process parameters with their levels are given in Table 4. The experiment was based on three factors with three levels of full factorial experimental design. The developed design matrix is shown in Table 5. As prescribed in the experimental design matrix twenty seven joints were carried out using previously described tools having three different probe geometry by varying three levels of process parameter, namely tool rotational speed and welding speed as given in the Table 4. It is to be further noted that the experiments were conducted with a constant axial load of 3.5 KN.
|
|
|
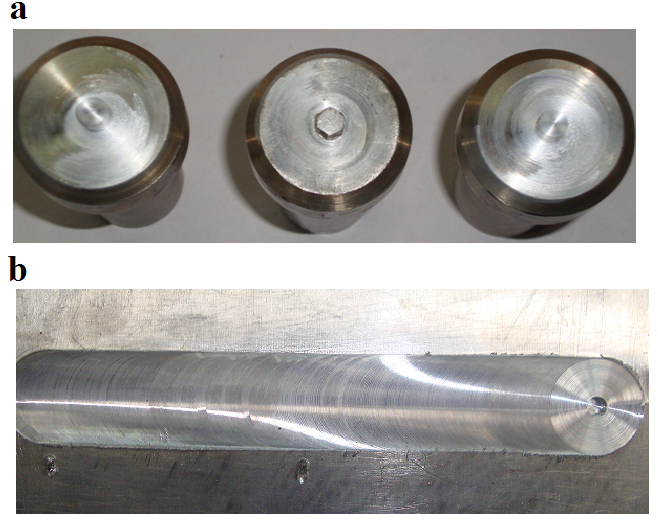 | Figure 2. (a) Three types of tools and, (b) FS butt welds produced |
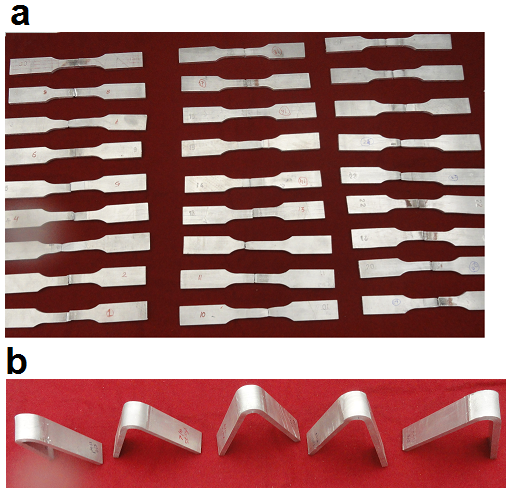 | Figure 3. (a) Tested tensile sample, (b) bend test samples |
3. Response Surface Modeling
- The process window created using the DOE approach resulted 27 experimental inputs as shown in Table 5. These experiments were conducted and three outputs such as weld strength, % elongation and nugget hardness were used for the response surface regression modeling using MINITAB[13].
|
3.1. Regression Analysis
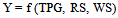
- The response (Y) such as tensile strength (TS), percentage of elongation (EL) and weld nugget hardness (WHN) of the joints are functions of tool probe geometry(TPG), rotational speed (RS) and welding speed (WS) and it can be expressed as
 | (1) |
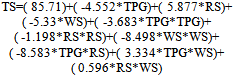 | (2) |
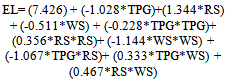 | (3) |
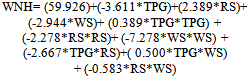 | (4) |
| |||||||||||||||||||||||||||||||||||||||||||||||||||||||||||
| |||||||||||||||||||||||||||||||||||||||||||||||||||||||||||
| |||||||||||||||||||||||||||||||||||||||||||||||||||||||||||
3.2. Conformity test
- Experiments were conducted to verify the regression equations( 2),(3)and (4).Six joints were fabricated, two out of each tool probe using different values of rotational speed and welding speed other than what were used in the design matrix (Table 5). The details of test result are presented in Table 9, which indicate that the experimental and predicted values are in good agreement.
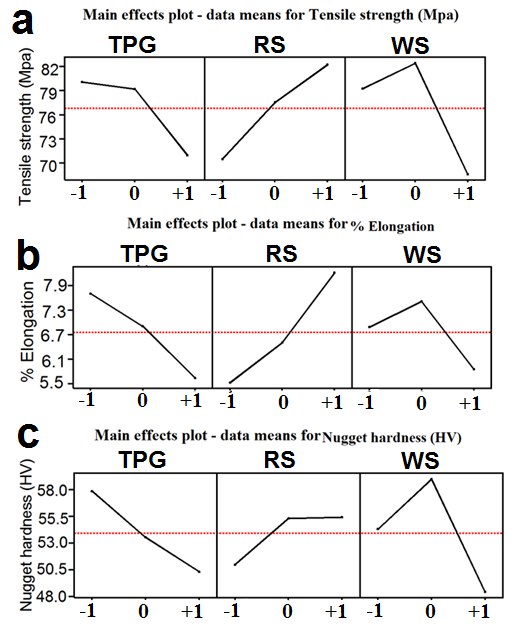 | Figure 4. Main effect plots for (a) Ultimate tensile strength; (b) % Elongation; (c) Nugget hardness |
| |||||||||||||||||||||||||||||||||||||||||||||||||||||||||||||||||||||||||||||||||||||||||||||||||||||||||||
3.3. Analysis of the results
- The main effect plots for the control factors and the responses were also plotted and analyzed. Figure 4 (a), (b) and (c) indicate the main effects plot for tensile strength, percentage of elongation and nugget hardness. The following observations can be made from the above Figure 4. (i) Welding speed has got significant effect on tensile strength followed by rotational speed and probe geometry. (ii) Tensile strength increases with increasing welding speed up to certain point and there after it decreases. Similar trends were also observed for percentage of elongation and nugget hardness. Straight cylindrical probe produces maximum weld strength, percentage of elongation and nugget hardness. As the heat generation in FSW process is thermo mechanical[19], therefore the mechanical action due to processes parameter and probe geometry significantly affects the mechanical and metallurgical properties of weld. Heat generated due to friction is mainly due to rotation of tool and the welding speed is responsible for the quantity of heat supplied to the base material to be welded subsequently rate of cooling[19].
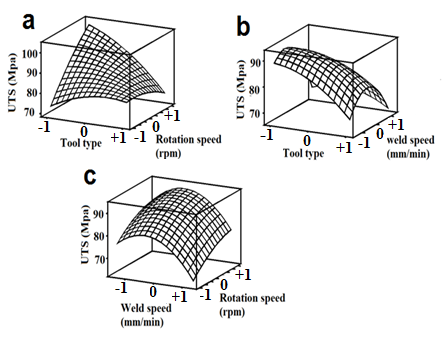 | Figure 5. Surface response plots for ultimate tensile strength |
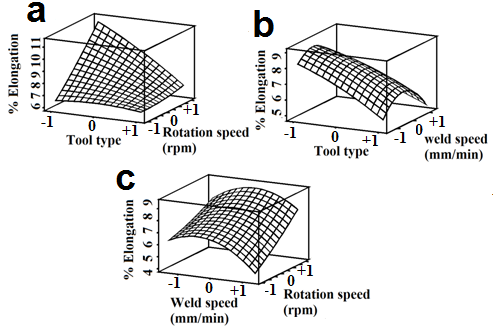 | Figure 6. Surface response plots for % Elongation of welds during tensile testing |
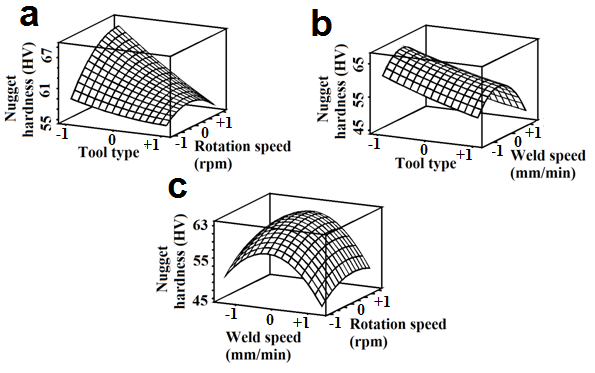 | Figure 7. Surface response plots for nugget hardness of welds |
4. Conclusions
- The following conclusion can be arrived from the present investigation.1. The tensile strength, percentage of elongation and nugget hardness increase with increasing welding speed up to a certain range thereafter decrease.2. Neither low heat input nor high heat input is preferred to achieve superior weld quality.3. Ductility of FSW joint very much depends upon the rotational velocity of tool as compared to welding speed.4. Tool probe geometry is very much responsible for deciding the weld quality..5. The relationships between tool probe geometry and process parameters for FS welding of AA1100 aluminum alloy have been established. The response surface methodology was adopted to develop the regression models, which were checked for their adequacy using ANOVA test and found to be satisfactory.
ACKNOWLEDGEMENTS
- The work has been supported by the Department of Scientific and Industrial Research (DSIR), India. The authors are grateful to DSIR for funding the work under TePP. The authors also thank Department of Ocean Engineering & Naval Architecture, IIT Kharagpur for extending the experimental facilities at the welding laboratory.
References
| [1] | Shinoda T (2001). Recent development of friction stir welding - newSolid-state joining technology. Int. J. Mater. Prod. Technol., 2: 453–460 |
| [2] | Ma ZY. Friction stir processing technology: a review. Metall Mater Trans A 2008;39A:642–58 |
| [3] | L. Dubourg, F. O. Gagnon, F. Nadeau, L. St-Georges, M. Jahazi. Process window optimization for FSW of thin and thick sheet Al alloys using statistical methods. In 6th Int. Symp. on FSW, 2006 |
| [4] | Mustafa Boz , Adem Kurt. The influence of stirrer geometry on bonding and mechanical properties in friction stir welding process. Materials and Design 25 (2004) 343–347 |
| [5] | Liu, F. C. and Ma, Z. Y. Influence of tool dimension and welding parameters on microstructure and mechanical properties of friction-stir-welded 6061-T651 aluminum alloy. Metall. Mater. Trans. A, Phys. Metall. Mater. Sci., 2008, 39, 2378–2388. |
| [6] | Fujii, H., Cui, L., Maeda, M., and Nogi, K. Effect of tool shape on mechanical and microstructure of friction stir welded aluminum alloy. Mater. Sci.Engng A, Struct. Mater., Prop. Microstruct. Process., 2006, 419, 25–31. |
| [7] | A. K. Lakshminarayanan and V. Balasubramanian. Process parameters optimization for friction stir welding of RDE-40 aluminium alloy using Taguchi technique. Trans. Nonferrous Met. Soc. China18:548-554,2008. |
| [8] | G. Buffa, J. Hua, R. Shivpuri and L. Fratini. Design of the friction stir welding tool using the continuum based FEM model. Material Schience and Engineering A, 419:381-388, 2006. |
| [9] | T. Nishihara. Development of simplified FSW tool. In 6thInternational Symposium on FSW, 2006. |
| [10] | G. Buffa, L. Fratini, S. Pasta and R. Shivpuri. On the thermo-mechanical loads and the resultant residual stresses in fiction stir processingoperations. InCIRP Annals - Manufacturing Technology 57:287-290, 2008. |
| [11] | K. Elangovan and V. Balasubramanian, Influences of pin profile and rotational speed of the tool on the formation of friction stir processing zone in AA2219 aluminium alloy, Journal of Materials Science and Engineering A, 459 (2007) 7–18. |
| [12] | C. Blignault, D.G. Hattingh, and M.N. James. Optimizing Friction Stir Welding via Statistical Design of Tool Geometry and Process Parameters , Journal of Materials Engineering and Performance DOI: 10.1007/s11665-011-9984-2 |
| [13] | Minitab Inc, User manual of MINITAB statistical software, Release 13.31, State College,PA 16801 USA, 2000. |
| [14] | S. Rajakumar and V. Balasubramanian. Multi-Response Optimization of Friction-Stir-Welded AA1100 Aluminum Alloy Joints , Journal of Materials Engineering and Performance Journal of Materials Engineering and Performance. DOI: 10.1007/s11665-011-9979-z |
| [15] | Mathews, P. G. Design and analysis of experimentswith MINITAB, 2004 (American Society for Quality Press, Milwaukee, Wisconsin). |
| [16] | Montgomery, D. C. Design and analysis of experiments, 2001 (John Wiley & Sons, Singapore). |
| [17] | S. Vijayan, R. Raju and S.R. K. Rao. Multi objective Optimization of Friction Stir Welding Process Parameters on Aluminum Alloy AA 5083 Using Taguchi-Based Grey Relation Analysis, Mater. Manuf. Proc., 2010, 25, p 1206–1212 |
| [18] | H. K. Mohanty, M. M. Mahapatra,P. Kumar, P. Biswa and N. R. Mandal. Effect of tool shoulder and pin probe profiles on friction stirred aluminum welds – a comparative study, paper accepted for publication, journal of marine science application. |
| [19] | P.A. Colegrove and H. R. Shercliff, 3-D CFD modeling of flow round a threaded FSW tool profile, Journal of material processing technology ,104(2005), 320-327. |
| [20] | H. N.B. Schmidt , and J. Hattel, “An analytical model for heat generation in FSW” , Modeling and simulation in material science and engineering, 12(1) (2008) , 143-157. |