-
Paper Information
- Previous Paper
- Paper Submission
-
Journal Information
- About This Journal
- Editorial Board
- Current Issue
- Archive
- Author Guidelines
- Contact Us
Journal of Mechanical Engineering and Automation
p-ISSN: 2163-2405 e-ISSN: 2163-2413
2012; 2(2): 17-24
doi: 10.5923/j.jmea.20120202.04
Vehicle Vibration Response Subjected to Longwave Measured Pavement Irregularity
 Abstract
 Reference
 Full-Text PDF
 Full-Text HTML
Roberto Spinola Barbosa
Department of Mechanical Engineering of the Engineering School of the University of Sao Paulo
Correspondence to: Roberto Spinola Barbosa , Department of Mechanical Engineering of the Engineering School of the University of Sao Paulo.
| Email: |  |
Copyright © 2012 Scientific & Academic Publishing. All Rights Reserved.
The motivation of this work is to develop a spectral method to deal with the vehicle vibration response when subjected to a longwave measured pavement irregularity. For this purpose, the vehicle model vibration is correlated in the frequency domain with the spectral density function of the pavement irregularity, to achieve the system spectral transfer function. Vehicle transfer function and spectral pavement irregularity results are treated in the frequency domain to obtain the vehicle frequency response due to a longwave road evenness input. The results show that, at 120 km/h in an asphalt pavement with ondulation, the first vehicle vibration mode has a significant movement enlargement, due to the pavement irregularity signature, causing passenger vibrational discomfort and identifying location for maintenance.
Keywords: vehicle, dynamic, vibration, pavement, irregularity, roughness, road, confort
Article Outline
1. Introduction
- During the vehicle project and design development, the automotive industry in general uses the vehicle modal response and numerical simulation (Costa, 1992), optimisation methods for suspension settle (Vilela, 2010), laboratory shaker test rig (Boggs, 2009) and the results of experimental field road test to fine-tune vehicle suspension (Vilela, Tamai, 2005). New techniques as magnetic active suspension is being developed to minimize road evenness effects improving vehicle ride comfort (Gysen, 2010). Another important aspect in the suspension design is the variability of the vehicle load and road evenness. The quarter-car model is usually employed to study vehicle vibration response (Kropac, 2009). State space half-vehicle model is used to identify pavement load but only in the time domain (Sun, 2007). The main contribution of this work consists in the devel-opment of a half-vehicle with two point delayed base exci-tation model and correlate with the spectral density function of a measured pavement irregularity in the frequency domain to obtain the vertical and angular vehicle frequency response due to a road evenness input. For this purpose, a two-wheels vehicle model is derived using the Lagrange method and its frequency response function considering the time delay of the out of phase input to each wheel, is obtained. The pavement vertical surface profile has been measured along two road sections with a special broadband wavelength measuring system. The spectral density function of thepavement irregularity with longwave content is determined and surface signature has been identified. The product of the two spectral functions in the frequency domain is performed in order to attain the system spectral transfer function. Notwithstanding the efficiency of the numerical methods, the laboratory and experimental works are still performed, despite costly and time-consuming. This approach contributes and extending the power of the design analytical tools due to the possibility to analyse vehicle dynamic response in a wide range of road evenness (Barbosa, 2001, 2011), reducing of the number of tuning experimental works. Also allows identifying vehicle dynamic response due to normalized irregularity density distribution or a measured pavement irregularity. The method addresses the passenger comfort due to vehicle vibration in rough pavement, vehicle safety through pavement/tyre contact force and complement the portfolio of the analytical design tools.
2. Vehicle Modelling
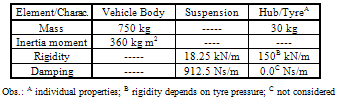
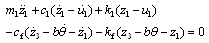
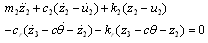
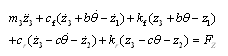
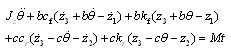
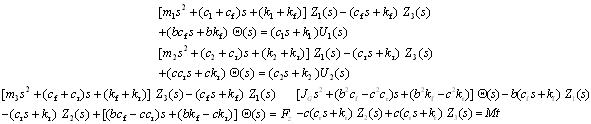
- The description of the dynamic vehicle behaviour is performed with the half-car representation. Four degrees of freedom lumped parameter model describing relevant movements is adopted to describe the vehicle in this research, as shown in Figure 1. The vehicle model associated with mass m3 and inertia moment JG, allows the vertical translation z3 and angular movement θ for the body. The front and rear suspensions have only vertical displacement. The lumped masses are connected with parallel spring-damper system. Vehicle suspension is associated to masses m1 and m2 and has correspondent elastic and dissipative properties (kf, cf, kr and cr). The tyre stiffness and damping values are k1, c1, k2 and c2. The model is excited by the same road evenness u1(t) and u2(t) with a time delay, which induces front and rear suspension movements, respectively.The equations of motion are obtained using the Lagrange method applied to the lumped rigid bodies. The kinetic and potential energy function and generalized dissipation function are:
 | (1) |
 | (2) |
 | (3) |
 | (4) |
|
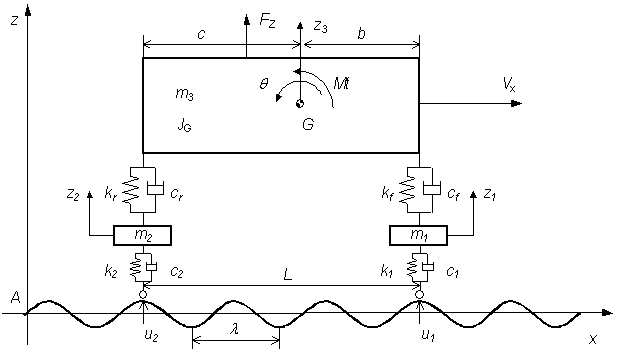 | Figure 1. Half-car model |
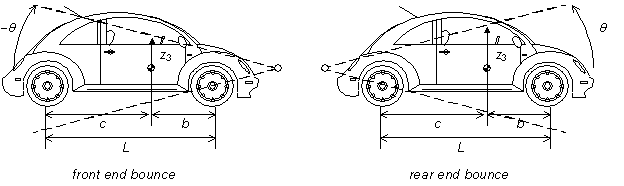 | Figure 3. Vehicle coupled modes (front and rear end bounce) |
 (9)Considering that the rear wheel runs on the same track as the front wheel, the surface elevation that produces the vertical displacement in each wheel is the same function with a time delay. Taking a periodic function u(t) as the imposed input, the rear wheel input is expressed as:
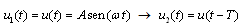 | (11) |
 and the time delay
  , being L the inter-axis distance and Vx the vehicle speed and λ the wavelength, as shown in Figure 1.The Laplace transformation of the front and rear wheel input function, considering the transformation of the delay function, is:
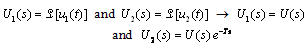 | (12) |
 | (13) |
 . The acceleration frequency response function known as inertance I(s) can be obtained. Analysing the system vertical and angular forced movements in the frequency domain response, replacing s with (iω) and assuming vehicle properties presented in Table 1, the frequency response inertance functions are expressed as:
 | (14) |
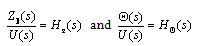
 | Figure 5. Vehicle inertance frequency response at 7.1 m/s (25.6 km/h) |
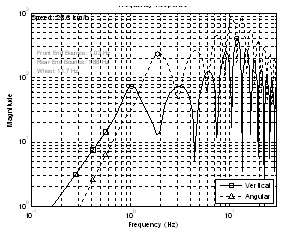
 | Figure 7. Vehicle inertance frequency response at 33.3 m/s (120 km/h) |
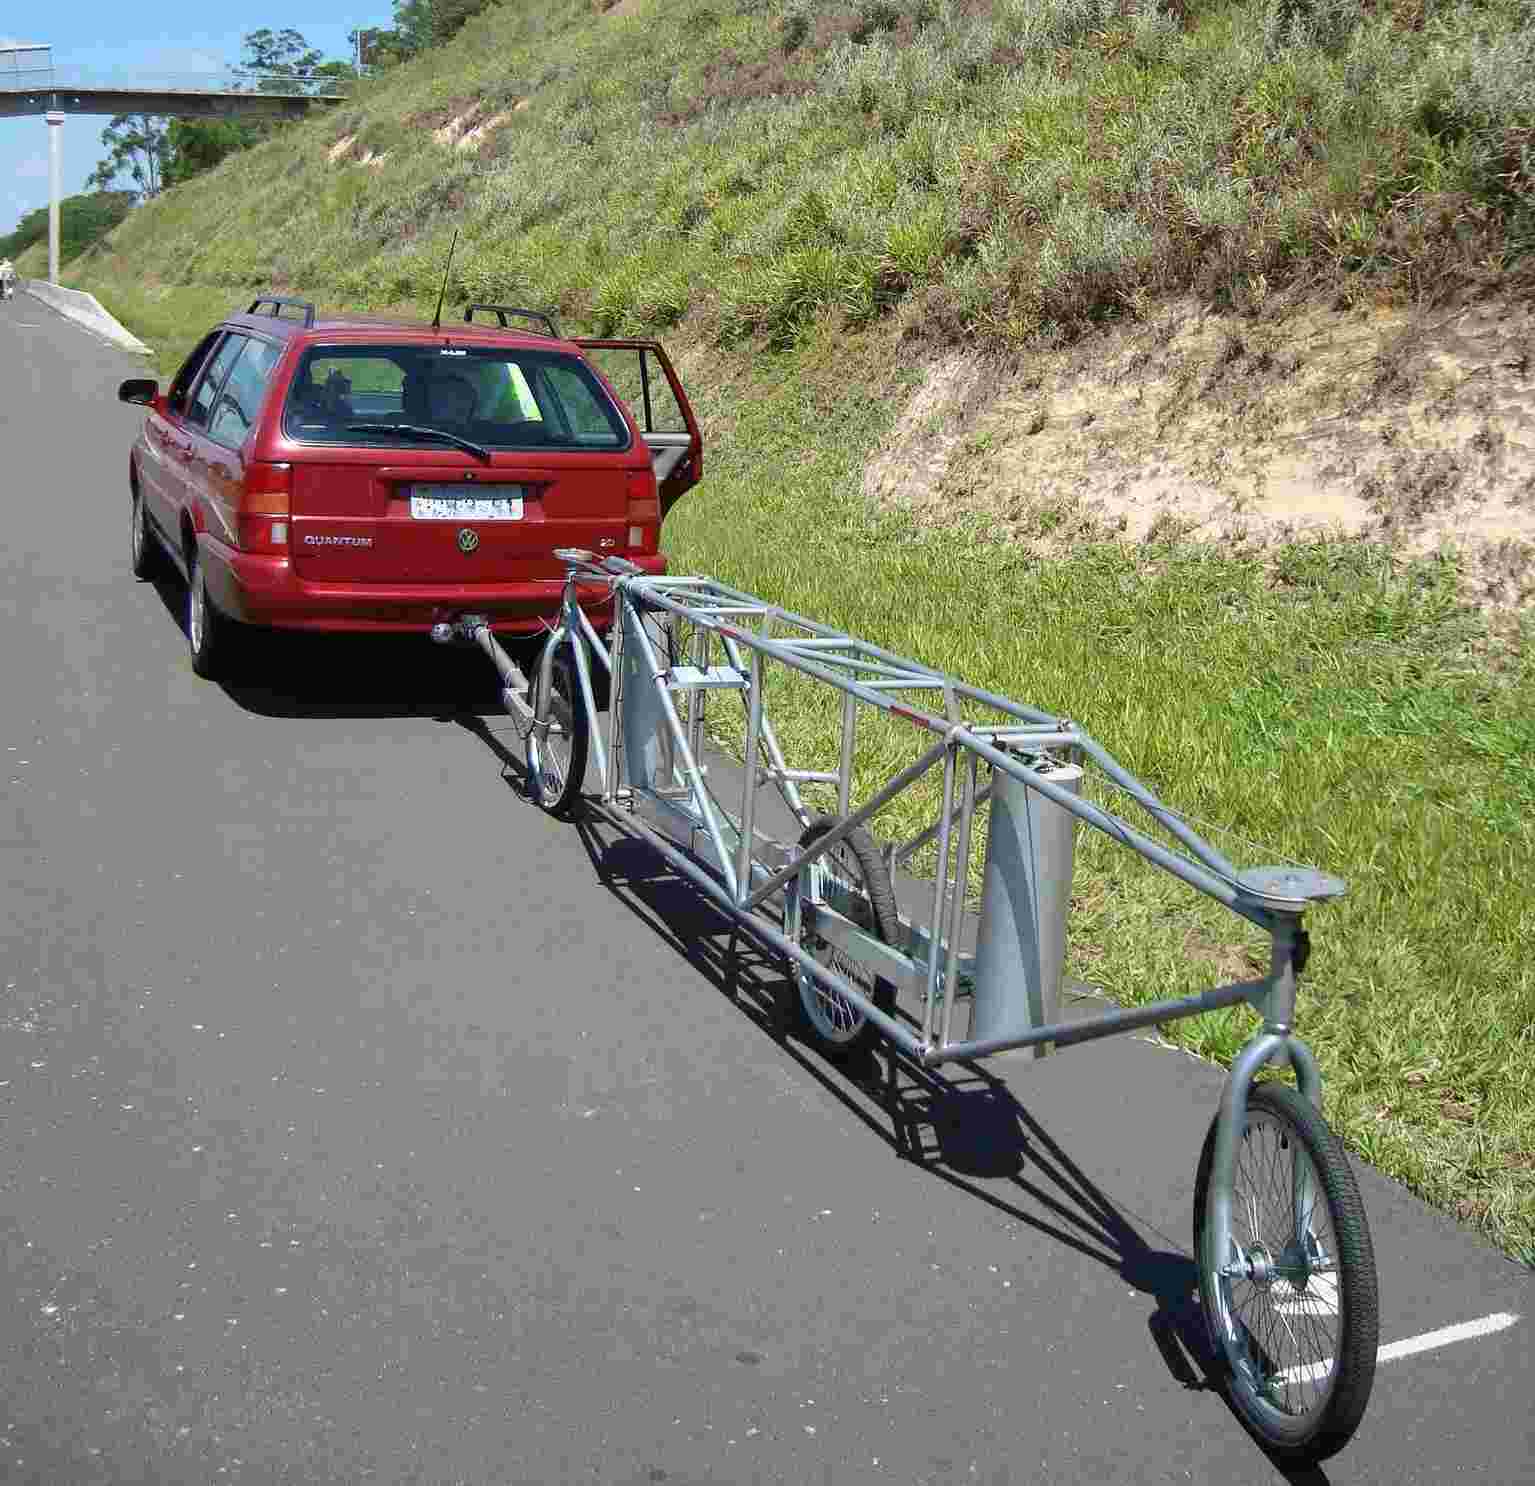 | Figure 9. Measuring device |
3. Pavement Irregularity Measurement
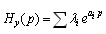
- The road pavement irregularity can be measured by different methods. On this study the surface irregularity was measured with the 3-point-middle-chord broadband wavelength system as presented in Figure 9. This system is composed of three aligned wheels supported on a frame dragged by a conventional car. The two external wheels are steered and the central wheel is articulated referring to the others constituting a moving reference frame. A conventional car pulls the measuring system along the road measuring the track evenness. The central wheel vertical movement was measured with a high precision linear variable differential transformer (LVDT) at every centimetre. The values are sampled with an analogue to digital sample board installed in a portable computer (Pavimetro, 2010). The data acquired are stored in magnetic media for post processing purposes.Elevation of two sections of asphalt highway with 2000 and 500 meters long, were measured. The measured data is treated with the measuring system transfer function to obtain the topographic vertical elevation of the surface irregularity specially including longwave contents, due to the data integration process. The vertical displacement of the center wheel system transfer function Hy(p) (Aknin, 1995) is defined by:
 | (15) |
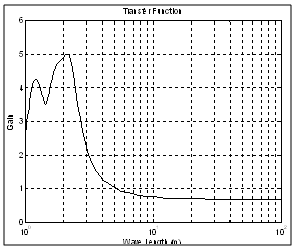 | Figure 11. Measuring system transfer function |
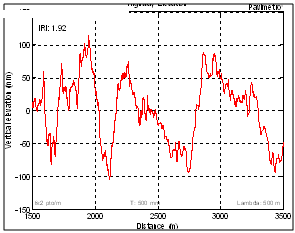 | Figure 13. Highway vertical elevation (asphalt) |
 | Figure 15. Road elevation with undulation (0.5 km long) |
4. Pavement Irregularity Density Function
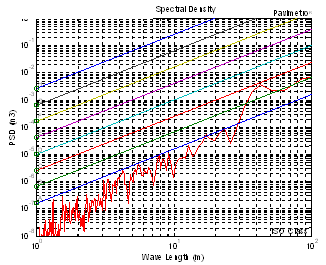
- The pavement irregularity can be expressed through its spatial frequency density function. The surface vertical elevation measured on a track, along the road distance z(x), can be transformed to the frequency domain to identify its contend of elevation wave length S(n). The transformation is based on the Fast Fourier Transformer (FFT) technique. The data treatment can be performed up to 2048 points of a sample rate down to 10-2 meters. This range allows analysing wavelength as long as 100 meters and below 0.2 meters. This wide range values are not usual in the pavement measurement systems.The asphalt track elevation measurements were manipulated to obtain the distribution in terms of wavelength of periodic irregularities. The power spectral density function (PSD) between 1 to 100 meters wavelength of the asphalt road vertical elevation is presented in Figure 17. The intensity of the measured pavement irregularity is classified, according to the magnitude of the power spectral pattern of the irregularities in an exponential fashion with a particular slope. The long road section measured spectrum has its particular signature and is compatible to A - level ISO Class (ISO 8606, 1995).
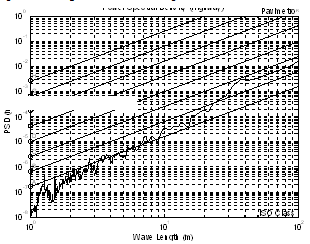 | Figure 17. Elevation PSD of the long section of highway (2000 meters) |
 | Figure 19. Road with ondulation (500 meters) |
5. Vehicle/Road Interaction
- The vehicle natural behaviour is expressed through its frequency domain response function. The pavement irregularity considered as a rigid surface, is expressed through its spatial frequency (1/space). The relationship between time frequency ω and spatial frequency n is the vehicle speed V, expressed simply by
 where ω is frequency in Hertz , n = 1/ λ is the inverse of the surface wavelength in meter and V is the vehicle speed in meter per second. Transforming S(n) into the frequency domain, S(ω) is obtained from:
 | (18) |
 | (19) |
 as shown in the block diagram of Figure 21, the following expression are obtained:
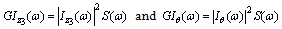 | (20) |
 and
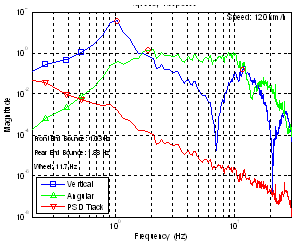
and  are the PSDs of the vehicle vertical acceleration response and the pitch angular acceleration response of the sprung mass, respectively.The acceleration density function of the vertical and angular vehicle mass centre is shown in Figure 23. It can be observed that at 33.3 m/s (120 km/h), the severe long wavelength content around 34 meters matches the first vehicle natural frequency (front end bounce). This effect magnifies the expected acceleration proneness around 1.0 Hz and therefore the passenger’s discomfort in this situation.When the ratio between the body and suspension frequency coincides with the ratio between the longitudinal speed Vx and the inter-axle distance (L), the largest magnification of the vertical translational interference occurs due to the track wavelength and the resonance of the suspension mode. This critical speed can be determined with the following relationship:
 | (21) |
 ) when travelling at 120 km/h. This resonance causes discomfort, annoying the passenger during the trip. Therefore, a specialized maintenance intervention on the pavement surface can produce the best cost/benefit ratio between comfort and amount of work (Namur, 2009, Martin, 2010). Any other standard pavement irregularity description, such as the ISO 8606, may be used with this technique, increasing the power of this method. A complete vehicle may be analysed providing the axle dynamic behaviour coherence function between road irregularity in left and right wheel-path (Bogsjo, 2008), including the analysis of human vibration comfort as recommended by the international human standard for comfort (ISO 2631, 1978).
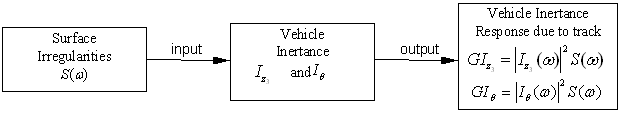 | Figure 21. Inertance response block diagram |
 | Figure 23. Vehicle inertance function in asphalt road at 120 km/h |
6. Conclusions
- A methodology was presented to evaluate vehicle/ pavement dynamic interaction. This methodology is based on the modal vehicle frequency response function and the statistical description of a rough pavement. For this purpose, a half-vehicle with two point delayed base excitation model is derived and the vertical and angular vehicle body transfer functions are calculated considering the time delay of the out of phase input. Two road section surface elevations were measured with a special referenced measuring system keeping the longwave evenness. This aspect is unique and not usual to conventional measuring systems. The data measured were treated to obtain the distribution in terms of periodic irregularity wavelength and surface signature has been identified. The vehicle body inertance vertical and angular transfer functions are weighed up by the surface irregularities distribution function, both in the frequency domain. The resulting system functions are related to the passenger comfort and can be used for suspension design purposes.The vertical inertance function obtained for the translation and angular body movements were excited with the track irregularity density function of the measured road surface elevation in the frequency domain. For a vehicle speed of 120 km/h, the first vertical body vibration mode coincides with the surface longwave magnification (34 meters), increasing the vehicle vertical movement and causing passenger discomfort.. This methodology extends the efficiency of the numerical simulation with the power of the frequency response analysis. The advantage of this approach is the possibility to analyse vehicle dynamic response subjected to any statistic description of pavement irregularity. Results allow quantifying passenger comfort and tune suspension parameters. After identified a particular harmful wavelength content on the pavement surface, a specialized maintenance intervention program to remove the longwave content can produce the best cost/benefit ratio between user comfort and amount of maintenance work.A simple four degrees of freedom vertical vehicle model was used in this study. However, based on this methodology, a complete vehicle model can be used including the axle dynamic behaviour coherence function between road irregularity in left and right wheel-path to assess detailed vehicle-pavement relationship. Trucks, lorries and other complex suspension types may also be investigated. Human body behaviour may be included in the comfort analysis for the complete cycle of vibration propagation.
ACKNOWLEDGEMENTS
- The author would like to thank the valuable contribution of Professor Edilson Tamai. Thanks also to the Mechanical Engineering Department of the Escola Politécnica da Universidade de São Paulo (EP-USP), for the support to this research.
Appendix A
- Differential motion equations obtained are:
 | (22) |
 | (23) |
 | (24) |
 | (25) |
 | (26) |
 | (15) |
 | (16) |
References
| [1] | ASTM Standard E 1926-08 - Standard Practice for Computing International Roughness Index of Roads from Longitudinal Profile Measurements, DOI: 10.1520/E1926-08, 16 p., 2003. |
| [2] | Costa, A. Application of Multibody Systems (MBS) Modelling Techniques to Automotive Vehicle Chassis Simulation for Motion Control Studies, Doctor Of Philosophy In Engineering, University of Warwick, England, 1992. |
| [3] | Vilela, D. Aplicação de Métodos Numéricos de Otimização ao Problema Conjunto da Dirigibilidade e Conforto Veicular (Optimisation numerical methods application to the vehicular ride and comfort joint problem). PhD. These at University of Sao Paul,. 315 p., Sao Paulo, Brazil, 2010. |
| [4] | Boggs, C., Southward, S. Ahmadian, M. Application of System Identification for Efficient Suspension Tuning in High-Performance Vehicles: Full-Car Model Study”. SAE Document Number: 2009-01-0433 in the Book Tire and Wheel Technology and Vehicle Dynamics and Simulation, Product Code: SP-2221, 434 p. 2009. |
| [5] | Vilela, D., Tamai, E. H. Optimisation of Vehicle Suspension Using Robust Engineering Method and Response Surface Methodology. Proceedings of The International Symposium on Dynamic Problems of Mechanics - DINAME. São Paulo, Brazil, 2005. |
| [6] | Gysen, B.L.J., Paulides, J.H. Janssen, J.L.G., Lomonova, E.A. Active Electromagnetic Suspension System for Improved Vehicle Dynamics, IEEE Transactions on Vehicular Technology, Vol. 59, no. 3, pp. 1156-1163, 2010. |
| [7] | Kropac, O. Mucka, P. Effects of longitudinal road waviness on vehicle vibration response. International Journal of Vehicle System Dynamics, Vol. 47, nº 2, pp. 135-153, 2009. |
| [8] | Sun, L., Luo, F. Nonstationary Dynamic Pavement Loads Generated by Vehicles Travelling at Varying Speed”. Journal of Transportation Engineering © ASCE. Vol. 133, pp. 252-263, 2007. |
| [9] | Barbosa, R.S., Costa, A. Safety Vehicle Traffic Speed Limit. IX International Symposium on Dynamic Problems of Mechanics, IX DINAME. Associação Brasileira de Ciências Mecânicas – ABCM, Brazil, 2001. |
| [10] | Barbosa, R .S., Vehicle Dynamic Safety in Measured Rough Pavement. Journal of Transportation Engineering © ASCE, Vol. 137, nº. 5, pp. 305-310, 2011. |
| [11] | Barbosa, R. S., Vehicle Dynamic Response Due to Pavement Roughness. Journal of the Brazilian Society of Mechanical Sciences and Engineering - ABCM, Vol. 33, p. 302-307, Brazil, 2011. |
| [12] | Felicio, L.C. Modelagem da Dinâmica de Sistemas e Estudo da Resposta (System Dynamic modelling and response study), Published by Editora Rima, São Carlos, São Paulo, Brazil, pp. 551, 2007. |
| [13] | http://www.pavimetro.com.br. Pavimetro - The Pavement Roughness Measuring System. Accessed January 2012. |
| [14] | Gonzalez, A.; O'Brien, E.J;. Li. Y.Y.; Cashell, K. The use of vehicle acceleration measurements to estimate road roughness. Vehicle System Dynamics, Vol. 46, Issue 6, pp. 485-501, 2008. |
| [15] | Kropac, O. Mucka, P. Indicators of longitudinal unevenness of roads in the USA. International Journal of Vehicle Design, Vol. 46, nº 4, pp. 393-415, 2008. |
| [16] | Kropac, O.; Mucha, P. Alternative single-number indicator of longitudinal road unevenness. Published by NRC Research Press, Canadian Journal of Civil Engineering, Vol. 36 pp. 389-401, 2009. |
| [17] | Farias M.M.; Souza, R.O. Correlations and Analyses of Longitudinal Roughness Indices. Road Materials and Pavement Design, Vol. 10, Issue: 2, pp. 399-415, 2009. |
| [18] | Harris, N.K., Gonzalez, A., OBrien, E.J. McGetrick, P. Characterisation of pavement profile heights using accelerometer readings and a combinatorial optimisation technique. Journal of Sound and Vibration, Vol. 329, pp. 497 –508, 2010. |
| [19] | ISO 8606 - International Organisation for Standardisation. Mechanical Vibration Road Surface Profiles - Reporting of Measured Data. International Standard ISO-8608:1995, 30 p, 1995. |
| [20] | Silva, J.G.S., Roehl, J.L.P. Probabilistic Formulation for the Analysis of Highway Bridge Decks with Irregular pavement Surface, Journal of the Brazilian Society of Mechanical Sciences (ABCM), Vol. XXI, nº 3, Brazil, pp. 433-445, 1999. |
| [21] | Andrén, P. Power spectral density approximations of longitudinal road profiles Journal: International Journal of Vehicle Design, Vol. 40, nº.1/2/3, pp. 2-14, 2006. |
| [22] | Andersson, P.B.U. Time domain contact model for tyre/road interaction including non-linear contact stiffness due to small-scale roughness. Journal of Sound and Vibration, Vol. 318, Issue 1-2, pp. 296-312, 2008. |
| [23] | Newland, D. E. An introduction to random vibrations and spectral analysis. 2nd Edition, Longman Scientific & Technical, New York, 377 p, 1984. |
| [24] | Namur, E.; de Solminihac, H. Roughness of Unpaved Roads Estimation and Use as an Intervention Threshold. Transportation Research Record, Issue 2101, pp. 10-16, 2009. |
| [25] | Martin, T.C. Experimental Estimation of the Relative Deterioration of Surface Maintenance Treatments. Journal of Transportation Engineering. Vol. 136, nº 1, pp. 1-10, 2010. |
| [26] | Bogsjo, K. Coherence of road roughness in left and right wheel-path”. Vehicle System Dynamics, Vol. 46, Supplement S, pp. 599-609, 2008. |
| [27] | ISO 2631 - International Organisation for Standardisation. Guide for evaluation of human exposure to whole-body vibration. International Standard ISO-2631:1978, 40 p., 1978. |
| [28] | Yousefzadeh M., Azadi S., Soltani, A. (2010) Road profile estimation using neural network algorithm, Journal of Mechanical Science and Technology, Vol. 24 (3) pp. 743~754. |
| [29] | Aknin, P. (1995) Outils de description de la géométrie des voies et déconvolution des relevés expérimentaux, Rapport nº 204 LTN-INRETS, 76 p., France. |