Riley Rutkowski, Anna Caes, Kayla Clark, Suzanne K. Lunsford
Department of Chemistry, Wright State University, 3640 Colonel Glenn Highway, Dayton, Ohio, USA
Correspondence to: Riley Rutkowski, Department of Chemistry, Wright State University, 3640 Colonel Glenn Highway, Dayton, Ohio, USA.
| Email: |  |
Copyright © 2024 The Author(s). Published by Scientific & Academic Publishing.
This work is licensed under the Creative Commons Attribution International License (CC BY).
http://creativecommons.org/licenses/by/4.0/

Abstract
Raman spectroscopy and Fourier Transform Infrared spectroscopy (FTIR) differ in key fundamental ways: the simplicity of the preparation process of the sample, the accuracy of each process, and the size and accessibility of the libraries associated with each spectroscopy method. Both methods, however, can be used to identify potentially deadly chemicals that could be found at the scene of a crime. This experiment explores the advantages of FTIR and Raman while reviewing the organic chemistry functional groups to answer the hypothetical question: What is the identity of the white powder at the crime scene? It should be noted that the differences in the preparation of samples between the Raman and the FTIR were immense, where the Raman had little to no preparation and the FTIR samples had constraints on sample thickness, uniformity, and dilution to avoid saturation. The samples analyzed will be illustrated and discussed in comparison to each other throughout this paper.
Keywords:
Spectroscopy, Raman, IR, FTIR, Cocaine, Forensic, Forensic chemistry, Electrochemistry
Cite this paper: Riley Rutkowski, Anna Caes, Kayla Clark, Suzanne K. Lunsford, Forensic Chemistry: Raman versus FTIR Spectroscopy- An Undergraduate Study to Engage in Technology, Journal of Laboratory Chemical Education, Vol. 12 No. 2, 2024, pp. 21-35. doi: 10.5923/j.jlce.20241202.01.
1. Introduction
For many decades, forensic scientists have struggled to identify and characterize samples from crime scenes. Now, the world is using cutting-edge chemistry instrumentation to aid in the collection and analysis of key evidence. Such technologies include Raman and FTIR spectroscopy. Both Raman and FTIR spectroscopy can differentiate between the many different functional groups. One problem that plagues students studying organic chemistry is the understanding and naming of basic organic chemistry functional groups. This project aims to aid in the exploration of organic chemistry in a forensic chemistry setting to engage students in determining unknown samples that could be found at a crime scene while learning how to operate Raman and FTIR instrumentation.Raman spectroscopy has become more popular in the forensic analysis lab; it requires little sample preparation, and it is both a non-destructive and non-invasive method that can analyze tiny samples. With FTIR Spectroscopy, water produces a strong signal in infrared and can overpower the analysis signals of the sample, which obscures the results, especially in humid settings. In Raman spectroscopy, water does not show a strong signal, allowing for easier analysis of aqueous solutions. There is some light scattering that occurs at the same wavelength as the laser source, referred to as Rayleigh Scatter, that causes minor discrepancies when using a Raman system. Typically, approximately 0.0000001% of light is scattered at different wavelengths, depending on the chemical structure of the analyte, which is referred to as Raman Scatter. The Raman spectra illustrate several peaks where the intensity and wavelength position of the Raman scattered light designates a specific molecular bond vibration. The general Raman spectrum provides a unique chemical fingerprint that can be used to identify an unknown chemical sample, and a comprehensive Raman spectral library search assists in providing chemical identification.There are key differences between Raman and FTIR spectroscopy. Raman depends on a change in the polarity of the molecule. However, FTIR spectroscopy is dependent on a change in the dipole moment of a molecule. Additionally, Raman spectroscopy measures the relative frequencies at which the sample scatters radiation, while FTIR spectroscopy measures the absolute frequencies at which the sample absorbs radiation. Raman is also sensitive to the homo-nuclear molecular bonds, allowing it to distinguish between alkane, alkene, and alkyne bonds. FTIR has a sensitivity to hetero-nuclear molecular bonds, which allows for the detection of functional groups and -OH stretching. Overall, the key advantage of Raman spectroscopy is that it is both nondestructive and requires little to no sample preparation, while FTIR spectroscopy requires a destructive and more extensive sample preparation. FTIR sample preparation is heavily involved because the sample's thickness and uniformity are imperative for a successful data acquisition scan. One of the biggest drawbacks of Raman spectroscopy is that there is the potential for interference from fluorescent lights in the testing environment.During World War II, the Nazis used phenol on pregnant Polish women. The phenol substance was deadly and was later also used as a euthanasia technique in the Auschwitz encampment. [3] The use of Raman and FTIR technology in this lab today offers students insights into what these chemicals could have been by identifying the functional groups through organic chemistry. This lab builds upon the great importance of understanding the bonding and analyzing the unknown chemical samples to determine the unknown white powders examined as well as gives students real-world examples in which organic and forensic chemistry can be used.The goal of this project is to illustrate the benefits of both techniques as well as encourage undergraduate students to compare Raman and FTIR in relation to forensic chemistry and unknown sample analysis.
2. Methods and Materials
The organic materials sodium tetraborate, sodium bicarbonate, phenol, acetylsalicylic acid, paracetamol, ascorbic acid, isobutylphenyl propionic acid, trimethylxanthine, and salicylic acid were purchased from Millipore Sigma. The Raman spectra were performed using a PeakSeeker Raman spectroscopy instrument, with a laser wavelength of 785 nm. The Raman Peakseeker-785 instrument that was used only operates in the range of 200-2000 cm-1, as noted by the spectra data displayed. The FTIR spectroscopy was performed using the FTIR Nicolet instrument. All samples analyzed were compared to the Raman Spectra library database. The FTIR Nicolet instrument did not have a library database to compare the data to, so the data collected with the FTIR system was only compared with literature values.Raman ExperimentationBeginning with the Raman process, the first sample of white powder was added to a glass vial until the vial was approximately 3/4 of the way full. This amount was chosen so that there was enough of the sample in the glass vial for the heightened laser to reach to analyze. The vial was then placed into the sample compartment of the PeakSeeker, and the laser was turned to the on position to begin data collection. Once the spectrum was collected, it was compared to the software’s Raman library. After the comparison was run, the peak data was then compared to tables and literature values. The structure of the literature peaks was used as a reference to ensure that all groups that were identified in the experimental data were groups that could be reasonably found in the sample. This process was then repeated for each of the samples prepared. FTIR ExperimentationFor the FTIR process, first, potassium bromide (KBr) pellets were prepared to analyze each of the samples. The ratio of potassium bromide to the sample was 100/1. This was achieved by first using an electric balance to weigh out 1.000 grams of potassium bromide. This was then transferred to a mortar. Then, 0.010 grams of the sample to be analyzed was weighed out and transferred to the same mortar holding the 1.000 grams of potassium bromide. The two chemicals were then ground with a pestle to combine the solids and break up the particles to better incorporate with each other. Following, a piece of aluminum foil was obtained, and a hole punch was used to create a large enough hole in the aluminum foil to hold the sample. This aluminum foil was placed on an aluminum block and half of the ground sample powder was placed into the hole and leveled so that the distribution of the powder was even. Another aluminum block was placed on top of the sample and the unit was placed into a hydraulic press. The hydraulic press was set to 18,000 psi for approximately 30 seconds. The KBr pellet was then released from the press and inspected for usability. Next, the KBr pellet containing the sample was placed into the FTIR machine, where the spectrum was collected. This spectrum was then analyzed to identify the functional groups. These peaks were cross-referenced with literature values for identification due to the lack of a library attached to the software used for analysis. This process was then repeated for each of the samples prepared.Note that safety when working with a laser is of the utmost importance, and safety during sample preparation was followed during all parts of the project. The use of the controls for adjustments or performance of procedures other than the directions specified in the manual may result in hazardous radiation exposure. The laser should not be directed or reflected toward people or reflective objects. Appropriate eyewear should always be worn when working with these machines and protective covers should not be removed or modified. The laser should never be operated if the unit is defective or if safety covers, locks, and labels are damaged or missing. When dealing with chemicals, gloves should be worn to limit skin exposure and all chemicals should be disposed of according to the Material Safety Data Sheets (MSDS) recommendations.
3. Results and Analysis
Table 1.1. Peaks for Each Molecule for Raman and FTIR and Corresponding Vibrations
 |
| |
|
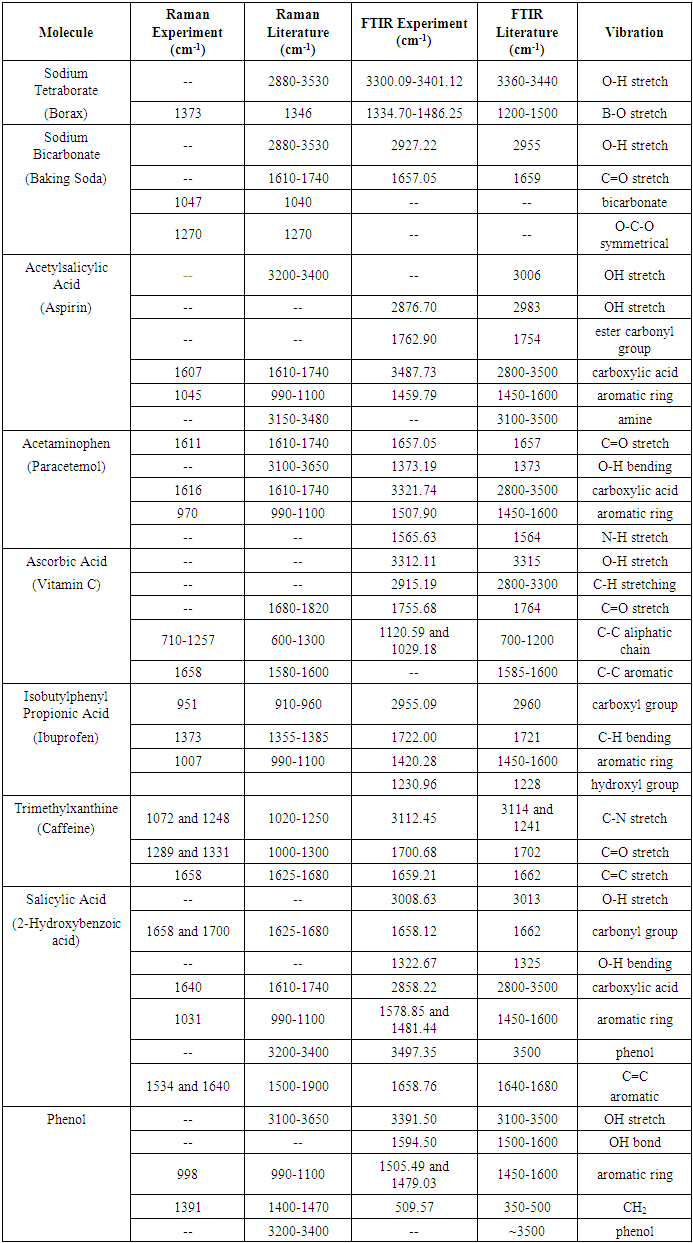
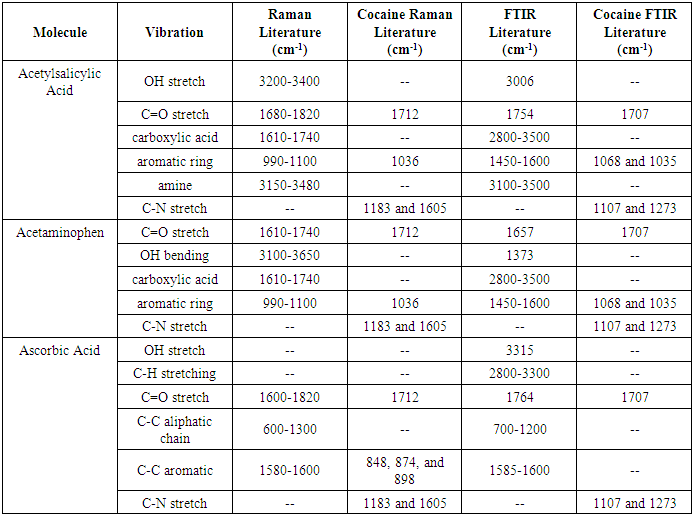
The data collected from each Raman and FTIR spectra was compiled into this table so that the peaks could be analyzed. The table shows each of the vibration types, what values the peaks would be found at per the literature used for cross-referencing, and the peak values found during experimentation. Dashes in the table represent no peaks that have been reported in the literature area and dashes represent no peaks observed in the FTIR and Raman analysis. Table 2.1. Comparison of Some Fine White Powders to Cocaine
 |
| |
|
This table consists of some samples that would most likely be confused for cocaine without chemical analysis and compares the literature values associated with each to the literature values of cocaine. This is to highlight molecular parts of each sample that distinguish itself from other molecules, such as cocaine.The following data is the analysis of the organic compounds that were tested. All samples analyzed were white powders that could be confused with illicit drugs such as cocaine upon initial inspection. The structures of each compound are drawn below to show each unique functional group that assists in confirming the identity of each organic compound. 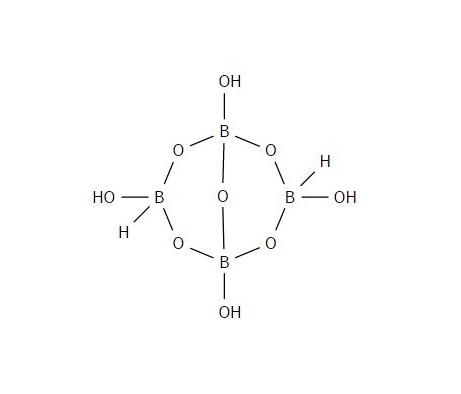 | Figure 1.1. Sodium Tetraborate (Borax) Structure |
Borax is a fine white powder that is typically used as a detergent for laundry. The hydrate compound is mostly made up of borate anions ionically bonded with sodium cations. The water molecules are not included in this structure. Some of these bonds were analyzed by both the Raman and FTIR systems.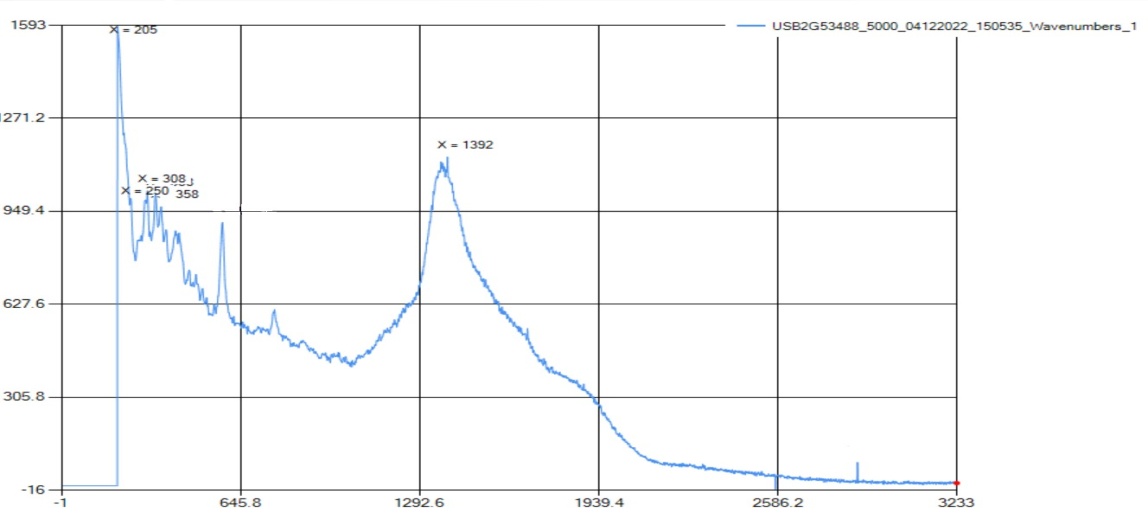 | Figure 1.2. Raman Spectra for Sodium Tetraborate (Borax) |
The peaks for the B-O stretch are at 202-337 cm-1, with the standard range at 150-430 cm-1. All peaks obtained in the borax trial were cross-referenced with the Spectral Database for Organic Compounds (SDBS) for accuracy. However, the PeakSeeker machine used in the experiment did not detect any vibrations past 3233 cm-1, which meant that the detection for OH or H2O (which is typically found in borax) was not possible.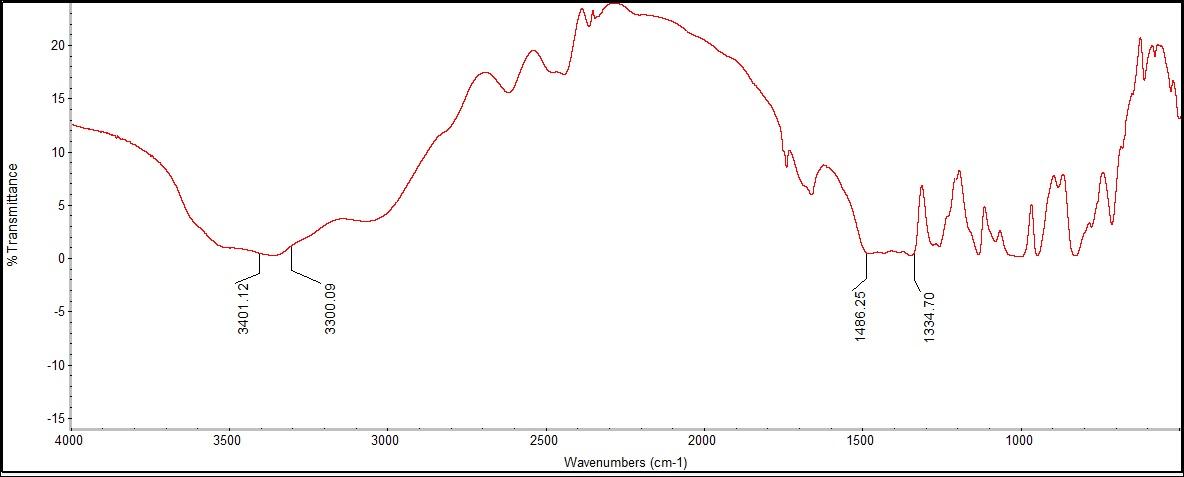 | Figure 1.3. FTIR Spectra for Sodium Tetraborate (Borax) |
The spectrum showed peaks for OH and C=O bonding. The OH peaks were potentially from one of the four OH bonds in the borax molecule or the water that could have been attached to the molecule. There were no correlating peaks for comparison from the Raman because the range at which the Raman detects OH bonds could not be reached. After reviewing the FTIR literature, there were no definitive standard ranges for B-O or OH bonding using FTIR spectra. The experimental data did show a B-O bonding peak at 1486.25 cm-1, which does correlate to the Raman B-O bonding peaks between 202-337 cm-1. 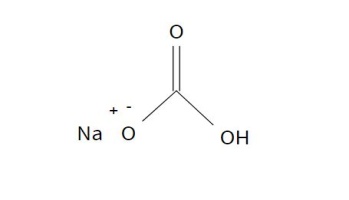 | Figure 2.1. Sodium Bicarbonate (Baking Soda) Structure |
The compound sodium bicarbonate, baking soda, is a fine white powder that is typically used in baking and for household odor control. The compound is made up of carboxylic acid, a C=O stretch, an aromatic ring, and an O-C-O symmetric stretch.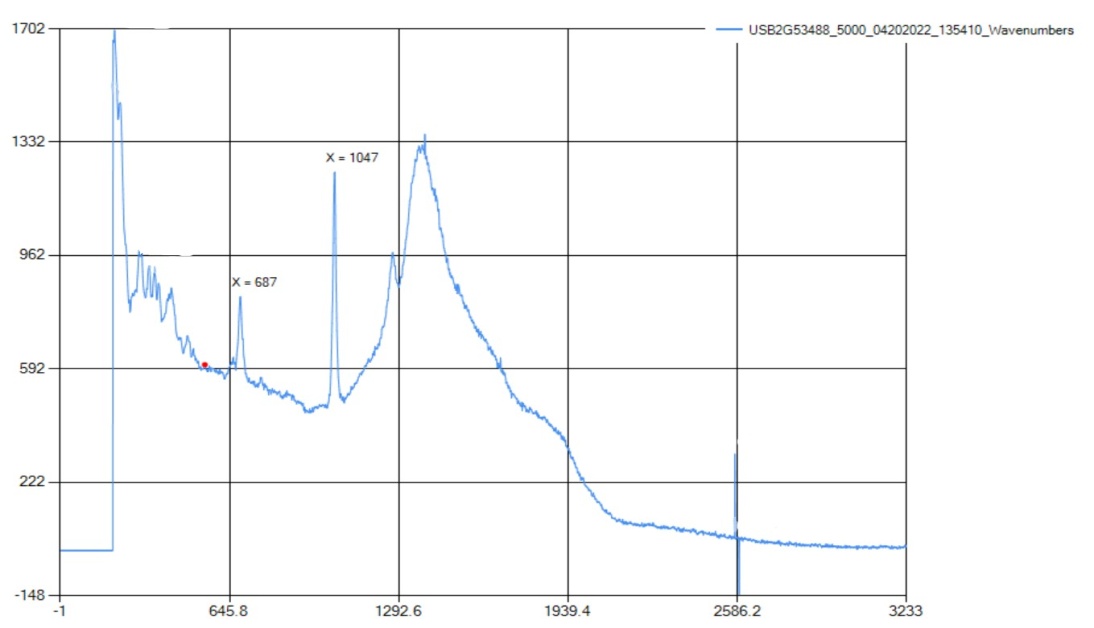 | Figure 2.2. Raman Spectra for Sodium Bicarbonate (Baking Soda) |
The peak for the C=O bonding is found at 1049 cm-1, which correlates with the standard range at 1040-1100 cm-1. There also was a peak at 1270 cm-1, which is an ID peak of O-C-O. O-C-O is a functional group found in baking soda and was the standard wavelength for that bond.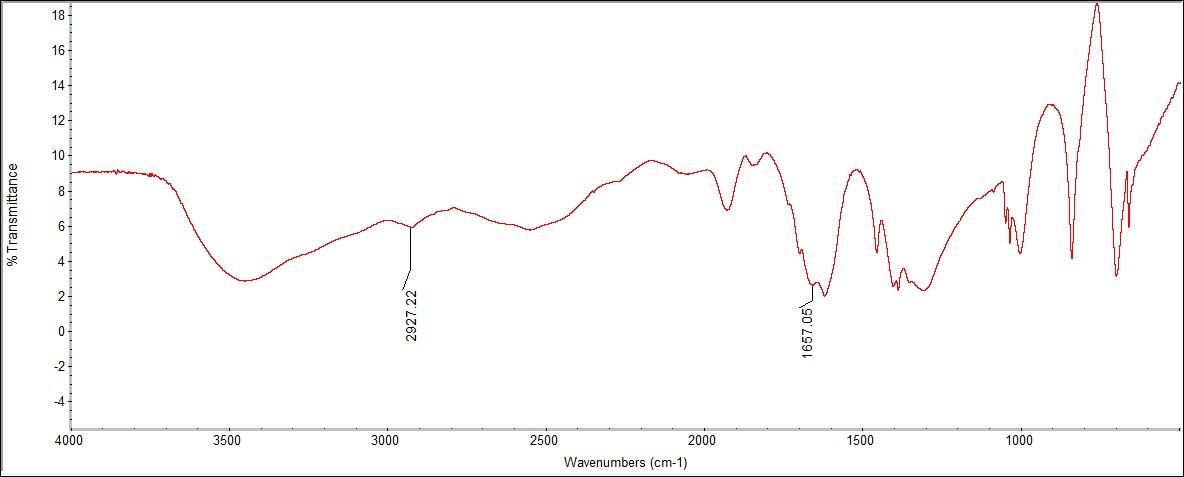 | Figure 2.3. FTIR Spectra for Sodium Bicarbonate (Baking Soda) |
The FTIR spectra had peaks for C=O bonding, O-C-O stretching, and H2O. A peak was seen at 1,657.05 cm-1 for C=O bonding from the functional group on top of the structure. The standard range could be determined for the C=O and OH bonds in the FTIR, however, in the Raman spectra these peaks were not found.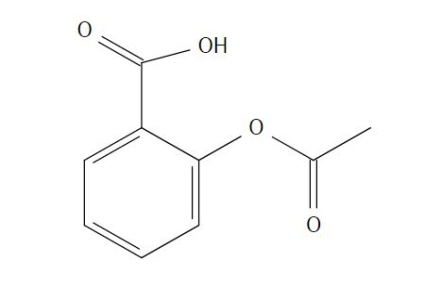 | Figure 3.1. Acetylsalicylic Acid (Aspirin) Structure |
The compound acetylsalicylic acid is a fine white powder used to create compressed pills to treat high blood pressure and pain such as headaches. The compound contains a carboxylic acid, an ester, and an aromatic ring, and should show peaks for C-O stretching, OH stretching, and O-C-O symmetric stretching.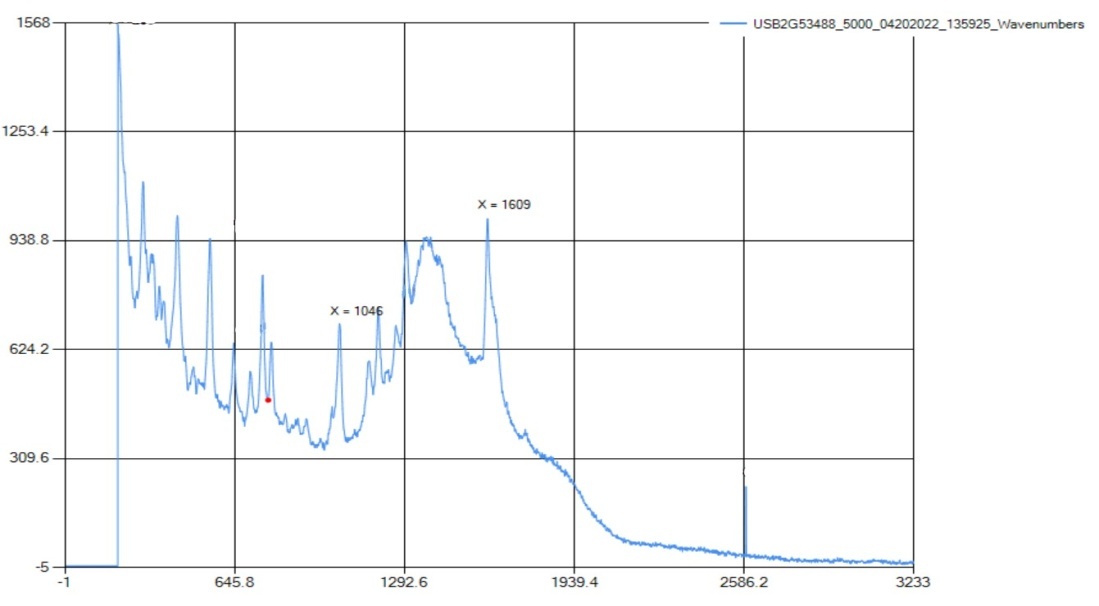 | Figure 3.2. Raman Spectra for Acetylsalicylic Acid (Aspirin) |
The Raman spectra show peaks for carboxylic acid bonding at 1607 cm-1, which correlates with the standard range of 1610-1740 cm-1. The aromatic ring peak was at 1045 cm-1, which is in the range of 990-1100 cm-1, and was the only intense peak in that range. The Raman only detected peaks for an aromatic ring and C=O carboxylic acid bonding.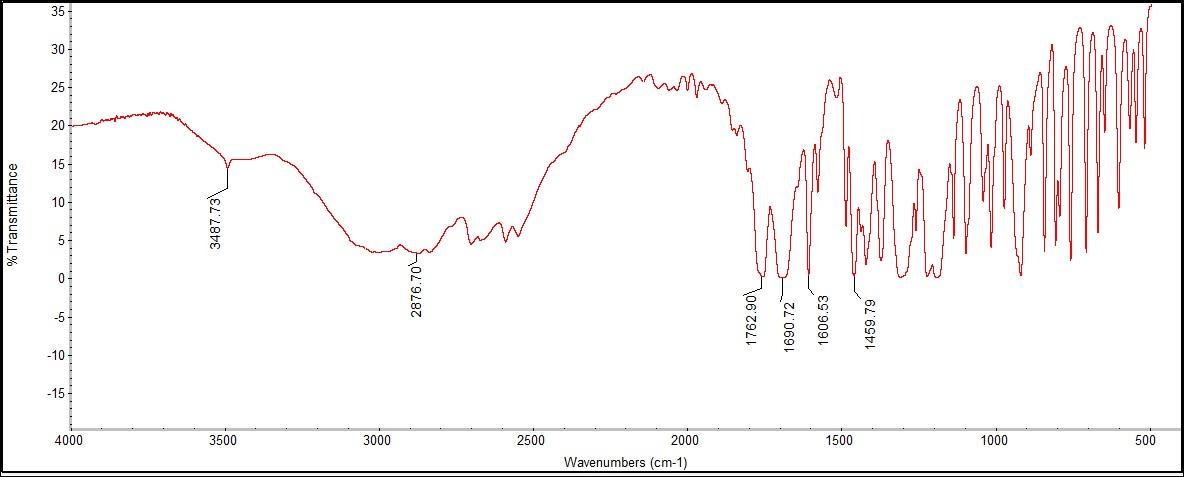 | Figure 3.3. FTIR Spectra for Acetylsalicylic Acid (Aspirin) |
The FTIR spectra showed peaks for a carboxylic acid, an aromatic ring, and carbonyl ester bonding. A peak was seen at 3487.73 cm-1 for carboxylic acid, following the expected identifying range of 2800-3500 cm-1. In addition, there was an aromatic ring peak at 1459.79 cm-1, which was within the expected range of 1450-1600 cm-1. A peak at 1762.90 cm-1 related to the ID peak of 1754 cm-1 of a carbonyl ester bond was also found.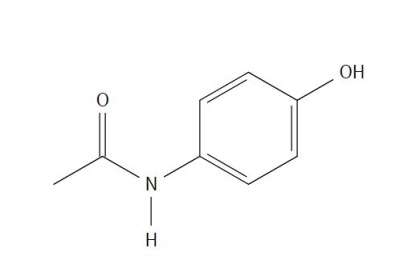 | Figure 4.1. Acetaminophen (Paracetamol) Structure |
The compound Acetaminophen is a fine white powder used to create compressed pills for over-the-counter mild painkillers and fever reducers. The compound consists of carboxylic acid, aromatic ring, C=O stretching, N-H bonding, and OH stretching and bending.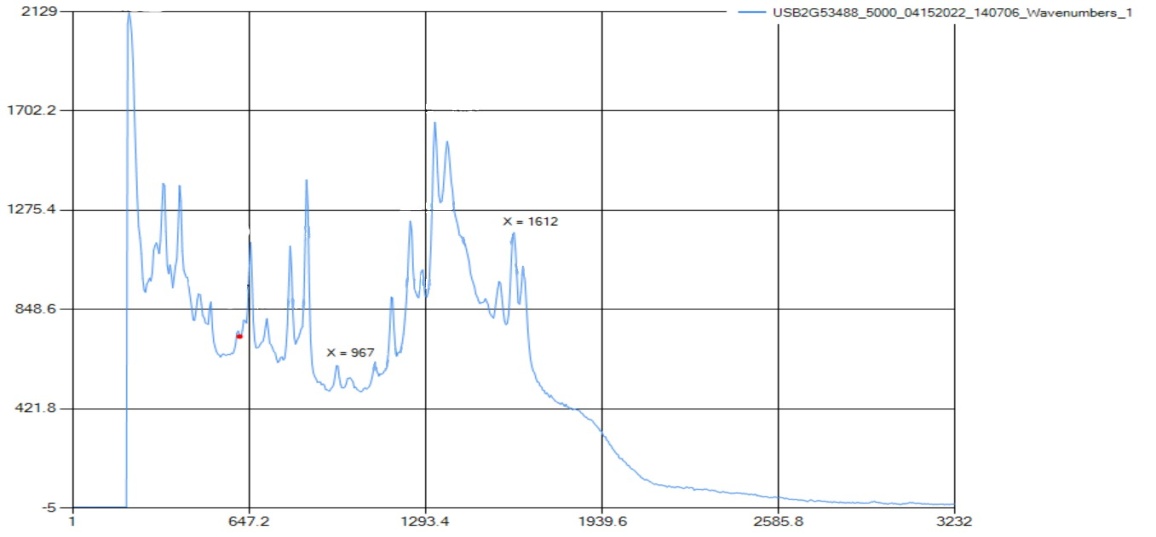 | Figure 4.2. Raman Spectra for Acetaminophen (Paracetamol) |
Raman only detected carboxylic acid and aromatic rings; all other functional groups were out of range. Raman spectra found peaks for carboxylic acid bonding at 1616 cm-1, which correlates with the standard range at 1610-1740 cm-1. There also was the aromatic ring peak at 990 cm-1, which is in the range of 990-1100 cm-1.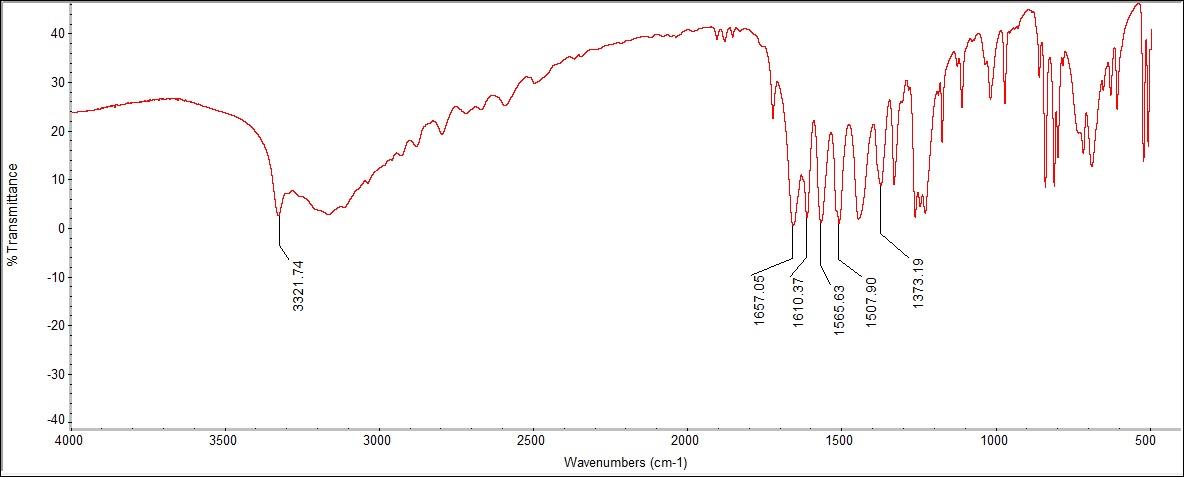 | Figure 4.3. FTIR Spectra for Acetaminophen (Paracetamol) |
The FTIR spectra showed peaks for carboxylic acid, aromatic ring C=O stretching, N-H bonding, and OH bending. Beginning with the OH bending, the peak was at 1373.19 cm-1, with a literature range of 1373 cm-1. In addition, there is a peak at 1565.63 cm-1, designating the unique N-H stretch for the compound, with a literary value of 1564 cm-1. There was a peak at 1657.05 cm-1 for C=O, connected to the carboxylic acid that was detected at 3321.74 cm-1, which corresponded to the literature range of 2800-3500 cm-1. 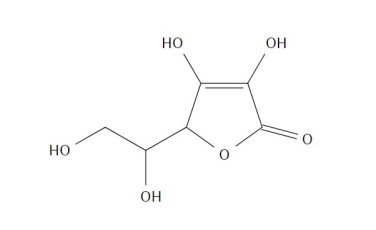 | Figure 5.1. Ascorbic Acid (Vitamin C) Structure |
Ascorbic Acid, or Vitamin C, is a fine white powder that is mostly used pharmaceutically to boost the immune system. This organic material is most abundant in citrus fruits. The compound is made of hydroxyl groups, a carbonyl group, and a -O- group. 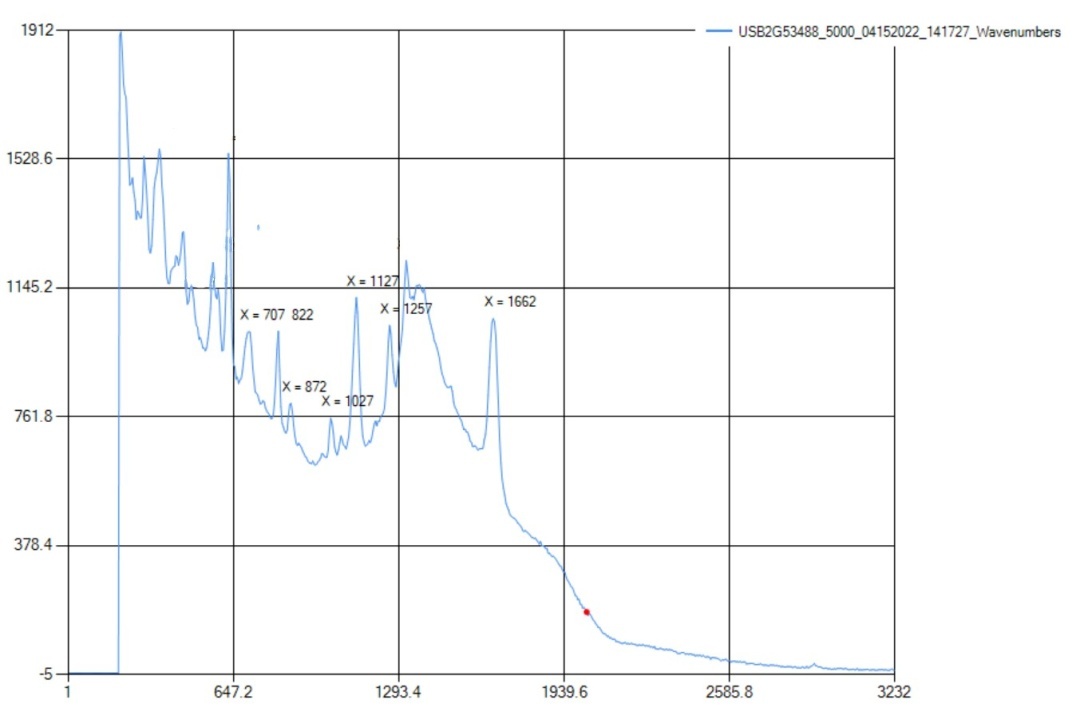 | Figure 5.2. Raman Spectra for Ascorbic Acid (Vitamin C) |
The Raman only detected aromatic and aliphatic chains of C-C bonds; all other functional groups were out of range. The Raman spectra had peaks for C-C aromatic bonding at 1658 cm-1, which correlates with the standard range at 1580-1600 cm-1 with slight error. There also were C-C aliphatic chains at 710-1257 cm-1, which is in the standard ID range of 600-1300 cm-1.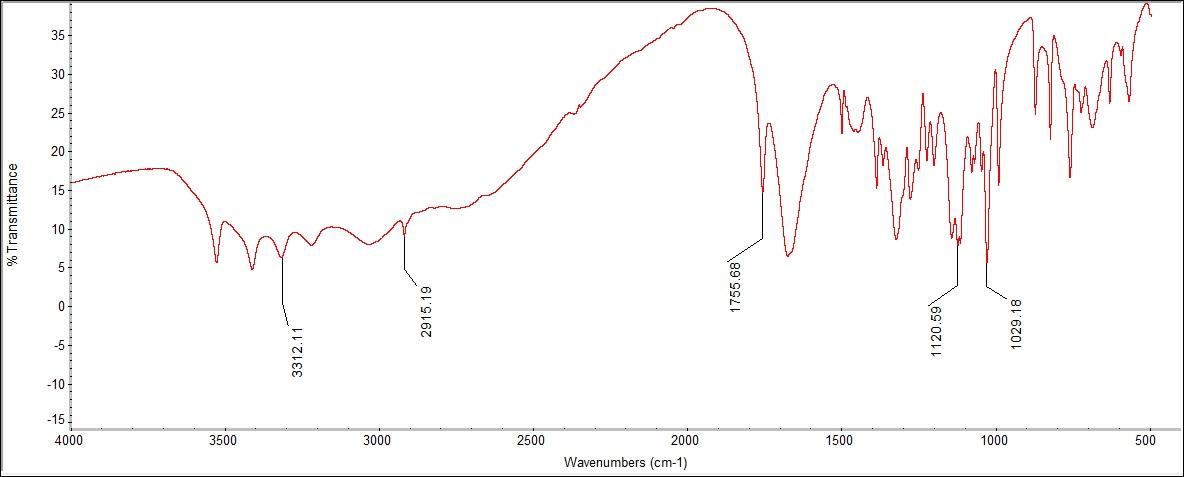 | Figure 5.3. FTIR Spectra for Ascorbic Acid (Vitamin C) |
The FTIR spectra had a peak for C-C bonding at 1120.59 and 1029.18 cm-1. There was also a C=O stretch found at 1755.68 cm-1. In addition, there was a C-H bonding peak at 2915.19 cm-1, within the literature range of 2,800-3,300 cm-1. There was a peak for OH stretching at 3312.11cm-1, which was close to the literature values of 3314 and 3215 cm-1. These peaks, however, were not present on the Raman spectrum, except for the C-C bonding. Many of all chemical structures contain at least one C-C bond, so this range is not very distinct.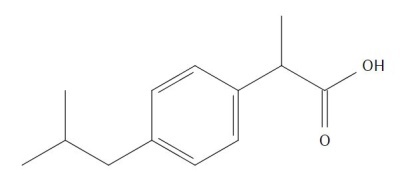 | Figure 6.1. Isobutylphenyl Propionic Acid (Ibuprofen) Structure |
Isobutylphenyl propionic acid, or ibuprofen, is a fine white powder used to create compressed pills for over-the-counter mild painkillers and fever reducers. The compound is made up of a carboxylic acid, an aromatic group, and C-H bending.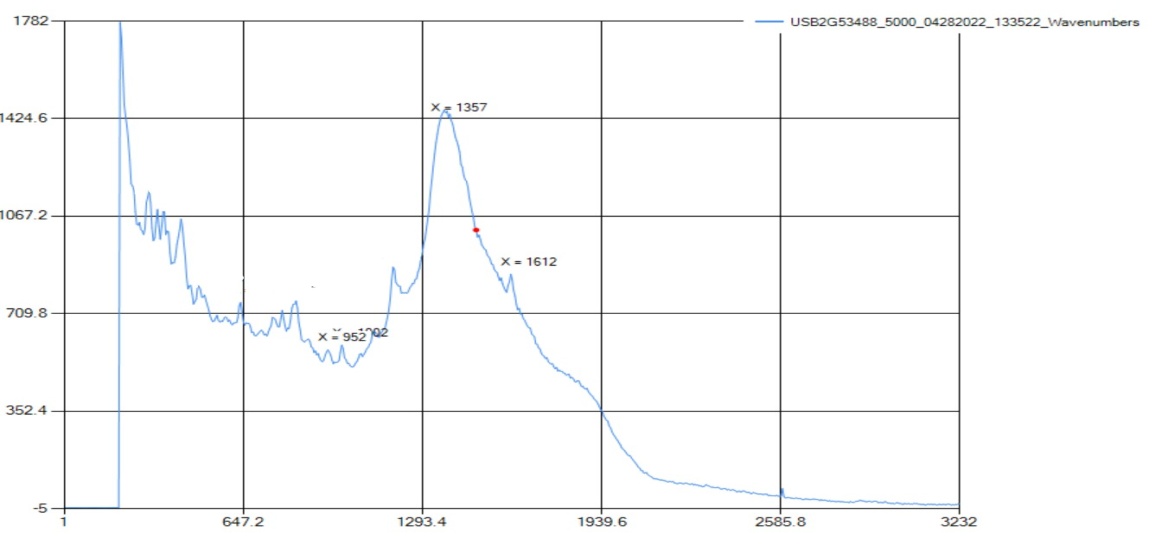 | Figure 6.2. Raman Spectra for Isobutylphenyl Propionic Acid (Ibuprofen) |
The Raman detected all the functional groups for this sample. The Raman spectra peaked at 1373 cm-1, which is within the C-H range of 1355-1385 cm-1. The aromatic ring was detected at 1007 cm-1, which correlates with the standard range of 990-1100 cm-1. Then, the carboxylic acid peaked at 951 and 1611 cm-1 with 951 cm-1 being in the range of carboxylic acid dimer, and 1611 cm-1 is identified as carboxylic acid. In the case of Ibuprofen, the available Raman instrument accurately identified the solid with three out of three functional group peaks represented.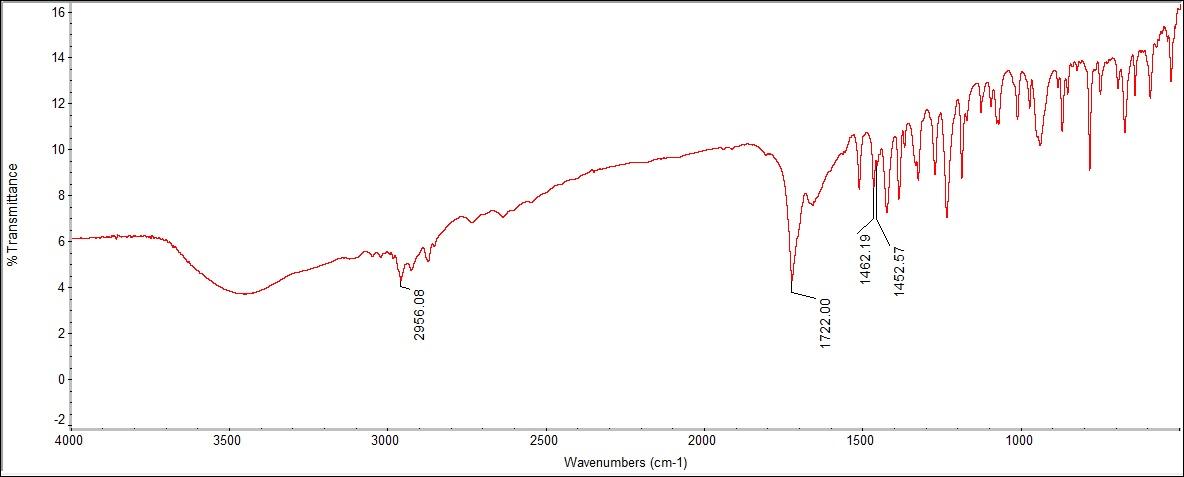 | Figure 6.3. FTIR Spectra for Isobutylphenyl Propionic Acid (Ibuprofen) |
The FTIR spectra had the same peaks of carboxylic acid, an aromatic ring, and C-H bonding. The peak for carboxylic acid were seen to be 2955.09 cm-1, using the ID values of 2956 and 2960 cm-1 found in a credible spectra analysis book. In addition, an aromatic ring was seen at 1420.28 cm-1. The peak for C-H bending was seen at 1722.00 cm-1, which is related to the identification value 1721 cm-1. Overall, the Raman and FTIR spectrums for Ibuprofen within the experimental data were the most accurate in identifying the substance.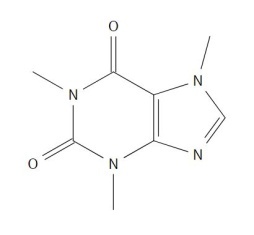 | Figure 7.1. Trimethylxanthine (Caffeine) Structure |
Caffeine is a common drug used to increase activity in your brain, acting as a stimulant drug. This white powder has amide and amine groups in the chemical structure which blocks the detection of melatonin thus decreasing drowsiness.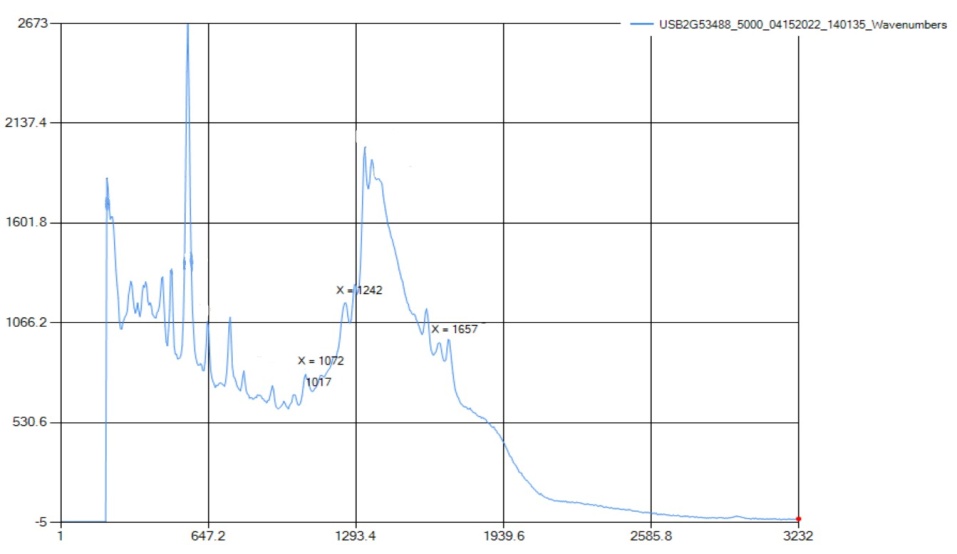 | Figure 7.2. Raman Spectra for Trimethylxanthine (Caffeine) |
The Raman did not show either the amide or the amine functional group because they were both out of the instrument's range. What was detected was C-N bonding, C=O stretching, and C=C aromatic, which are all bandings found in caffeine, but are not functional groups. Therefore, in the instance of the caffeine sample, the Raman instrument that was available could not represent the functional group peaks in the structure because of the limitation of the machine, however, it did identify the bonds included in those functional groups.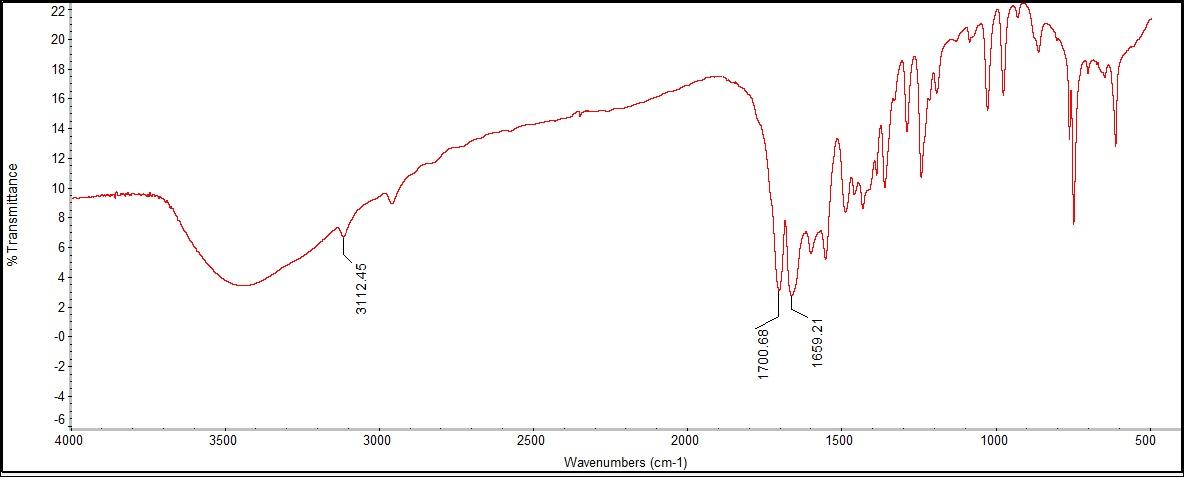 | Figure 7.3. FTIR Spectra for Trimethylxanthine (Caffeine) |
The FTIR spectra had the same peaks as the Raman for C=C, C=O, and C-N, in addition to correlating peaks for amide and amine functional groups. The peaks for the functional groups amide or amine could be found at 3112.45 cm-1, both of which fall within the range of 3100-3600 cm-1. Unfortunately, there are no additional features to distinguish the two groups. The peak at 3443 cm-1 was found to be most likely caused from excess moisture in the sample when creating the KBr pellet used in sampling. 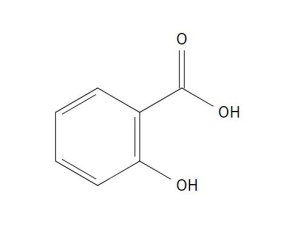 | Figure 8.1. Salicylic Acid (2-Hydroxybenzoic Acid) Structure |
Salicylic acid is a white powder compound found in plants used to support growth, photosynthesis, transpiration, and defense against pathogens. The detected groups consisted of a phenol group, carboxylic acid, and an aromatic ring.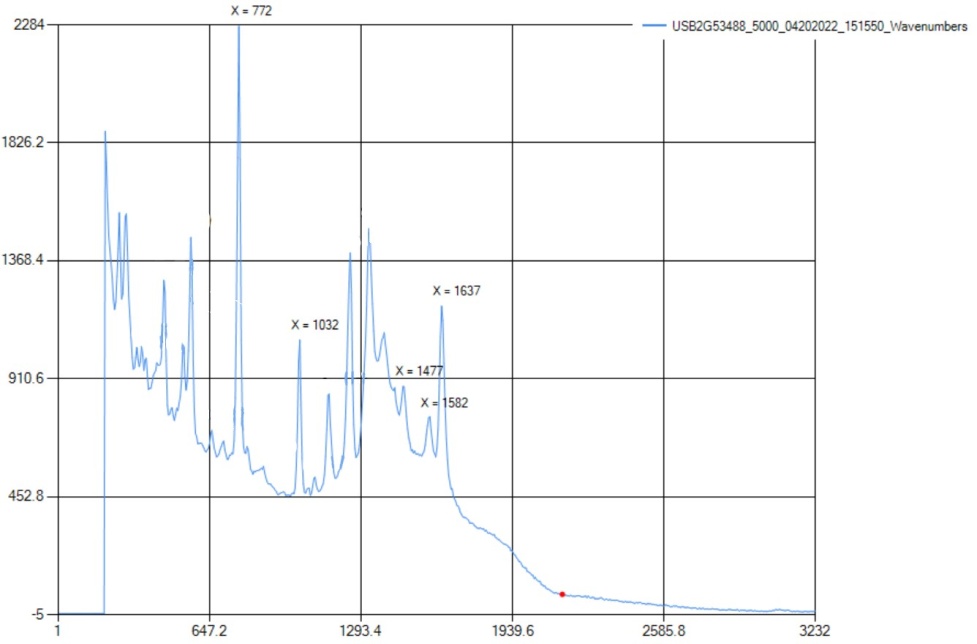 | Figure 8.2. Raman Spectra for Salicylic Acid (2-Hydroxybenzoic Acid) |
On the Raman spectra, there was a carboxylic acid peak at 1640 cm-1, which is related to the literature value of 1610-1740 cm-1. There was also a peak at 1031 cm-1, indicating an aromatic ring. The aromatic ring, in this case, was benzene. The phenol was not detected though, since the range is 3200-3400 cm-1 and the equipment used did not have a limit that included this range.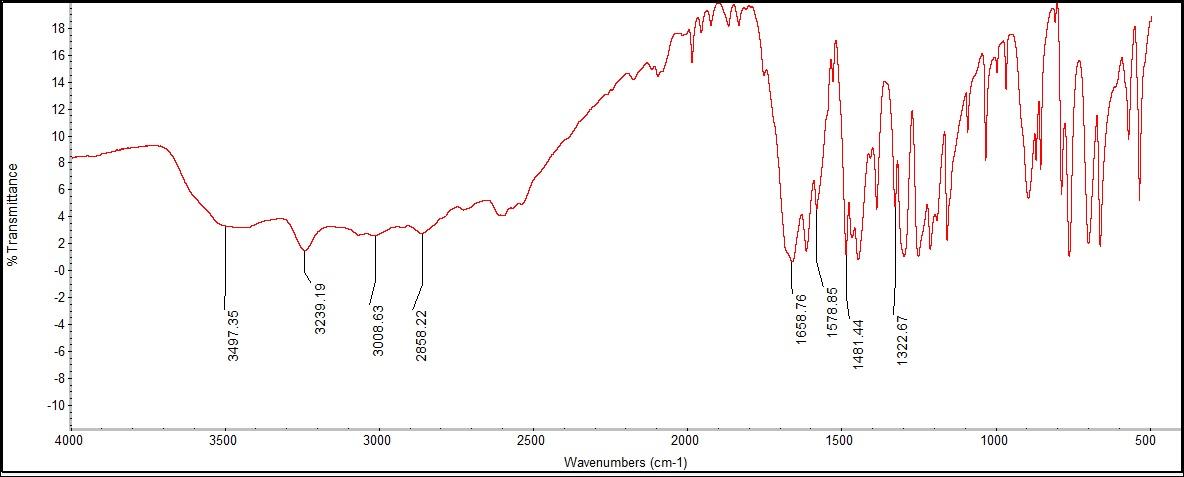 | Figure 8.3. FTIR Spectra for Salicylic Acid (2-Hydroxybenzoic Acid) |
The FTIR was able to detect a phenol group, carboxylic acid, OH stretching, and an aromatic ring. The phenol group peak was found at 3497.35 cm-1, with a literature value of 3500 cm-1. The carboxylic acid group was found to be just outside of the literature rage at 2858.22 cm-1, missing the range of 2800-3500 cm-1. There were two peaks found for the aromatic ring, at 1578.85 and 1481.44 cm-1.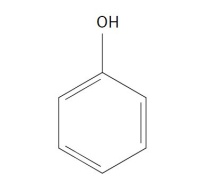 | Figure 9.1. Phenol Structure |
Phenol is a powder found in household cleaners used to disinfect multiple surfaces. The functional groups present are a hydroxyl group, CH2, and an aromatic ring.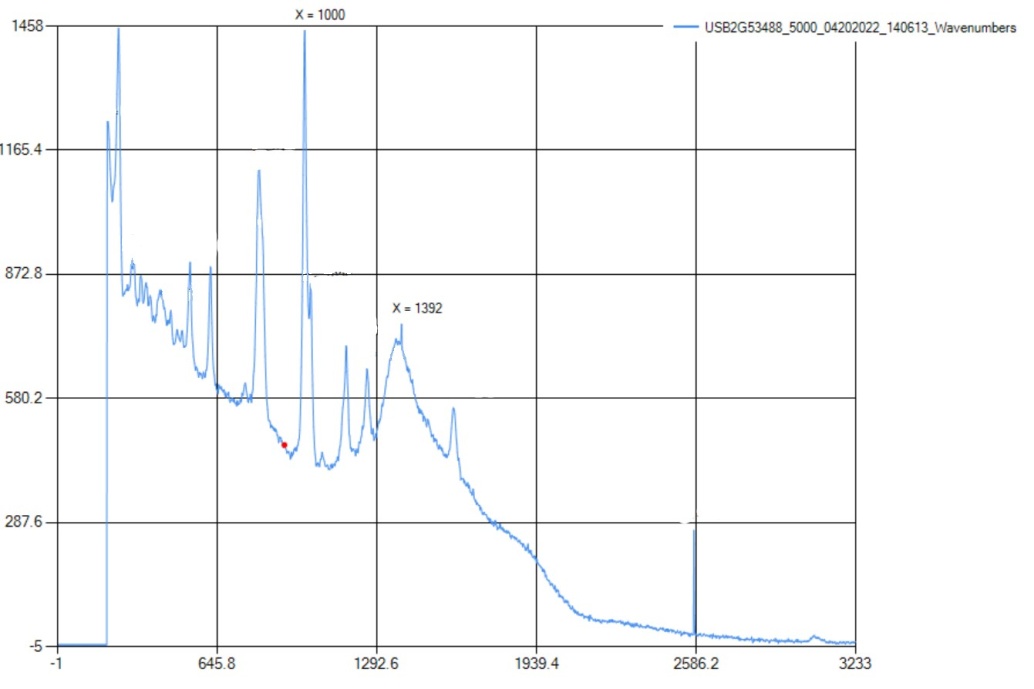 | Figure 9.2. Raman Spectra for Phenol |
The aromatic ring is present at 998 cm-1, which is within the literature range of 990-1100 cm-1. This indicates that the aromatic ring is a benzene ring. Also, there is a medium peak at 1391 cm-1, which is close to the range for CH2 bonds.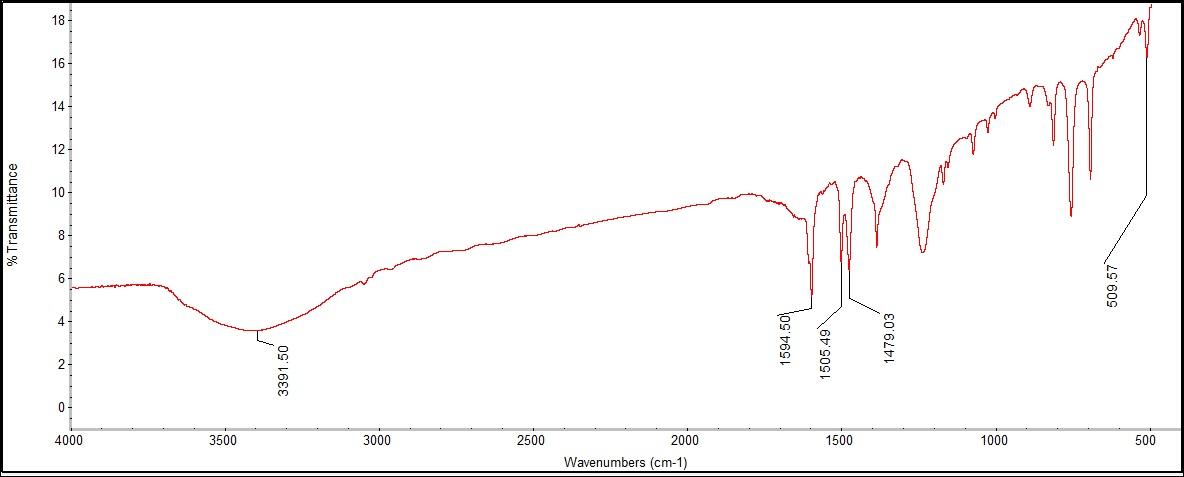 | Figure 9.3. FTIR Spectra for Phenol |
What was most notably detected in the functional groups by FTIR was the lack of a phenol group, which should have been evident around 3500 cm-1, with a broad OH stretch at 3391.50 cm-1. There was an additional narrow peak at 1594.50 cm-1, also indicating OH bonding with multiple peaks in the range for an aromatic ring from benzene. There was a peak at 509.57 cm-1, indicating a CH2 bond.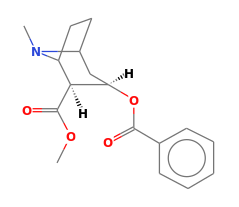 | Figure 10.1. Cocaine Structure |
Cocaine is a fine white powder that is a Class A illegal substance. It is a strong euphoric stimulant with a strong addictive probability. It is most characterized by its C-N stretching, but also includes C-O, C=O, and C=C stretching and an aromatic ring. 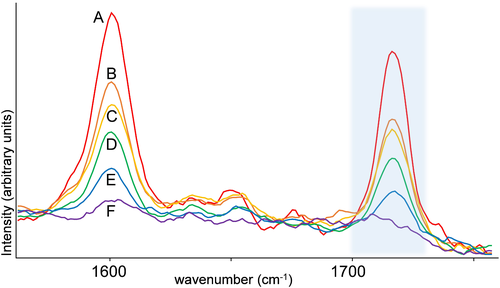 | Figure 10.2. Raman Spectra for Cocaine |
This figure represents the most active parts of a Raman spectra of cocaine. The colored lines indicate different concentrations of cocaine with red (A) being 90%, orange (B) being 70%, yellow (C) being 50%, green (D) being 30%, blue (E) being 20%, and purple (F) being 10%. Cocaine differs the most from the other samples due to the C-N stretching that is present at 1183 and 1605 cm-1, shown in this figure as one of the most intense peaks.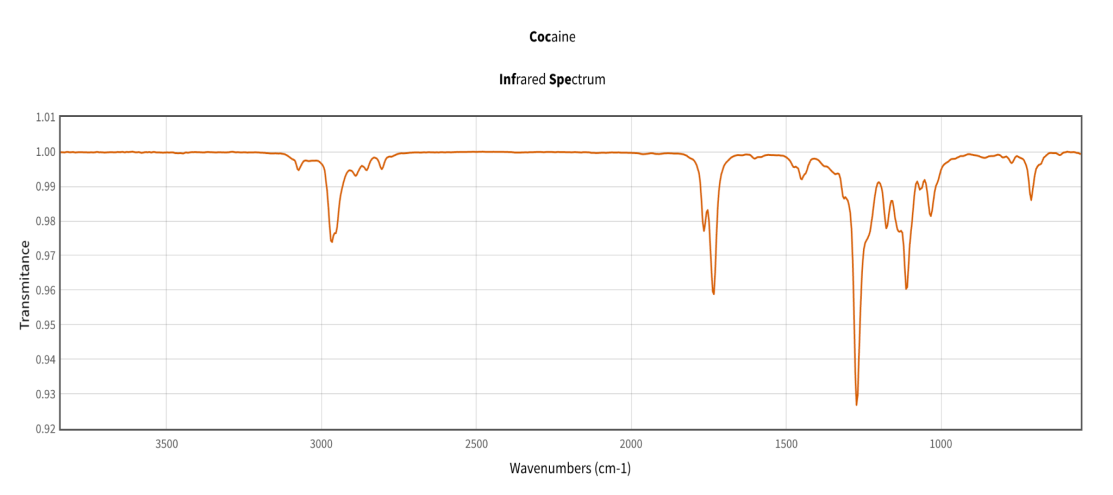 | Figure 10.3. FTIR Spectra for Cocaine |
The FTIR spectra shows a peak in the 1700 cm-1 range that indicates a C=O stretch. There is also a C-N stretch in the 1270’s cm-1 that matches with other literature values for cocaine. The benzene aromatic ring can be found at approximately 1050 cm-1.
4. Discussion
Overall, the process of Raman spectroscopy is relatively simple. The sample preparation takes little time and is precise, however, enough sample must be added to the glass vial before placing it in the sample compartment. One drawback that was found was the detection limit of the Raman system was not broad enough to detect OH bonds. The other was the amount of interference that was present in the spectra collected. The FTIR process was more involved in sample preparation than the Raman spectroscopy, therefore making the process of running the FTIR spectroscopy longer. The fragility of the KBr pellets lengthened the process and many times the sample had to be remade due to imperfections in the ground KBr pellets. However, there was less interference in the results and it was easier to find credible sources to identify the functional groups in the sample.The purpose of this experiment is to determine how difficult identifying an illegal substance, cocaine, would be in comparison to other samples that share similar physical properties. Although the processes associated with both Raman and FTIR differ greatly, the identification of cocaine on a molecular level was possible. Cocaine had a C-N bond that was unique compared to the samples that were tested in the experiment and both the FTIR and Raman spectra were able to detect this bond.The choice to focus on the functional groups instead of the fingerprint region in the FTIR spectra of each of the samples allowed for the identification of bonds that were well out of the fingerprint region. For example, the fingerprint region would include single bonds, such as the C-N stretch that differentiated the cocaine example from the other white powder samples that had similar physical properties. However, the exclusion of the functional groups to focus more on the fingerprint region would ignore some important identifying double bonds, such as the C=C bonds in both caffeine and salicylic acid.
5. Conclusions
The use of Raman and FTIR technology in this lab today offers students insights into what novel technology to utilize in the world of forensic science. The advantages of Raman spectroscopy with the non-destructive nature for sample testing with rapid, quantitative, confirmatory, and in-field analysis results. The FTIR requires the KBr sample preparation steps and is less likely to be utilized in the field analysis, and on-site testing. The unknown compounds that were all white powders have gained students' interest in learning organic chemistry functional groups with real-world applications in the forensic field. This lab builds upon the great importance of understanding the bonding present in chemicals and analyzing the unknown chemical samples to determine the identities of various unknown white powders that were examined. Building upon students’ understanding of organic chemistry at a comprehensible level for any undergraduate chemistry student, this lab has a strong focus on the functional groups and instrumental analysis that is prevalent in modern forensic science. This not only prepares students for and builds upon their comprehension of organic chemistry, but it also prepares students directly for work in the chemistry field by gaining a deeper understanding of two of the most important chemical instruments used in modern science. Students also learn about the benefits and the drawbacks of Raman Spectroscopy and FTIR Spectroscopy and also practice the scientific method in determining the ideal instrument for identifying between multiple common white powders in comparison to the widely illegal and dangerous substance of cocaine.
ACKNOWLEDGEMENTS
Many thanks to WSU Foundation’s grant-making fund: Students First Grant for their financial support.
References
| [1] | Akçan, R.; Yıldırım, M. Ş. Raman Spectroscopy as a Novel Technology in Forensic Toxicological Analyses. Current Analytical Chemistry 2020, 16. https://doi.org/10.2174/1573411016999200602124328. |
| [2] | Andrews, D. L. Rayleigh Scattering and Raman Effect, Theory. In Encyclopedia of Spectroscopy and Spectrometry; Elsevier Ltd., 2017; pp. 924–930. https://doi.org/10.1016/b978-0-12-409547-2.11337-x. |
| [3] | Karwowska, B.; Lachendro, J.; Setkiewicz, P.; Wampuszyc, E.; Nowak, A.; Bartowsik, I.; Beattie, A. J.; Witek-Malicka, W.; Wontor-Cichy, T.; Strzelecki, A.; Pinderska-Lech, J.; Michaldo, A.; Logan, T. Auschwitz: History, Place and People; 2021. |
| [4] | Marley, N., Mann, C., Vickers, T., Applied Spectroscopy, “Determination of Phenols in Water Using Raman Spectroscopy”, 1984. |
| [5] | RAMAN Band Correlation Table. UCI. 2013. https://www.chem.uci.edu/~dmitryf/manuals/Raman%20correlations.pdf. |
| [6] | HORIBA Jobin Yvon. RAMAN DATA and ANALYSIS Raman Spectroscopy for Analysis and Monitoring; HORIBA Scientific. https://static.horiba.com/fileadmin/Horiba/Technology/Measurement_Techniques/Molecular_ Spectroscopy/Raman_Spectroscopy/Raman_Academy/Raman_Tutorial/Raman_bands.pdf. |
| [7] | Wade, L.; Kennepohl, D.; Farmer, S.; Soderberg, T. 15.7: Spectroscopy of Aromatic Compounds. Chemistry LibreTexts. https://chem.libretexts.org/Courses/Athabasca_University/Chemistry_350%3A_Organic_Chemistry_I/ 15%3A_Benzene_and_Aromaticity/15.07%3A_Spectroscopy_of_Aromatic_Compounds#:~:text=Two %20bands%20%281500%20and%201660%20cm%20%E2%88%921%29%20caused. |
| [8] | Cortes, S. 10.7: Functional Groups and IR Tables. LibreTexts Chemistry. https://chem.libretexts.org/Ancillary_Materials/Laboratory_Experiments/Wet_Lab_Experiments/Organic_ Chemistry_Labs/Lab_I/10%3A_Infrared_Spectroscopy/10.07%3A_Functional_Groups_and_IR_Tables#:~: text=IR%20SPECTRUM%20OF%20A%20CARBOXYLIC%20ACID%20A%20carboxylic,2800%20and %203500%20cm-1%20for%20the%20O-H%20stretch. |
| [9] | AIST: Spectral Database for Organic Compounds(SDBS). sdbs.db.aist.go.jp. https://sdbs.db.aist.go.jp/index.html. |
| [10] | John, D. K.; Souza, S.; Ferrão, M. F. Overview of Cocaine Identification by Vibrational Spectroscopy and Chemometrics. Forensic Science International 2022, 342. https://doi.org/10.1016/j.forsciint.2022.111540. |
| [11] | Kranenburg, R. F., Verduin, J., de Ridder, R., Weesepoel, Y., Alewijn M., Heerschop, M., Keizers, P. H. J., van Esch, A., van Asten, A. C. Performance evaluation of handheld Raman spectroscopy for cocaine detection in forensic case samples. Drug Testing and Analysis. 2020. https://analyticalsciencejournals.onlinelibrary.wiley.com/doi/10.1002/dta.2993 |
| [12] | Wallace, W. E. Cocaine. National Institute of Standards and Technology. https://webbook.nist.gov/cgi/cbook.cgi?ID=C50362&Mask=80#IR-Spec. |

 Abstract
 Reference
 Full-Text PDF
 Full-text HTML