-
Paper Information
- Paper Submission
-
Journal Information
- About This Journal
- Editorial Board
- Current Issue
- Archive
- Author Guidelines
- Contact Us
Journal of Laboratory Chemical Education
p-ISSN: 2331-7450 e-ISSN: 2331-7469
2022; 10(3): 54-58
doi:10.5923/j.jlce.20221003.02
Received: Oct. 5, 2022; Accepted: Oct. 28, 2022; Published: Nov. 14, 2022

Preparation of a Simple CD or DVD Spectroscope
 Abstract
 Reference
 Full-Text PDF
 Full-text HTML
Veljko Dragojlovic
Wilkes Honors College of Florida Atlantic University, 5353 Parkside Drive, Jupiter, FL, USA
Correspondence to: Veljko Dragojlovic, Wilkes Honors College of Florida Atlantic University, 5353 Parkside Drive, Jupiter, FL, USA.
| Email: |  |
Copyright © 2022 The Author(s). Published by Scientific & Academic Publishing.
This work is licensed under the Creative Commons Attribution International License (CC BY).
http://creativecommons.org/licenses/by/4.0/

In an introductory chemistry class for non-majors, we have successfully used a simple CD or DVD-based transmission spectroscope. Manufacture of spectroscope was simple, took very little time, and required only a CD or DVD disk, a disk envelope and simple tools and supplies. Student-made spectroscope provided spectra of satisfactory quality for an introductory chemistry class.
Keywords: High school/introductory chemistry, Laboratories and demonstrations, Hands on learning, Spectroscopy
Cite this paper: Veljko Dragojlovic, Preparation of a Simple CD or DVD Spectroscope, Journal of Laboratory Chemical Education, Vol. 10 No. 3, 2022, pp. 54-58. doi: 10.5923/j.jlce.20221003.02.
Article Outline
1. Introduction
- Spectroscopy is a common exercise usually introduced in an introductory chemistry course as a part of the study of the structure of an atom. It is an interesting and exciting exercise for students new to science. The beauty of observed spectra stimulates students’ curiosity and is a good introduction to the Bohr model.Commercial teaching spectroscopes are available. However, even though simple spectroscopes are relatively inexpensive, there is still cost involved. Resolution offered by such instruments is not needed in a chemistry course for non-majors. Furthermore, as the enrollment fluctuates there is either a need to purchase new ones or find space to store excess of the existing ones. One solution is the use of inexpensive student-made instruments that students take with them after the class or laboratory exercise is over.Student-made inexpensive spectroscopes have been in use for a long time. Methods for student-made spectroscopes date to as early as 1930 [1]. Numerous methods for making them have been published since [2-10] and a smartphone application utilizing the camera to calibrate the spectroscope was recently reported [11]. All of them require some skill, or at least careful work, to prepare. That takes away from the lab time that could be used more productively in acquiring, analysis and discussion of the spectra. As complexity of manufacture of a spectroscope increases, however slightly, there is an increased possibility that a student will make an error and will have to repeat the preparation. For example, some of the reported procedures require cutting of a DVD into smaller pieces. In our hands that resulted in cracks that spread across the surface and rendered most or all of it unusable. Furthermore, students do not understand immediate purpose of each operation and don’t know what the end product is supposed to look like, even if they have seen a previously prepared instrument. Finally, there is a possibility that a student may suffer minor cuts or other similar injuries when using scissors, various cutters and other tools. That is present in almost any preparation but increases with the increased complexity of the instrument that is being made.A basic instrument for visible spectroscopy consists of a light source, a dispersing device and a detector. Light sources in this exercise were various gas discharge tubes, light bulbs and the light of the full Moon. In a typical spectroscope, dispersing device is either a prism or a diffraction grating. Diffraction gratings are more commonly used and they may be reflection or transmission gratings. CDs and DVDs have reflective coating and are reflection diffraction gratings. Student-made spectroscopes that utilize DVD as reflection grating were described [7,9]. If the coating is removed, CDs and DVDs are converted to transmission gratings. A detector may be the eye of the observer, or a camera if a permanent record is needed. We wanted to keep the design and manufacture of a spectroscope as simple as possible. Of course, quality comes with a cost and one should not expect that a simple spectroscope, such as the one described here, to have the same resolution as commercially available spectroscopes. Nevertheless, the resolution was similar that of the least expensive commercial models on the market. Our goal was to make the simplest spectroscope, which still provides satisfactory spectra for use in the classroom and laboratory instruction.
2. Experimental
2.1. Materials and Supplies
- In our class each student prepared one spectroscope. Therefore, each student needed one CD, one DVD and one CD envelope for them. We obtained better results with black envelopes, which must be made by students. It is a good idea to have some commercially available white envelopes as templates and black paper for students to make envelopes. Tools that are needed are scissors, ruler and utility knife. Supplies necessary for this exercise are black paper and glue or tape, if black envelopes are being made, and adhesive tape.
2.2. CD Spectroscope
- To convert a CD into a transmission diffraction grating, one has to remove its reflective label. This was accomplished by first scoring the label with a utility knife and then using an adhesive tape to lift it off (Figure 1A-C). It is enough to remove only the part of the label that will show through the cutout window to have a usable spectroscope. Next, 10 mm x 35 mm rectangle was cut out of a side of the CD envelope (Figure 1D). For better results, one can prepare an envelope form a black paper. After inserting CD into the envelope, it is a good idea to cut out the center (Figure 1E). Spectroscope is now ready to use.
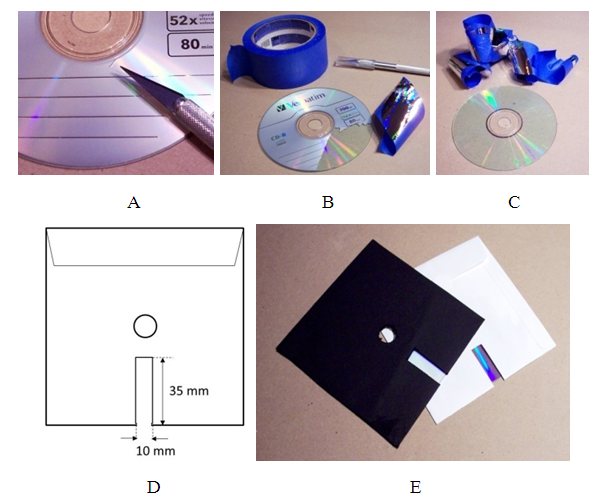 | Figure 1. Preparation of a CD spectroscope. A. Score the label with a utility knife. B. and C. Use an adhesive tape to lift the label off. D. Cut out 1.0 cm x 3.5 cm rectangle out of a CD envelope. E. After inserting CD into the envelope, it is a good idea to cut out the center |
2.3. DVD Spectroscope
- Preparation of a DVD spectroscope was more involved. Some DVDs were not suitable for preparation of a spectroscope and one may need to try several models. DVD has a printed label, which cannot be removed. In addition, the reflective metallic layer is sandwiched between the two polycarbonate disks. Therefore, the two polycarbonate sheets must be separated by inserting a utility knife between them and forcing them apart (Figure 2A). The disk with the printed top is discarded and the metallic foil is removed from the bottom disk by lifting it up with an adhesive tape as described before (Figure 2B).
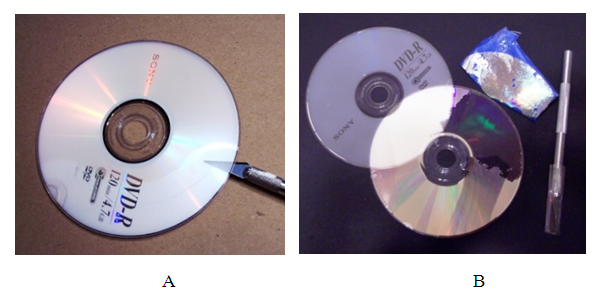 | Figure 2. Preparation of a DVD spectroscope. A. Insert a utility knife between the two polycarbonate sheets and force them apart. B Use an adhesive tape to lift the foil off |
2.4. Experimental Set-Up
- Experimental set-up is shown in Figure 3. It the light source is a discharge tube or a distant object such as the Moon or a distant light bulb, a slit is not necessary. It is needed only for close large light sources (vide infra, Figure 8). All components, light source with or without a slit, DVD/CD and eye or a camera lens should be aligned. They are aligned if the light source is visible through the center hole of the CD/DVD. Then the spectrum is visible in the cut-out rectangle (Figure 3). A slit can be taped to the light source. Usually, students held DVD/CD in one hand and phone in the other. For a hands-free operation, for example if a camera connected to a PC is used to photograph spectra, envelope containing DVD/CD and camera can each be clamped to a stand.
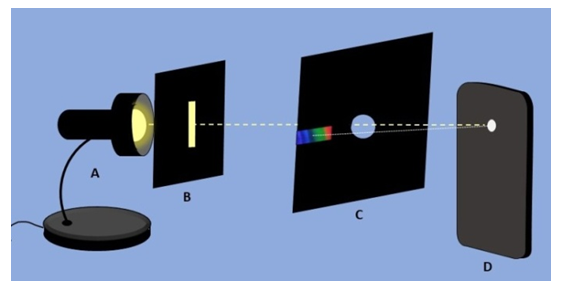 | Figure 3. Experimental set-up. A. Light source. B. If a light source is close to the CD/DVD and relatively large, it should be covered with a slit. C. DVD or CD disk prepared as described above. D. Students used their phones to photograph the spectrum |
2.5. Recording Spectra
- Spectrum can be photographed with a camera in the place of an eye. If a camera is used the light source may overexpose the photograph. Intensity of the light source can be attenuated by using semi-transparent tracing paper, applying multiple layers if necessary, to cover the center hole (Figure 4). Simple design allows for an easy exchange and comparison of a CD and DVD diffraction gratings.
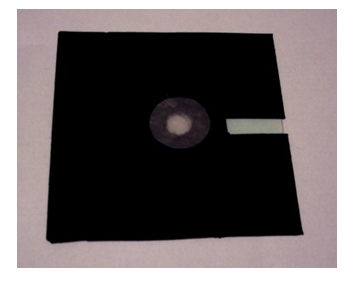 | Figure 4. Intensity of the light source can be attenuated by using tracing paper to cover the center hole |
3. Results and Discussion
3.1. Hazards
- Some discharge tubes, such as mercury lamps, exhibit strong emission in the ultraviolet region. Do not look directly at a mercury lamp – eye damage may result. Use a screen made of tracing paper. Do not look directly at the Sun – eye damage may result, even with use of a filter. A safe way to observe such spectrum is to observe spectrum of the Moon, which is reflected sunlight.
3.2. Comparison of Different Spectroscopes
- DVD spectroscope has a higher resolution compared to a CD spectroscope. Diffraction grating obtained from a DVD has about 1350 lines/mm, while that from a CD 625 lines/mm [7]. DVD spectroscopes are also expected to exhibit better optical properties. While polycarbonate has similar optical properties to glass, it exhibits some absorption in the violet part of the visible spectrum. Since half of the DVD is removed in the course of the preparation of the spectroscope, diffraction grating will have approximately half the thickness of the grating obtained from a CD and would absorb less of the violet part of the spectrum.Spectra obtained by both CD and DVD spectroscopes were satisfactory. Comparison of spectrum of hydrogen photographed through the CD and DVD spectroscopes described here and a commercially available spectroscope is shown in Figure 5.
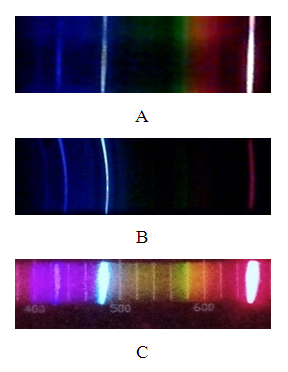 | Figure 5. Photograph of emission spectrum of hydrogen taken A. CD spectroscope, B. DVD spectroscope and C. Commercially available spectroscope (Winsco Model 125) |
3.3. Various Emission Spectra Observed through CD/DVD Spectroscope
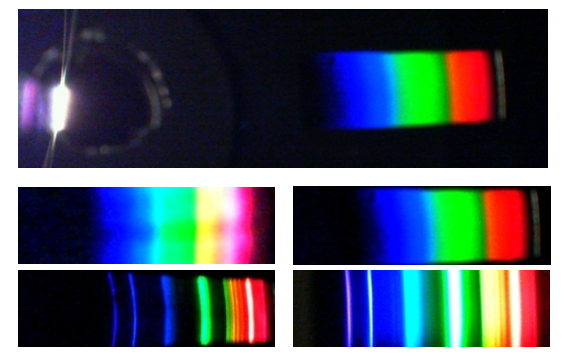
- Various discharge tubes, observed from distance of about one meter provided good quality spectra (Figure 6). In general, it was better to observe spectra with a naked eye. One can see more lines and the contrast is better. Higher resolution and better optical properties of a DVD spectroscope were obvious. For example, with a DVD spectroscope one can clearly see four Balmer lines of hydrogen, while with a CD spectroscope most student reported three and were able to make out the fourth only when told to look for it. Students should notice that spectra of hydrogen (protium) and deuterium appear to be identical. There is a slight shift in wavelengths in the spectrum of deuterium which is not noticeable when using an ordinary spectroscope. Spectra of helium exhibited numerous ghost lines. It should be pointed out to students that dimmer lines next to yellow and purple lines are ghost lines and are not a part of the spectrum of helium. Spectrum of iodine contains multiple closely spaced lines that cannot be resolved by this spectrometer and it appears as a continuous spectrum.
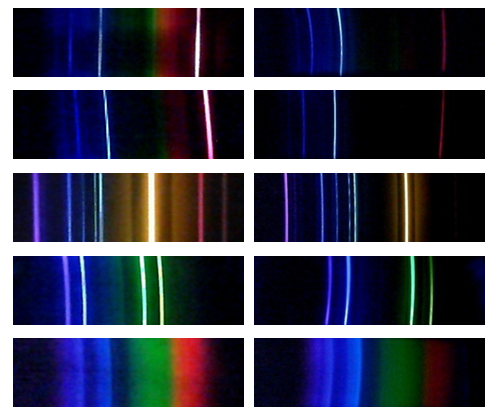 | Figure 6. Emission spectra of discharge tubes from the top: hydrogen, deuterium, helium, mercury and iodine. Spectra photographed through a CD spectroscope are on the left and those photographed thorough a DVD spectroscope are on the right |
 | Figure 7. Photograph of emission spectrum of helium before processing (left) and after (right) |
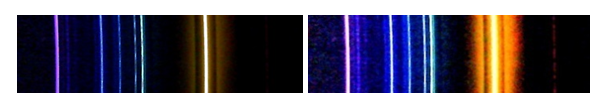
 | Figure 8. Spectrum of the Moon viewed through the spectroscope (top). Enlarged spectra obtained through CD (left) and DVD (right) are shown below |
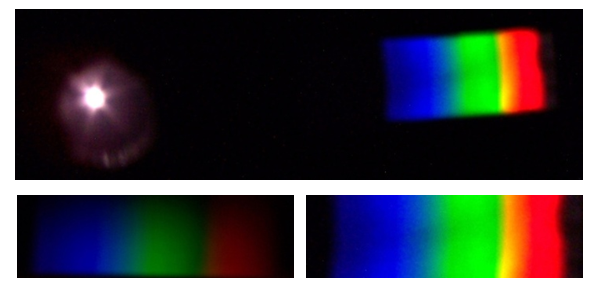
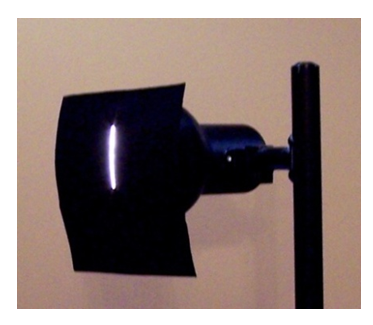 | Figure 9. When observing spectrum of a light bulb, one can place a slit on the object itself |
 | Figure 10. Spectrum of a light bulb viewed through the spectroscope (top). Emission spectrum of an incandescent light bulb is shown in the middle and a compact fluorescent light bulb at the bottom. Spectra photographed through a CD are on the left and those photographed thorough a DVD are on the right |
3.4. Absorption Spectra
- The absorption spectrum of a substance is obtained by passing light with a continuous spectrum through a substance. An example is absorption spectrum of GE Reveal 60 light bulb shown below (Figure 11). The hot tungsten filament of the light bulb emits a continuous spectrum of visible light. The glass of the GE Reveal 60 lightbulb contains neodymium oxide, Nd2O3, which absorbs light and creates the absorption bands in the spectrum. The absorption bands in this case are broad bands due to electron transitions in molecule, as opposed to discrete lines due to electron transitions in the atoms of a gas. Fraunhofer lines in the spectrum of the Moon is an example of the line absorption spectrum (Figure 8).
 | Figure 11. Spectrum of GE Reveal 60 lightbulb. Note absorption bands in the yellow part of the spectrum |
4. Conclusions
- An inexpensive spectroscope that is easily prepared has been constructed and incorporated into a laboratory exercise. As the cost is minimal, students can be allowed to keep the ones they made. It may be used to observe and photograph additional spectra in case a homework is assigned. It will also be a memento of the class they took and, in this case where students taking the class were non-science majors, it will hopefully maintain their interest in science. In a more advanced class this exercise can be used as an introduction into making of a more complex spectroscope.
ACKNOWLEDGEMENTS
- I thank Wilkes Honors College students enrolled in CHM 1020C course for taking part in this exercise.