-
Paper Information
- Paper Submission
-
Journal Information
- About This Journal
- Editorial Board
- Current Issue
- Archive
- Author Guidelines
- Contact Us
Journal of Laboratory Chemical Education
p-ISSN: 2331-7450 e-ISSN: 2331-7469
2021; 9(4): 51-56
doi:10.5923/j.jlce.20210904.01
Received: Nov. 2, 2021; Accepted: Nov. 29, 2021; Published: Dec. 15, 2021

Online Lab for High School Students: Calibration Curve Using Fluorescence of a Yellow Highlighter Solution
 Abstract
 Reference
 Full-Text PDF
 Full-text HTML
Nitza V. Falcón-Cruz1, Nathaly Vergara-Toro1, Alondra Brito-Pérez2, Daniel Rivera3, Anamaris Meléndez3, Idalia Ramos3, Rolando Oyola1
1Department of Chemistry, University of Puerto Rico-Humacao, Humacao, Puerto Rico
2Department of Biology, University of Puerto Rico-Humacao, Humacao, Puerto Rico
3Department of Physics and Electronics, University of Puerto Rico-Humacao, Humacao, Puerto Rico
Correspondence to: Rolando Oyola, Department of Chemistry, University of Puerto Rico-Humacao, Humacao, Puerto Rico.
| Email: |  |
Copyright © 2021 The Author(s). Published by Scientific & Academic Publishing.
This work is licensed under the Creative Commons Attribution International License (CC BY).
http://creativecommons.org/licenses/by/4.0/

The social distancing measures introduced to prevent the spread of COVID-19 have led to the on-the-fly redesign of summer research programs. In our summer research program for high school students, as part of a National Science Foundation grant, students from grades 10 and 11 visited on campus laboratories and conducted materials science experiments using real instrumentation under the guidance of faculty researchers. They also took part in training workshops, seminars, data analysis, and prepared written reports and a final oral presentation. However, with the pandemic, the experiments were modified so that they could be done at home with basic tools and reagents, a situation full of challenges, since reagents and materials must be safe for the students and other family members. In this work, we report on an experiment to introduce the students to basic absorption and fluorescence spectroscopy concepts. A quantitative analysis of a yellow highlighter solution using fluorescence is presented.
Keywords: Fluorescence, Calibration curve, High School lab experience, Online experiments
Cite this paper: Nitza V. Falcón-Cruz, Nathaly Vergara-Toro, Alondra Brito-Pérez, Daniel Rivera, Anamaris Meléndez, Idalia Ramos, Rolando Oyola, Online Lab for High School Students: Calibration Curve Using Fluorescence of a Yellow Highlighter Solution, Journal of Laboratory Chemical Education, Vol. 9 No. 4, 2021, pp. 51-56. doi: 10.5923/j.jlce.20210904.01.
Article Outline
1. Introduction
- The COVID-19 pandemic has changed the way we teach science laboratories and shown the need to use different approaches. [1-3] A summer research program for high school students, from grades 10 and 11 have been organized since 2005 by the NSF-funded program, UPR-PENN Partnership of Research and Education in Materials, at the University of Puerto Rico at Humacao. The program includes a week of immersion in hands-on laboratory experiences. Under normal circumstances, in a face-to-face format, the students visited the research laboratories at the university to conduct the experiences. During the pandemic, all activities had to be made virtual. Therefore, we modified the laboratory experiences by preparing kits with everything they needed to conduct the experiments. The safety of the students and other family members was a major concern in designing the kits, as students would perform them without the physical supervision of a scientist. Here, we describe one of the experiments that was adapted during Summer 2021. The experience was programmed for a four-hour laboratory session and 3 hours to write a report. The experiment introduces the concepts of absorption and emission in the quantitative analysis of substances. For this, the student is first taught the concept of decomposition of white light in its colours and the relationship that exists between energy, wavelength, and colour. Then the concept of the Jablonski diagram is presented, the processes that occur after absorbing visible light are explained and fluorescence concepts are presented. Finally, a quantitative work of yellow highlighter solution was performed to introduce a calibration curve. These basic spectroscopy methods are a core part of the undergraduate curriculum in chemistry departments and in degree programs like materials science, biology, and bioengineering. [4] Our experience is that introducing scientific experiences as early as possible to high school students results in higher retention and graduation rates during undergraduates’ university career.
2. Experimental
- The reagents to be used are safe and are available in the students' homes. However, for convenience and safety, we prepared a kit that was mailed to each participant. Figure 1A shows the contents of the kit with the right quantity of reagents necessary to carry out the experiment. The kit included: (1) 10 mL of yellow highlighter solution, (2) 50 mL of deionized water, (3) at least six calibrated plastic vials, (4) one 3D printed spectrometer with cap, (5) two plastic cells, (6) two droppers, (7) one 5 mm white light emitting diode (LED), (8) one 5 mm blue (395 nm) LED, (9) one 9 V (CR2032) battery, (10) battery holder, and (11) two alligator cables. In addition, the students must have a cellular or digital camera available to take photos.The yellow highlighter dye solution (Sharpie brand) is used as an analyte and was prepared in the laboratory by extracting the filter inside the highlighter and transferring it to a beaker with deionized water. The dye was transferred from the filter to the water within few minutes. The resulting solution shows an intense green-yellow colour because of the room light. The 3D printed spectrometer is a cost-effective way to introduce students to spectroscopy concepts. [5,6] Several prototypes are available in the literature and internet for absorption and fluorescence measurements. [3-5,7-18] The degree of accessibility and complexity of the 3D models is very broad. Scheeline described basic concepts to build a spectrometer. [19] The integration of the detector into the 3D printed systems imposes a higher complexity. For example, some models include a web camera while others use a CCD camera or cell phone as detectors. The use of a cell phone as a detector is a great option because it is available and accessible. Here in we propose a simple but efficient 3D printed spectrometer. Figure 1B – 1C shows the inexpensive 3D printed spectrometer designed with a CAD software. The printing was through a Fusion Deposition Modelling (FDM) process at 200 μm layer height and 100% infill. The dimensions of the 3D model included in the kit are 45 mm x 50 mm x 25 mm. This spectrometer has a cell compartment and two 5mm holes to install two light sources: a white LED and a blue LED. The white LED is at 180° relative to the slit for absorption analysis (Figure 1B) while the blue LED (395 nm) is at 90° for emission analysis (Figure 1c). Figure 1E shows the spectrometer’s internal slit of 6 mm x 0.4 mm that allows to pass the light towards the grating (Rainbow Symphony, Diffraction Grating 13,500 lines Film Sheets) and finally another opening of 42 mm x 0.5 mm where the student observes the light and can take the picture for later analysis. To assist educators in fabricating 3D-printed spectrometer, all device designs are available in STL file formats upon email request. Cable connections are as follows: the battery holder has two cables, positive and negative polarity which should be identified by the teacher previously. The red alligator cable is connected to the positive terminal of LED (long leg) and the black alligator to the negative terminal (short leg). The other ends of the alligator cables are connected to the battery positive (red) and negative terminals (black). Figure 1F and 1G shows the complete setup with the blue and white LEDs On, respectively. Also, Figure 1F and 1G it is shown the positive cable from the battery label with red line. To take the photos, the setup must be placed with the 3D spectrometer at the edge of a table or an elevated plane surface. The grating slit must be facing away from the table so the students can hold their phone in front of the grating. There must be enough space to move the cellphone in horizontal and vertical motions. Since not all cellphone cameras work the same way, the student must look for the distance between the cellphone and 3D spectrometer that works best for them. The blue LED must be on while searching for the best angle to take the photos of the solutions. The instructor should provide sample photos for students to use as reference. Analysis was performed using freely available, either ImageJ software [20], cellphonespecRev software [5], or Qtiplot software.
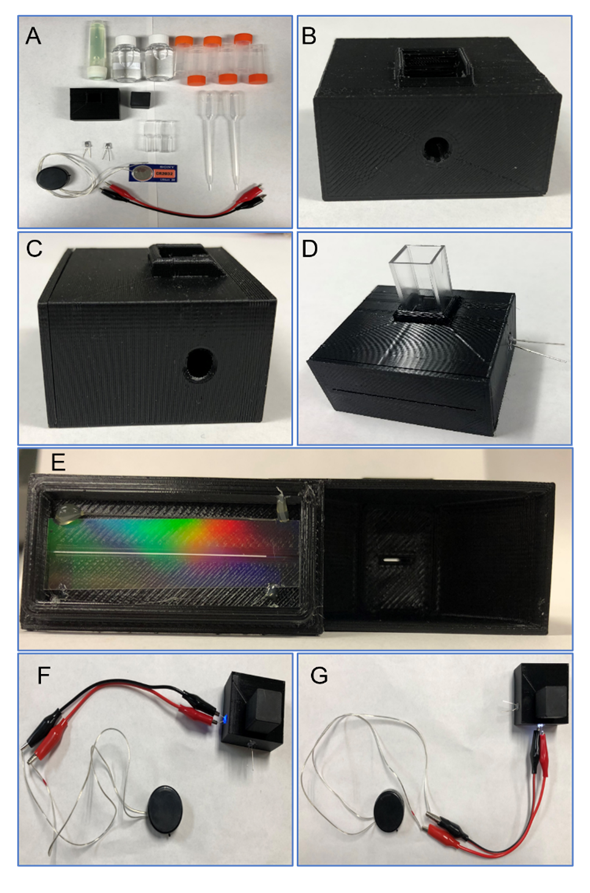 | Figure 1. A) kit with basic materials to perform the experiment: form top left to right: highlighter solution, deionized water, calibrated vials, 3D spectrometer, cap, plastic cells, droppers, LEDs, battery holder, battery, and alligator cables. The 3D printed spectrometer views: B) back view showing white LED position, C) side view showing blue LED position, D) front view with cell, blue LED and showing opening of external slit, E) inside slit and grating, F) complete setup with blue LED On, and G) white LED On. See text for details |
2.1. HAZARDS
- Personal protective equipment including lab coats, gloves, and safety glasses should be worn by students when preparing solutions and completing experiments. These items were also included in a second kit that was also mailed to the student. The Sharpie highlighter contains 8-Hydroxypyrene-1,3,6-trisulfonic acid trisodium salt (PubChem CID 61388, CAS 6358-69-6) as yellow dye. The packaging label defines that it conforms to ASTM-D-4236, nontoxic. At the end of the experiment the dye solution can be dispose with running water.
3. Results and Discussion
- Several clear and well-written papers concerning colour phenomena have appeared in the chemical education and physics education literature. The scientific literature abounds with theoretical and applications-oriented discussions of colour science, reprographics, and dye chemistry. Many videos are available on the internet that could be used as a primary source to present the concept of visible light. However, hands-on experiences help the student grasp better the concepts. Therefore, in this part, the student measured the dispersion of white light into the visible colours using a white LED and the spectrometer with a plastic cell filled with water. This has the aim of introducing the student with the principles of light dispersion into its wavelengths and the relationship between colour, wavelength, and energy. Figure 2 shows a photograph of the visible colours obtained using the 3D printed spectrometer. A clear colour pattern that is well-known as rainbow can be seen.
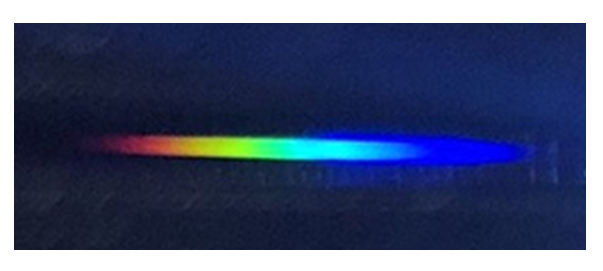 | Figure 2. Photo of the 3D spectrometer signal from a 1.0 cm2 cell filled with water. The light source is a white LED |
3.1. Quantitative Analysis of Yellow Highlighter Using Fluorescence
- Before sending the kit to the students, we validate the yellow highlighter quantitative analysis using research grade instrumentation. Yellow highlighter contains pyranine dye (8-Hydroxypyrene-1,3,6-trisulfonic acid trisodium salt, HPTS, C16H7Na3O10S3, Scheme 1), but some brands also use fluorescein.
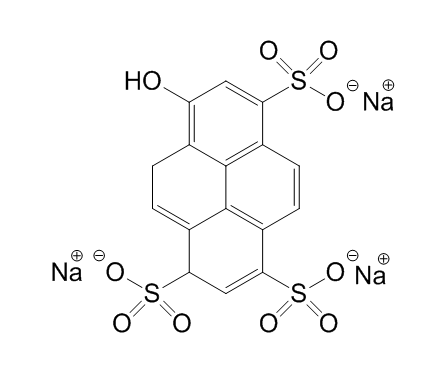 | Scheme 1. Molecular structure of pyranine dye 8-Hydroxypyrene-1,3,6-trisulfonic acid trisodium salt, HPTS |
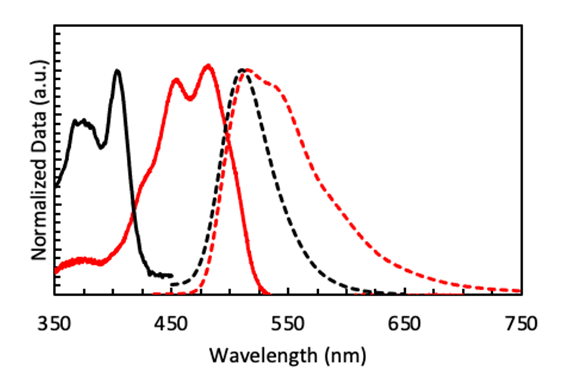 | Figure 3. Absorption (solid lines) and emission spectra (dashed lines) of yellow highlighter in water (black) and fluorescein in ethanol (red) |
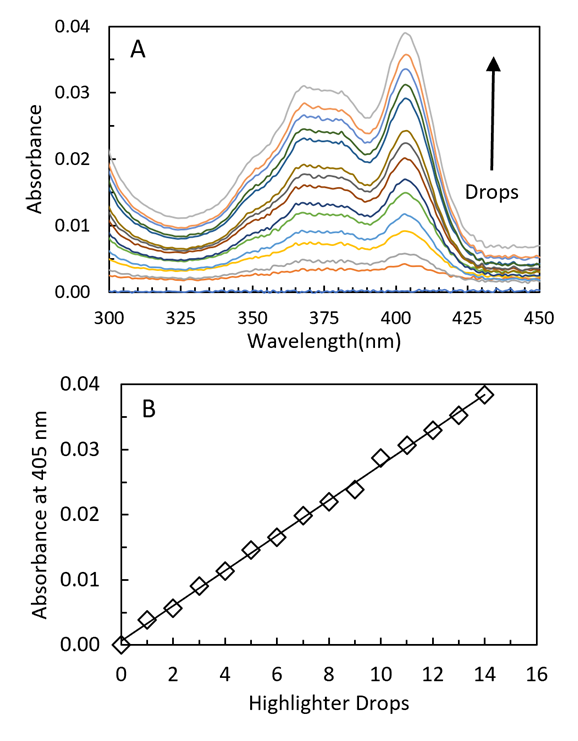 | Figure 4. A) Absorption spectra of yellow highlighter in water at increasing number of drops from stock solution. B) Beer-Lambert law for the 405 nm absorbance response at different number of drops of yellow highlighter stock solution. The linear function is y = x*(2.70 ± 0.03) x 10-3 + (6 ± 3) x 10-4 with R2 = 0.9980 |
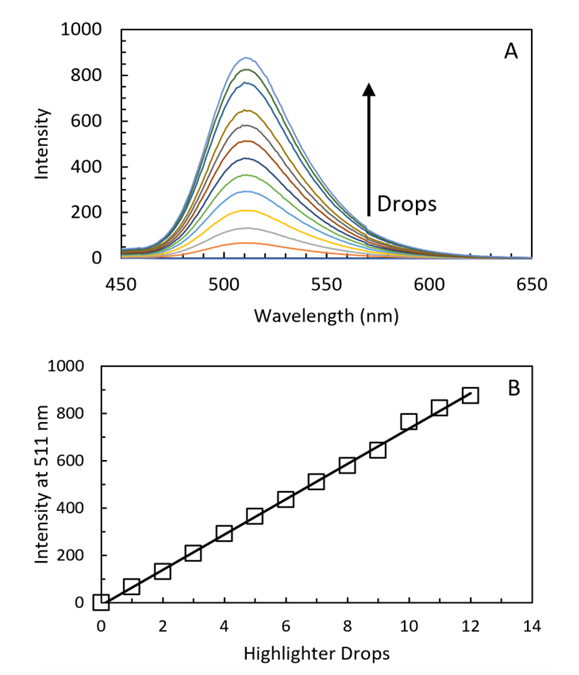 | Figure 5. A) Emission spectrum of yellow highlighter at different number of drops in 2.00 mL of water. B) Calibration curve for the yellow highlighter fluorescence to determine the number of dye’s drops in a sample. Excitation at 400 nm. The linear function is y = x*(74.7 ± 0.9) – (10 ± 6) with R2 = 0.9984 |
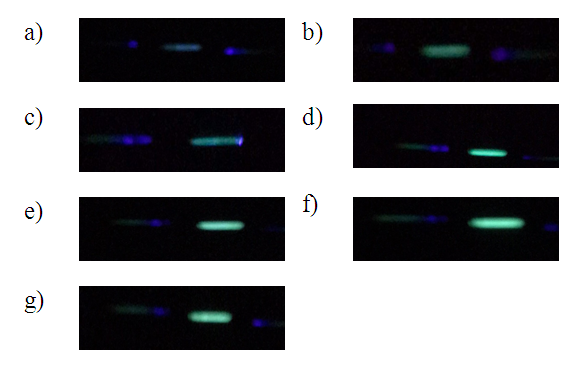 | Figure 6. Photos obtained by high school student for a) blank, b) 2, c) 4, d) 8, e) 10, and f) 12 drops of the yellow highlighter stock solutions and g) unknown solution |
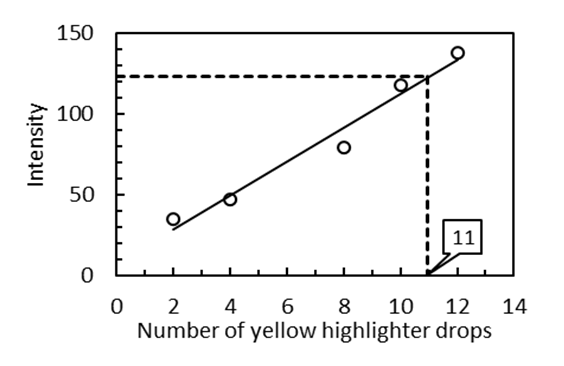 | Figure 7. Calibration curve using the 3D spectrometer. The linear regression function is y = x*(10.9 ± 0.8) + (4 ± 6) with R2 = 0.9791 |
4. Student Report
- At the end of the experiment the students prepare a brief technical report with their findings. To promote collaborative work, it is advised to divide the students in groups to write the report. Also, we encourage the students to write the report in a research style format. The introduction should include information about light and its properties, a description of the Jablonski diagram, the difference between absorption and emission, how we can use emission for quantitative analysis?, what analyte is under test?, what is a calibration curve, and how it can be used for quantitative analysis? The report also includes a Materials and methods were the students lists the materials used during the experiment. It is advised to expose the students to Safety Data Sheets. In methods, the student describe how they did the experiment in detail. A result and discussion section follows where the student should present and describe their findings. In this section the students should include pictures and graphs. Also, the students should include discussion about the change in color intensity observed as more drops of the yellow marker solution were added, present the calibration curve with linear regression values, and the estimated number of drops where present in the unknown solution. A conclusion section is presented were the students resume the aim of the experiment and its findings. Finally, a references section resumes any information source that the students use.
5. Conclusions
- Here, we prove a simple experiment to introduce high school students to basic concepts of absorption and emission spectroscopy. Also, quantitative analysis using fluorescence was introduced by determining the number of drops of a yellow highlighter in an unknown solution. This experiment can be implemented to determine pyranine (D&C Green #8) in other commercial liquids. The students performed a hands-on experience with safe reagents at their home under online supervision, a major impact under the current COVID-19 pandemic situation.
ACKNOWLEDGEMENTS
- We gratefully acknowledge financial support from the NSF-DMR-2122102. Also, we acknowledge the summer 2021 “Experimenta con PREM” high school participants.
Disclosure
- No potential conflict of interest was reported by the authors.