Oleg Sannikov, Eric Ye, B. Mario Pinto, Paul Saunders, Nabyl Merbouh
Simon Fraser University, Department of Chemistry, 8888 University Drive, Burnaby, Canada
Correspondence to: Nabyl Merbouh, Simon Fraser University, Department of Chemistry, 8888 University Drive, Burnaby, Canada.
| Email: |  |
Copyright © 2020 The Author(s). Published by Scientific & Academic Publishing.
This work is licensed under the Creative Commons Attribution International License (CC BY).
http://creativecommons.org/licenses/by/4.0/

Abstract
This paper introduces undergraduate students to advanced NMR techniques to help elucidate the structures of endo and exo norbornene isomers formed during the Diels-Alder reaction between cyclopentadiene and methylcyclopentadiene with maleic anhydride. The microwave assisted isomerization of the norbornene derivatives resulted in a mixture of endo and exo isomers that were separated and analyzed using advanced NMR spectroscopy techniques, with a focus on the spectral interpretation and unequivocal assignment of the endo and exo stereoisomerism when possible.
Keywords:
Diels-Alder Reaction, Methylcyclopentadiene, Endo/Exo Isomerism, Complex Mixtures, Nuclear Magnetic Resonance Analysis, Nuclear Overhauser Effect (NOE)
Cite this paper: Oleg Sannikov, Eric Ye, B. Mario Pinto, Paul Saunders, Nabyl Merbouh, Introducing Complex NMR Mixtures at the Undergraduate Level: Isomerization, Separation and Analysis of the Diels-Alder Adducts from the Reaction of Methylcyclopentadiene and Maleic Anhydride (Part II), Journal of Laboratory Chemical Education, Vol. 8 No. 3, 2020, pp. 39-80. doi: 10.5923/j.jlce.20200803.01.
1. Introduction
The Diels-Alder reaction between cyclopentadiene (Cp) and maleic anhydride (MA) is well described in laboratory manuals and textbooks at the undergraduate level and represents a simple and effective teaching tool in organic chemistry. [1–3] However, at the undergraduate level, this reaction suffers from a lack of diversity, as too often this reaction generates only a single isomer, the endo isomer 1en, due to the symmetry of the staring materials as well as the reaction conditions (Figure 1).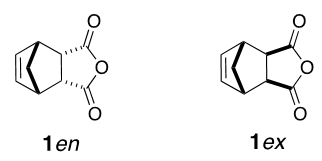 | Figure 1. Diels-Alder adducts resulting from the reaction between cyclopentadiene and maleic anhydride |
In part I of this work, we showed that methylcyclopentadiene (MeCp) can generate a complex mixture of isomers during the Diels-Alder reaction with maleic anhydride, yielding two pairs of enantiomers 2en and 3en (Figure 2), thus exposing the students to a more challenging spectral interpretation training. [4]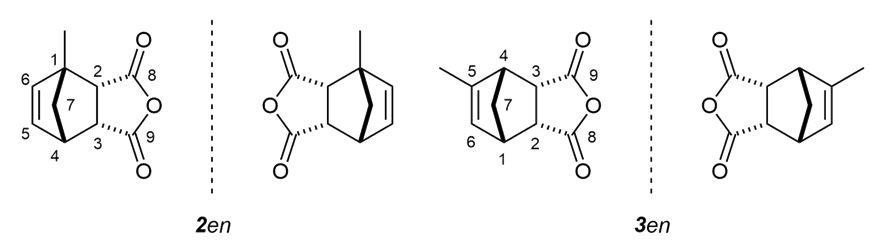 | Figure 2. Kinetic Diels-Alder adducts 2en and 3en resulting from the reaction between methylcyclopentadiene isomers and maleic anhydride |
There, we used that case study to introduce undergraduate students to the analysis of complex and inseparable mixtures and taught them how to elucidate each structure using advanced NMR techniques and the separation of isomers using chemical modifications. The complete structure elucidation of the Diels-Alder reaction adducts and their L-alanine derivatives was accomplished using 1H, 13C, APT, HSQC and HMBC NMR spectroscopy experiments in all cases. However, we assumed the stereochemistry of all adducts to be endo as the Diels-Alder reaction was done at low temperature (Kinetic control).In the present paper we will discuss the assignment of the endo and exo configuration of the Diels Alder adducts, and introduce the students to tools to help answer to following question: How would you confirm the exo and endo configuration of these Diels-Alder products?Since we have previously shown that students could readily acquire the exo and endo cis-norbornene-5,6-dicarboxylic anhydride isomers using microwave irradiation, followed by their separation using chromatography on silica gel, [5] in this study we were able to use a similar approach to yield all the major isomers of 1- and 5-methyl-5-norbornene-2,3-dicarboxylic anhydride. To start this investigation, the students will begin with the synthesis and full characterization of all the Diels Alder adducts resulting from the reaction of Cp and MeCp with MA, followed by a familiarization with 1D and 2D NOESY experiments using simple norbornene systems before moving to the more complex derivatives.
2. Experimental
General. All reagents and solvents were purchased from Sigma-Aldrich and used without further purification. All NMR spectra (1H, 13C, APT, COSY, HSQC, HMBC) were recorded on a Bruker Avance III 400 MHz or a Bruker Avance III 500 MHz spectrometer and were referenced to the residual chloroform (CDCl3) resonance at 7.26 ppm for proton and 77.16 ppm for carbon. All 1D and 2D NOESY spectra were recorded on a Bruker Avance II 600 MHz spectrometer. All microwave irradiations were performed on a 6 mL scale using toluene as a solvent in an Anton Parr Monowave 50 at 200°C in a 10 mL capped vial fitted with a magnetic stir bar. All chromatography separations were performed on a Teledyne Combiflash system using ethyl acetate/hexanes mixtures as eluent.Safety Precautions. Before performing the experiments, students should familiarize themselves with the hazards of the reagents used by consulting their respective SDS. Care should be taken during the microwave irradiation of the norbornene derivatives, and the pressure of the reaction carefully monitored. The microwave, CombiFlash apparatus and the rotary evaporator should be placed in a well ventilated area, preferably in a fume hood or under a secondary air extractor to minimize contacts with chemical fumes.
2.1. Synthetic Procedures
All synthetic procedures were optimized to allow the students to perform each reaction and purification either within a single four hour laboratory period, or within two laboratory periods (eight hours) when an overnight reaction was required.2.1.1. Cis-5-norbornene-endo-2,3-dicarboxylic anhydride (1en) and cis-5-norbornene-exo-2,3-dicarboxylic anhydride (1ex) were purchased from Sigma-Aldrich and used as is.2.1.2. The mixture of endo-1-methyl-5-norbornene-2,3-dicarboxylic anhydride (2en) and endo-5-methyl-5-norbornene-2,3-dicarboxylic acid anhydride (3en) was prepared according to the procedure previously described. [4]2.1.3. The L-alanine derivatives of 4en, 5en, 4ex and 5ex were prepared according to the procedure previously described. [5]
2.2. Microwave Irradiation Procedure
A mixture of 2en and 3en was dissolved in toluene (6 mL) and the solution was irradiated in an Anton Parr Monowave 50 at 200°C for 15 minutes with constant stirring. After irradiation, the toluene was removed under vacuum and the reaction mixture was purified using a Teledyne Combiflash system using ethyl acetate/hexanes mixture as eluent to yield two fractions containing compounds 2en and 3en and compounds 2ex and 3ex, respectively (See supplementary information).
2.3. NOESY Spectra Acquisition
Proton 1D and 2D NOESY spectra were recorded on a Bruker Avance II HD 600 MHz spectrometer equipped with a quadruple nucleus cryoprobe. All spectra were acquired at 298K. 1D selective NOESY spectra were acquired with the Bruker pulse sequence selnogpzs which significantly suppresses the zero quantum coherence signals resulting from J-coupling between the selectively irradiated proton and the J-coupled proton. [6] All mixing times were set to 0.5 sec. A total of 32 scans were collected for each 1D NOESY spectrum. Similarly, the 2D NOESY spectra were acquired with the suppression of zero quantum coherence, using the sequence noesygpphzs. Eight scans were collected for each of the 256 increments in each 2D NOESY experiment.
2.4. Spectral Processing and Deconvolution
The Mnova software package was used to process spectra. 1D NMRs were phased and baselines were corrected by use of the Whittaker smoother algorithm. Spectra were referenced to CDCl3 7.26ppm (singlet) for 1H and 77.16 ppm (triplet) for 13C. Exponential apodization was used to increase signal to noise ratio [7] and no zero filling was used. Global spectral deconvolution (GSD) was used to filter off solvent and impurities signals with a refinement level of 2 cycles. [8] 2D spectra were phased and sin-bell apodization (0°) was used for COSY and HMBC, sin-square apodization (90°) was used for HSQC. Baselines were corrected by use of the Whittaker smoother algorithm in both axes for all 2D spectra.
3. Results and Discussion
3.1. 5-norbornene-2,3-dicarboxylic Anhydride Derivatives
One of the easiest ways to tackle the endo and exo isomerism assignment for students is to start with the ubiquitous spectra of 5-norbornene-2,3-dicarboxylic anhydride isomers 1en and 1ex. From commercially available 1en and 1ex, students are able to compile all the necessary NMR spectra (1H, 13C, APT, COSY, HSQC, HMBC) and assign all the relevant peaks in each of the 1H and 13C-NMR spectra.As shown in the 1H-NMR spectra of 1en and 1ex displayed in Figure 3, the apparent difference between the two isomers in the 1H-NMR spectrum consists of the chemical shift of protons H3 /H9 as well as H8a and H8b. For the student, note that H8a and H8b have different chemical shifts because they are in different environments. In later courses, they will learn that they are diastereotopic. The endo isomer signals tend to be more deshielded compared to the exo isomer. While these spectra can confirm the difference between the endo and exo isomers, they are however not enough to allow the students to unequivocally assign the stereochemistry of each isomer.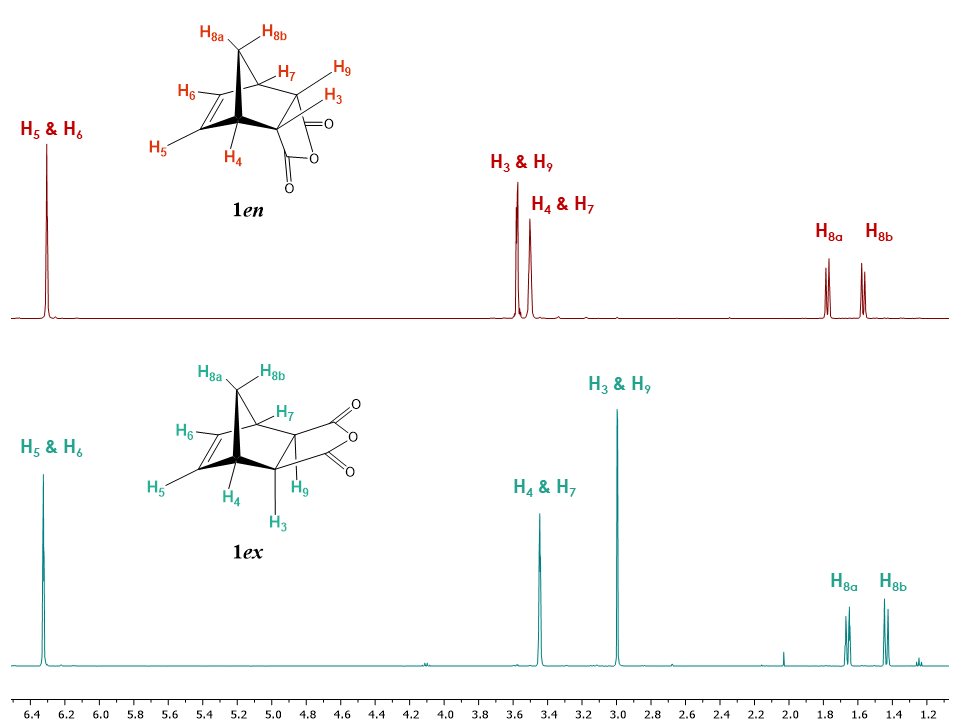 | Figure 3. Stacked plot of the 1H NMR spectra of 1ex and 1en isomers of cis-5-norbornene-2,3-dicarboxylic anhydride (Recorded in CDCl3, 1.2 to 7.0 ppm region of the spectra shown only for clarity purpose) |
Therefore, to clearly determine the configuration of the two isomers we introduced the students to nuclear Overhauser effect spectroscopy (NOESY), an important tool often used to identify stereochemistry. Could 1D and 2D NOESY experiments allow the unequivocal structure interpretation using the correlation between NOE enhancements and their 1/r6 dependence of internuclear distances between protons, [9] a question the students will attempt to answer in the following investigation.
3.1.1. Cis-5-norbornene-endo-2,3-dicarboxylic Anhydride (1en)
The 2D NOESY spectrum shows diagonal peaks and cross peaks; with cross peaks connecting resonances from nuclei that are spatially close rather than those that are coupled to each other through-bonds (Figure 4).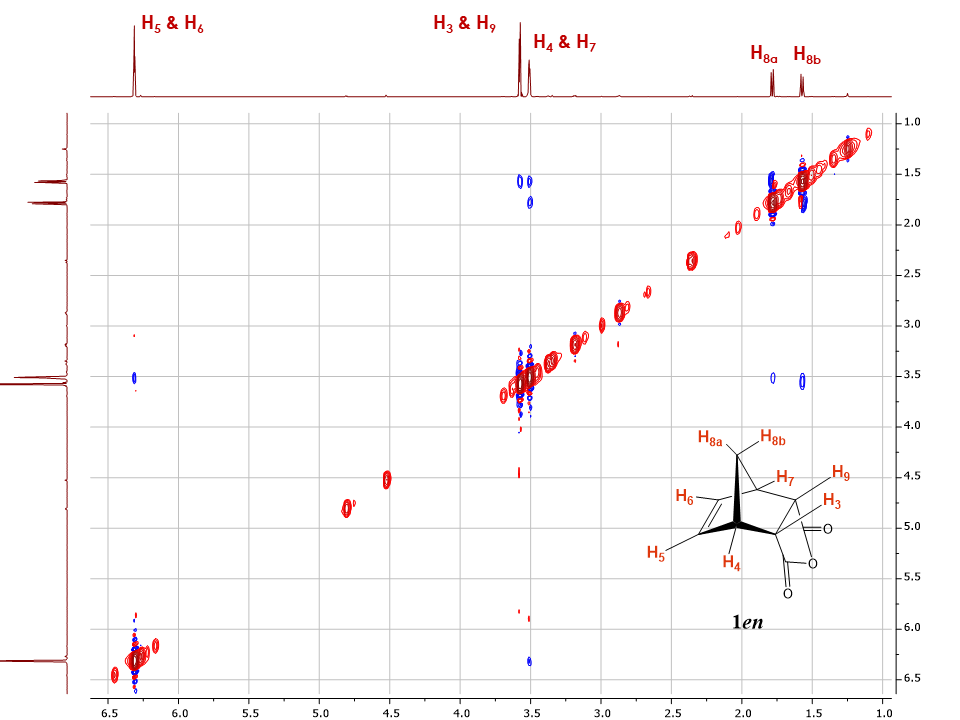 | Figure 4. 2D NOESY spectrum of 5-norbornene-endo-2,3-dicarboxilate anhydride 1en (Recorded in CDCl3, 1.0 to 7.0 ppm region of the spectra shown for clarity of purpose) |
The 2D NOESY spectrum of 5-norbornene-endo-2,3-dicarboxylic anhydride 1en displayed in Figure 4 shows several correlations between protons. As an example, both H8 protons show correlations with H4 and H7 while only one of them shows a correlation with H3, H9. Such observed correlations not only allow the students to differentiate between H8a and H8b but also hints at the possible endo configuration for isomer 1en. Other important correlations are observed between H4, H7 and H5, H6 as well as between the diastereotopic protons H8a and H8b.Theoretically, more correlations could be observed but do not appear. As an example, the correlation between H8a, H6 and H5 should be expected. Nevertheless, due to the relative longer distance compared with that between H8a and H4, the signal for this correlation is too weak to be observed under the experimental conditions (e.g. limited number of scans). This is a limitation of the 2D NOESY experiment that students should be made aware of.To further confirm the observed correlations, we introduced the students to the 1D NOESY experiments (Figure 5). The 1D NOE spectrum shows a negative or positive change of NMR signal intensity when another resonance signal is saturated by irradiation with a radiofrequency field. The change in resonance intensity is a consequence of cross relaxation between the irradiated nucleus and its neighbors in space. [6]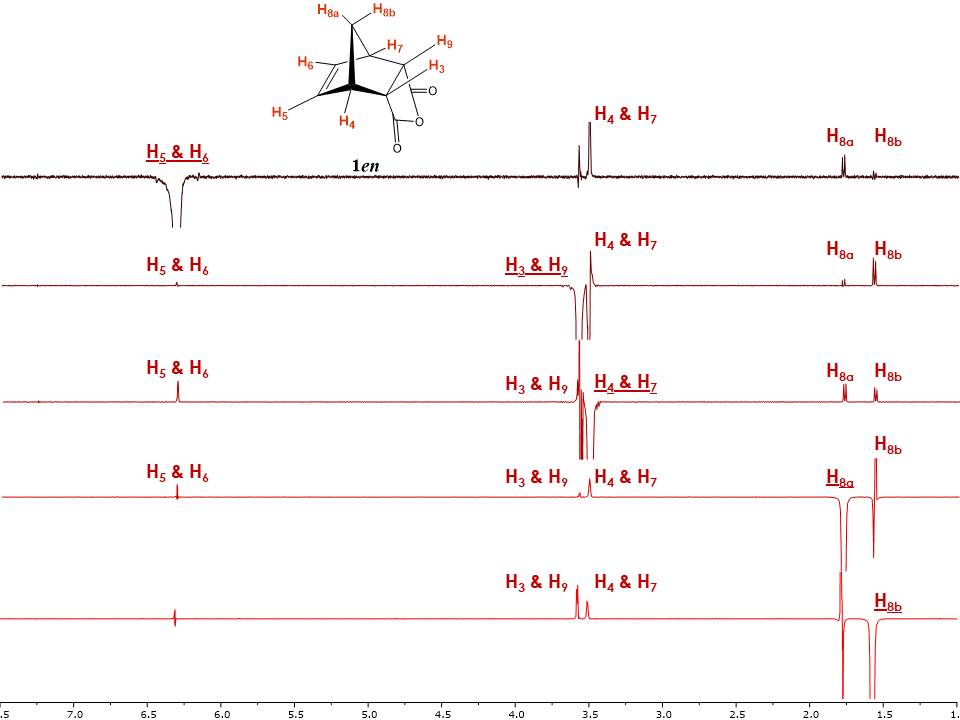 | Figure 5. Stacked plot for the 1.0-7.0 ppm region of 1en 1D NOESY spectra with marked irradiated protons (Underlined). Irradiated signals are shown in negative phase with all positive phase signal considered true NOE, while false NOE signals show both positive and negative phases |
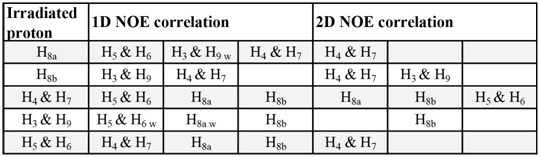
As an example, when protons H5 and H6 were irradiated, a positive nuclear Overhauser effect was observed for H8a; H3 and H9 as well as H4 and H7 for isomer 1en (Figure 5). The irradiation of H8b as predicted showed a positive nuclear Overhauser effect for H3 and H9 as well as for H4 and H7. For the most part the correlations seen in the 2D NOESY were observed in the 1D NOESY spectra with the addition of a new system in which protons H8a, H5 and H6 were found to be spatially close.Interestingly, protons H5 and H6 and H3, H9 also showed nuclear Overhauser effects, although the NOE signals are much weaker, which suggests a relatively longer distance between these nuclei or possibly relayed effects through other protons which are close. Therefore, particular attention has to be given to the NOE intensities and the phase of the peaks. Most NOE experiments are efficient at determining the relative proximity between protons in space (typically 5 Å) based on the strength of the observed NOE intensity, making them appropriate for most structural studies. [10]To further attempt to explain these observed correlations, students can be provided with the crystal structure of 1en, and asked to investigate the atom proximity in the structure. With the help of Figure 6, student can easily correlate the NOE intensity with the distance between the atoms. Indeed, the shortest distance between H5 and H4 (2.6 Å) resulted in a strong NOE, while a longer distance with H8a (3.5 Å) and H3 (4.1 Å) resulted in a weaker NOE, and even weaker NOE with H8b distant by 4.3 Å. (Students should be cautioned about using a crystal structure to explain a phenomenon observed in solution, however, due to the rigidity of the system studied the distances deduced from the crystal structure, will still follow the trend seen in solution.)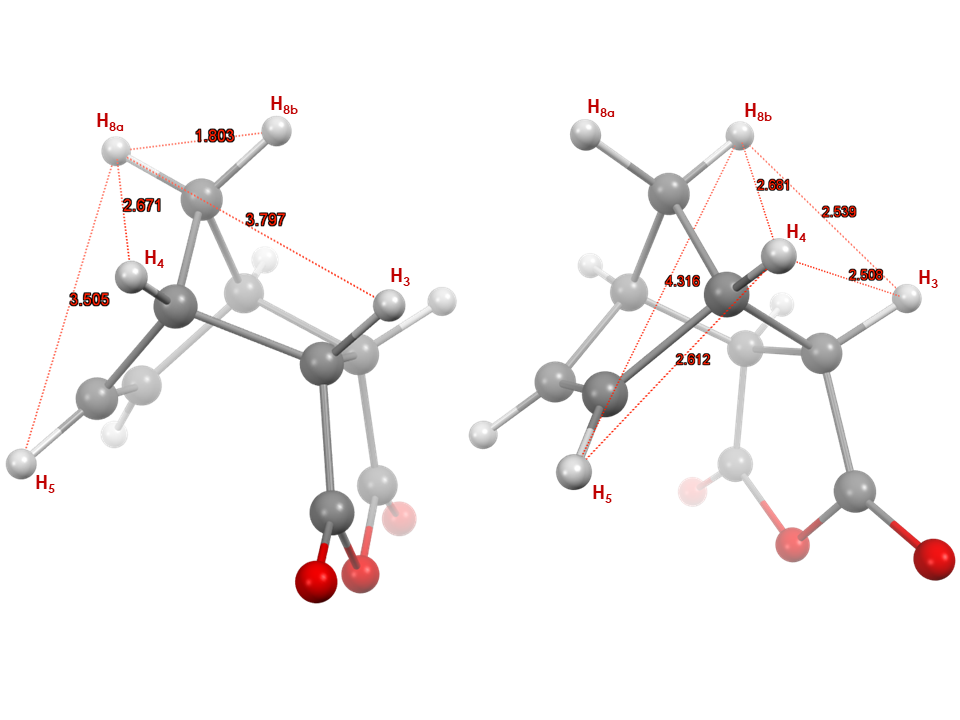 | Figure 6. Crystal structure of 1en, left structure showing distances between H8a to H5, H4, H3, H8b and right structure showing distances between H8b to H5, H4, H3, and between H5, H4 and H4, H3 in Angstroms. (CCDC Database Identifier: NBORAN12, Deposit Number: 1508074) |
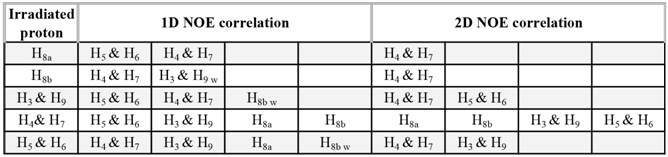
To undergraduate students, processing 1D NOESY experiments may appear to be demanding, so they should be encouraged to organize the observed correlations in a table (Table 1) as well as to focus their initial efforts on the strong NOEs.Table 1. 1D and 2D NOE observed correlations for 5-norbornene-endo-2,3-dicarboxylic anhydride 1en. (w stands for weak observed NOE)
 |
| |
|
3.1.2. Cis-5-norbornene-exo-2,3-dicarboxylic Anhydride (1ex)
A similar method can be used to characterize the 5-norbornene-exo-2,3-dicarboxylic anhydride isomer 1ex. After recording all the usual NMR spectra (1H, 13C, APT, COSY, HSQC and HMBC), the students can establish the correlations between the protons in the 2D NOESY spectrum (Figure 7).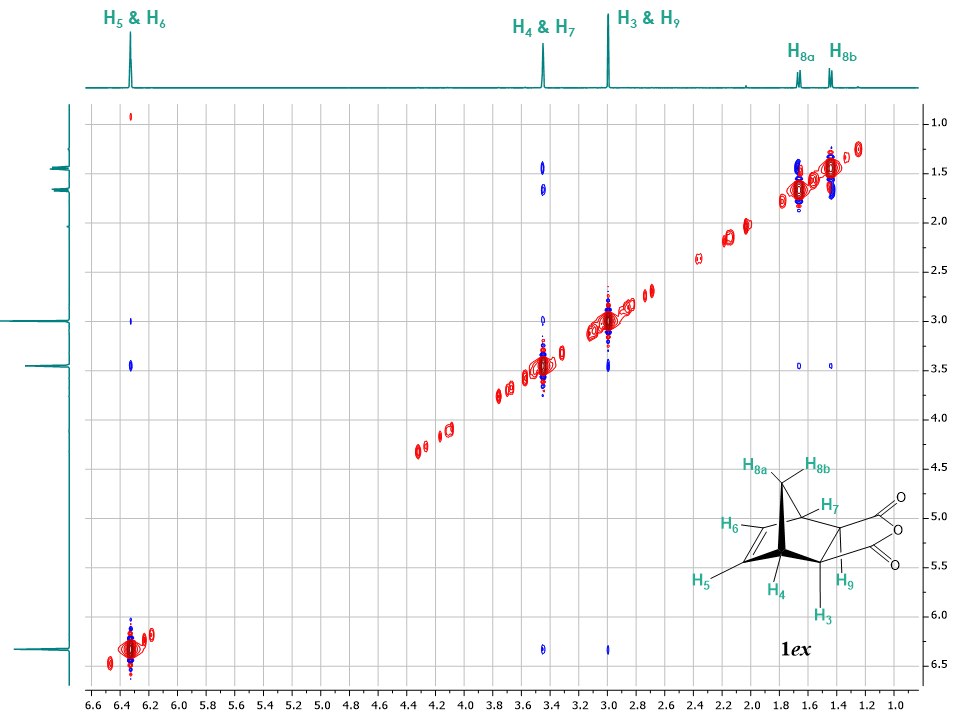 | Figure 7. 2D NOESY spectrum of 5-norbornene-exo-2,3-dicarboxylic anhydride 1ex (Recorded in CDCl3, 1.0 to 7.0 ppm region of the spectrum shown for clarity of purpose) |
Figure 7 shows that both H8a and H8b protons have only a correlation with H4 and H7 unlike the endo isomer which showed a correlation between H8b with H3 and H9. This suggests the presence of the exo isomer configuration, due to the protons H3 and H9 being on the opposite face in the exo isomer compared to the endo isomer. Additionally, protons H5 and H6 show a correlation with protons H3 and H9 and H4 and H7. Interestingly, for compound 1ex, the discrimination between H8a and H8b is not possible using the 2D NOESY spectrum as both protons only show a correlation with H4 and H7. Hence, it was important to run several 1D NOESY experiments.The 1D NOESY experiments for 1ex are shown in Figure 8. The irradiation of proton H8a showed NOEs to protons H5, H6 which are close to each other in space and reside on the same face of the cyclopentene moiety. Interestingly, irradiation of H5 and H6 not only confirms the NOE with H8a but also shows a minor Overhauser effect with H8b. The magnetisation transfer between H8b and H5, H6 is known [11] and probably occurring due to the orbital overlap between the double bond and H8b. The greater signal intensity of H8a compared to H8b indicates that H8b is further away from H5, H6 compared to H8a.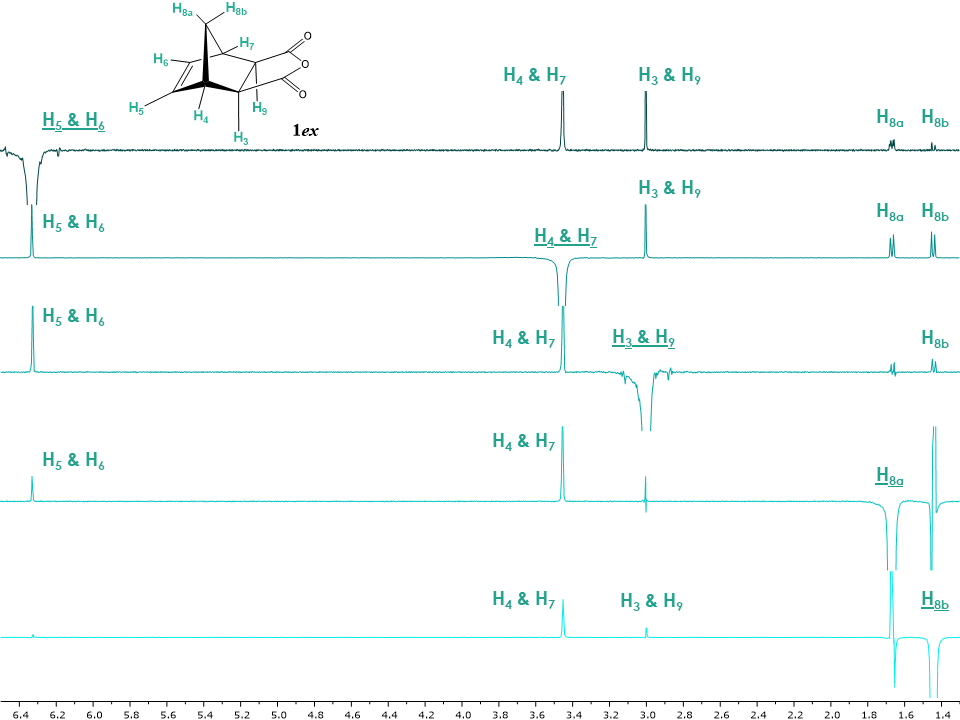 | Figure 8. Stacked 1D NOESY spectra of 5-norbornene-exo-2,3-dicarboxylic anhydride with irradiated protons H5 & H6, H4 & H7, H3 & H9, H8a and H8b. Irradiated protons are underlined. Spectra are processed having irradiated signal in negative phase. Positive phase signals are considered true NOE, while false NOE signals show both positive and negative phases |
The irradiation of H8b shows a NOE with H4, H7 and a minor NOE with H3, and H9. The intensity of the H3, H9 peak is lower compared to H4, H7 and therefore indicates that H3, H9 are spatially further from H8b. In turn, irradiation of H3, H9 also show a NOE with H8b. If the students recall the 1D NOE for 5-norbornene-endo-2,3-dicarboxylate anhydride (Figure 5) they can readily observe that upon irradiation of H8b the intensities of H3, H9 and H4, H7 signals are inverted relative to the exo isomer which shows that in the exo isomer H3, H9 are at a greater distance from H8b and that in the endo isomer H3, H9 are much closer to H8b.Overall, 1D NOEs are consistent with the structure of the exo isomer and are summarized in Table 2. This is confirmed by the two important groups of proton correlations, the first one between H8a and H5, H6 and second one between H8b and H4, H7 and H3, H9.Table 2. 1D and 2D NOE correlations summary in 5-norbornene-exo-2,3-dicarboxylic anhydride 1ex. (w stands for weak observed NOE)
 |
| |
|
These observed correlations, can also be associated with the crystal structure of the 1ex, and the atoms spatial proximity in the structure. With the help of Figure 9, students can correlate the NOE intensity with the distance between the atoms. Indeed, the shortest distance between H5, H6 and H8a (3.5 Å) resulted in a medium to strong NOE, while a longer distance with H8b (4.4 Å) resulted in a weak NOE.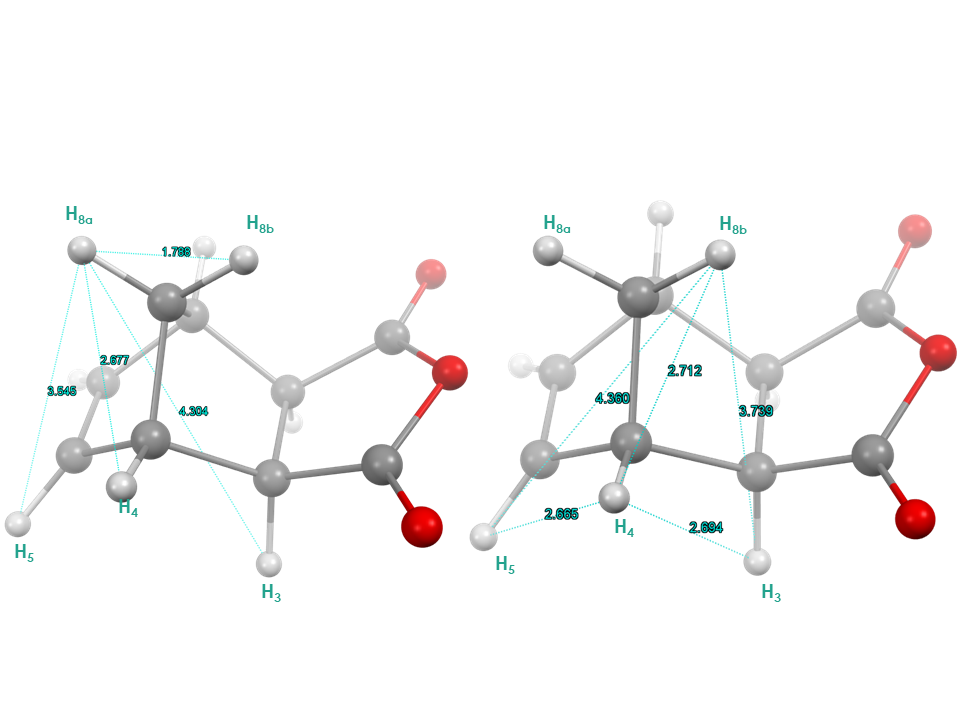 | Figure 9. Crystal structure of 1ex, left structure showing distances between H8a and H5, H4, H3, H8b. Right structure showing distance between H8b and H5, H4, H3 and between H5, H4 and H4, H3 in Angstroms. (CCDC Database Identifier: NBONAN01, Deposit Number: 1217845) |
Finally, with the analysis of the collected 2D and 1D NOESY data students can have a series of tools to help differentiate between the endo and exo isomers of 5-norbornene-2,3-dicarboxylic anhydride. These NMR experiments can unambiguously answer the question that may rise on how to distinguish between the exo and endo Diels-Alder products with the help of advanced NMR techniques. To make sure these techniques are well understood, the students can now be exposed to a more challenging assignment using the Diels-Alder reaction between methylcyclopentadiene and maleic anhydride and asked to assign the configuration of the resulting adducts. [4]
3.2. Endo-5-Methyl-5-norbornene-2,3-dicarboxylic Anhydride (3en) and Exo-5-methyl-5-norbornene-2,3-dicarboxylic Acid Anhydride (3ex)
The analysis of the Diels-Alder reaction products between the methylcyclopentadiene isomers and maleic anhydride followed the same process as in case of exo and endo isomers of 5-norbornene-2,3-dicarboxylic anhydride. The endo isomers 2en and 3en can readily be obtained according to the reported procedure [4], while the exo isomers 2ex and 3ex can be generated using microwave irradiation of the endo isomers in toluene at 200°C for 15 min (Scheme 1). Interestingly, during the isomerization the ratio of isomer 2 to 3 decreased dramatically from 43/57 to 20/80 after 15 minutes of irradiation, and subsequently to 14/86 after 90 minutes of irradiation. Such a dramatic change in ratios permitted an easy separation of isomers 3en and 3ex in good purity.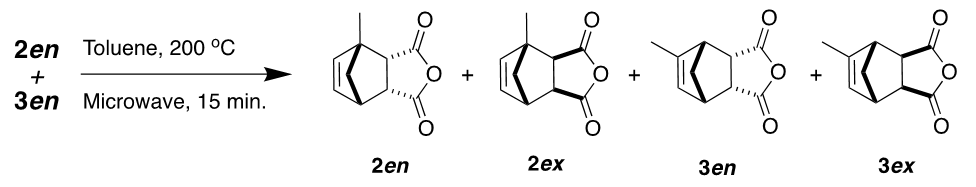 | Scheme 1. Microwave assisted isomerization and rearrangement of the Diels-Alder Adducts 2en and 3en to 2ex and 3ex |
With the NMR structure elucidation of endo isomer 3en previously described,[4] the exo isomer 3ex was submitted to the similar procedure and its structure was solved using 1H, 13C, APT, COSY, HSQC, HMBC experiments.Figure 10 shows the 1H-NMR spectra of both isomers for comparison. Just as in the case of isomers 1en and 1ex, the biggest difference between the isomers consists of more deshielded H5 and H6 signals in the endo as opposed to the exo isomer, while the chemical shifts of H4, H1 and H7a, H7b show the same tendency and are shifted to lower field in the endo isomer. [11]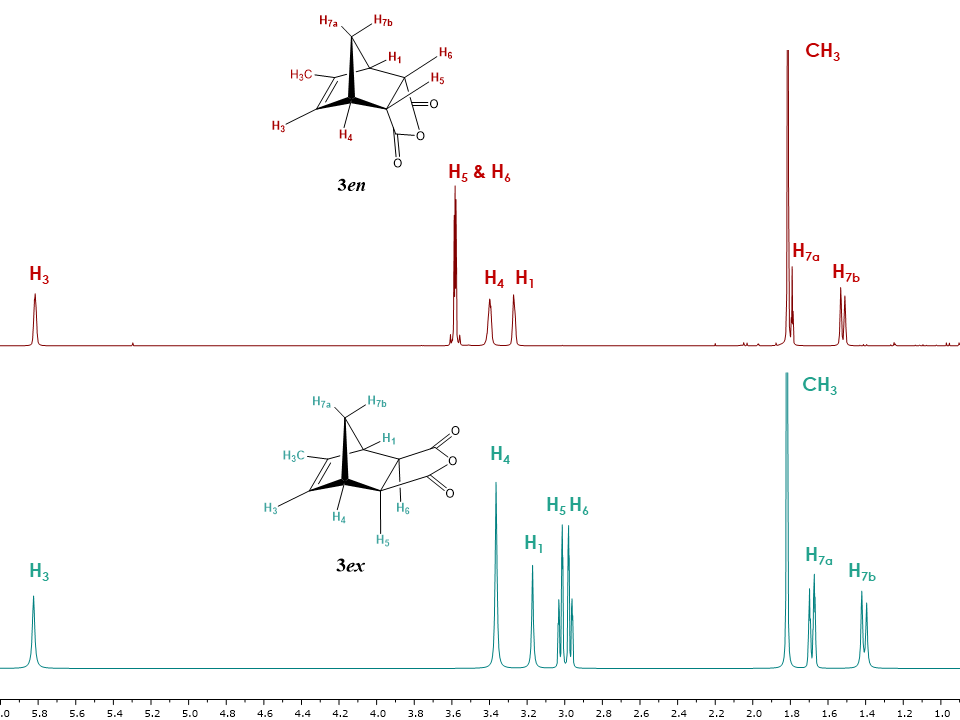 | Figure 10. 1H NMR spectra of exo and endo isomers of 5-methyl-5-norbornene-2,3-dicarboxylic acid anhydride 3ex and 3en. (Minor impurities were removed by deconvolution for clarity purposes, see supplementary information for the non- deconvoluted spectra.) |
The 1D and 2D NOESY spectra were subsequently collected to help assign the exo and endo configuration. Figure 11 displays the 2D NOESY spectrum for 3en. The cross peaks between H7b and H5, H6 indicate the close spatial proximity of these protons, while the presence of additional cross peaks in the spectrum indicates the close proximity of H7a and H3 protons. These observations suggest the presence of the endo configuration. However, additional validation using 1D NOESY is required due to T1 noise that can lead to ambiguous cross peak readings in the 2D spectrum.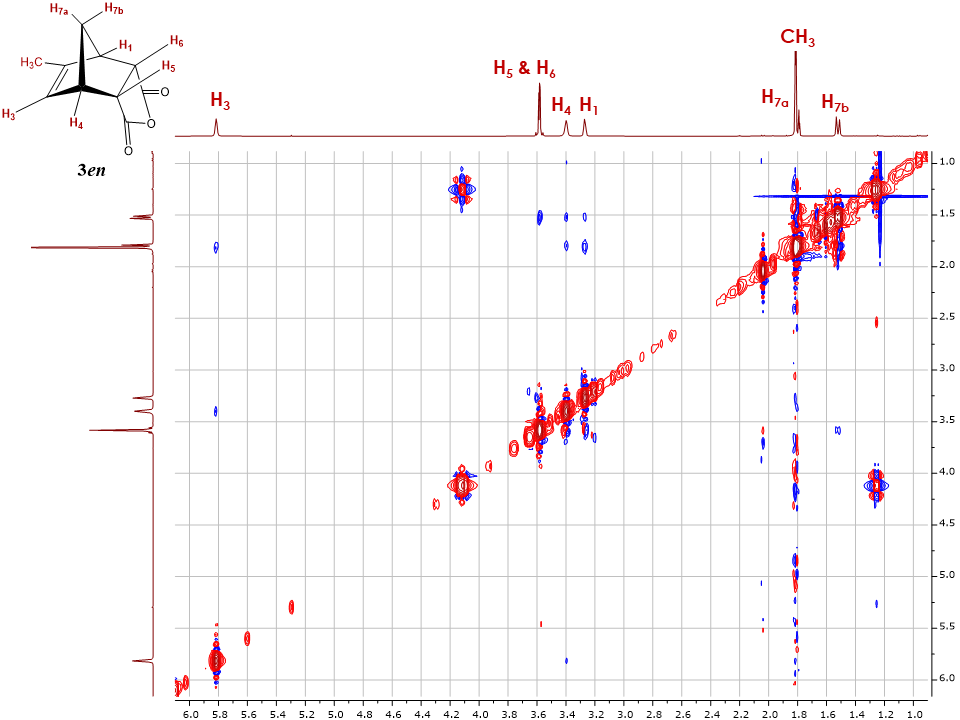 | Figure 11. 2D NOESY of endo-5-methyl-5-norbornene-2,3-dicarboxylic acid anhydride 3en |
The zero-quantum suppression 1D NOESY for 3en shown in Figure 12 allows the students to “filter off” the J-coupling interactions and further confirm the spatial configuration of the endo isomer.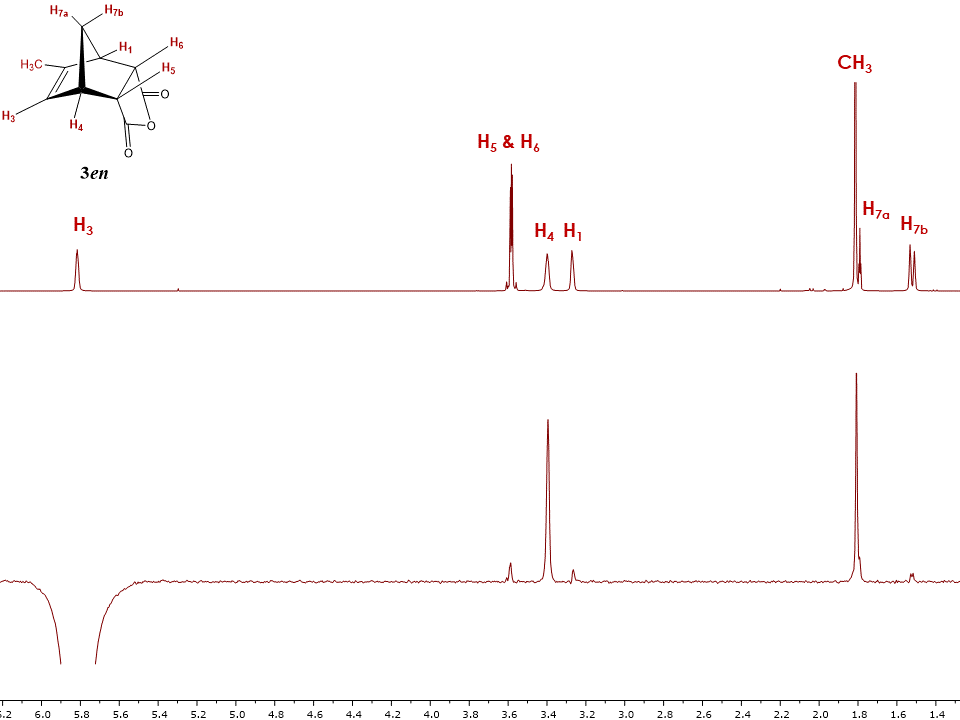 | Figure 12. Stacked 1H-NMR and 1D NOESY spectra of endo-5-methyl-5-norbornene-2,3-dicarboxylic acid anhydride 3en with H3 proton irradiated |
After the comprehensive analysis of 1en and 1ex isomers, students can now limit the number of 1D NOE acquisitions by simply irradiating the readily accessible alkene proton H3. Indeed, the irradiation of H3 provides immediate information on the adduct 3 configuration. Strong correlations are observed for neighbouring protons H4, methyl group and H7a, and weak correlations between protons H1, H3, H7b and H5 & H6. It is now important to compare intensities of cross peaks between protons H3 and H5 & H6 for both 1D NOESY spectra of 3en and 3ex to clearly confirm the structure of adducts. The intensity of cross peak H3 – H5 & H6 is smaller in the spectrum displayed on Figure 12 compared to Figure 14 (discussed below) and therefore suggests that Figure 12 depicts the endo isomer 3en. Irradiation of other protons in the endo adduct also reaffirm the suggested configuration (See supplementary information for all spectra).The two dimensional NOESY spectrum in Figure 13 for the exo isomer 3ex shows no correlation between protons H5, H6 and the bridge diastereotopic protons H7a and H7b, indicating that they are not in close proximity. Additionally, due to a large amount of t1 noise and the close chemical shifts of H5, H6 protons, cross peak interpretation is not really informative. However, a series of 1D NOE spectra allowed for the unequivocal exo assignment. While all the protons for 3ex were irradiated the most informative spectrum resulted from the irradiation of the alkene proton H3. As seen in Figure 14, H3 shows a strong correlation with protons H4 and H5 & H6. The intensity of cross peak H3 – H5 & H6 is also greater compared to that in the 3en isomer in Figure 12, which is a clear indication of their spatial proximity, and a good validation of the exo configuration.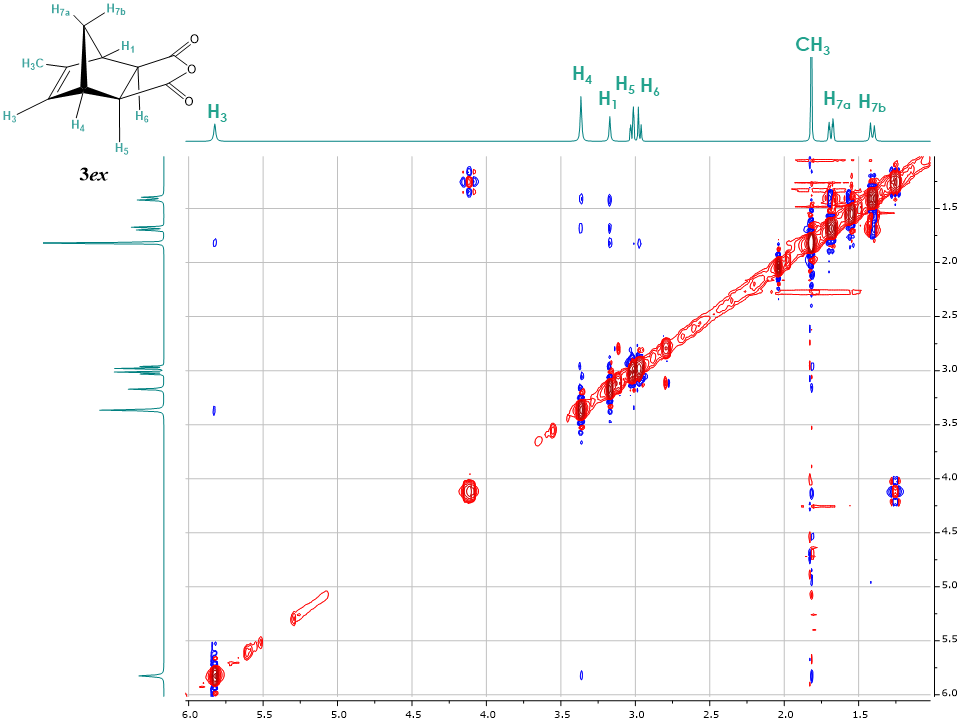 | Figure 13. 2D NOESY spectrum of endo-5-Methyl-5-norbornene-2,3-dicarboxylic acid anhydride 3ex |
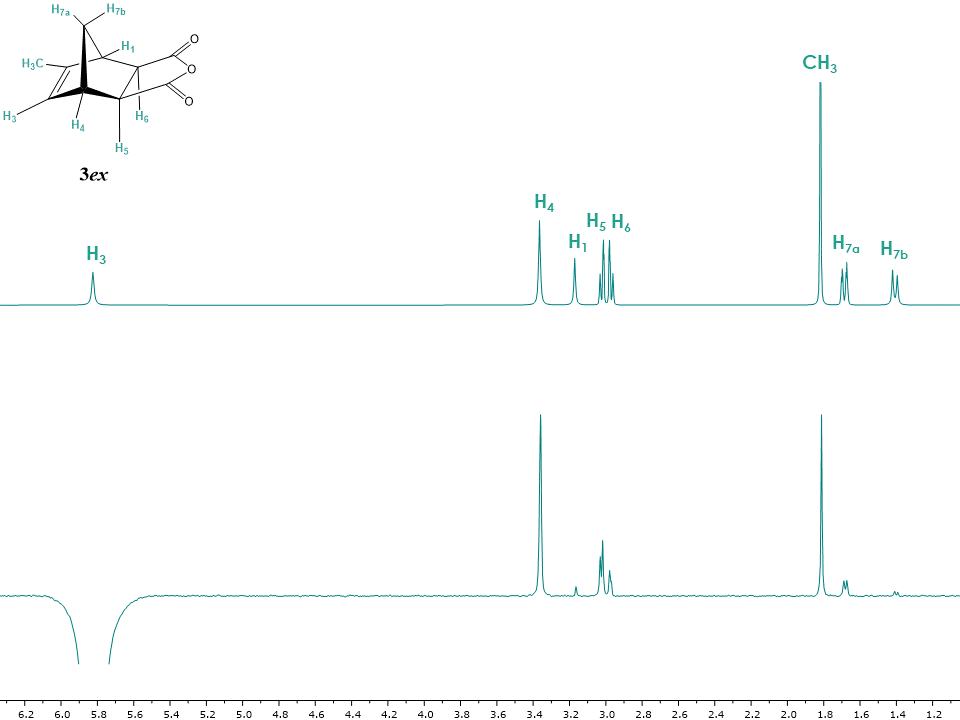 | Figure 14. Stacked 1H-NMR and 1D NOESY spectra of exo-5-methyl-5-norbornene-2,3-dicarboxylic acid anhydride 3ex with H3 proton irradiated |
Since most of the studies on 3en and 3ex adducts were performed on samples containing small impurities, a quick way to generate clean analytical samples was to react adducts 3en and 3ex with L-alanine methyl ester under basic conditions and separate the resulting diastereomers. [12] These two new diastereomers 4en and 4ex can easily be separated by chromatography on silica gel and submitted to NMR spectroscopic investigation to further assign and validate their configuration.
3.3. L-Alanine Methyl Ester Derivatives of 5-Methyl-5-norbornene-2,3-dicarboximide
The L-alanine modification of 5-methyl-5-norbornene-2,3-dicarboxylic acid anhydride derivatives was previously described to separate the mixtures of the diastereomers 2en and 3en. [4] This modification can serve as an alternative confirmation in the structure elucidation of the exo and endo isomers. The L-alanine methyl ester endo and exo isomers 4en and 4ex were obtained by microwave isomerization of Diels Alder products 3en/3ex followed by derivatization of the reaction mixture with L-alanine methyl ester under basic conditions (Scheme 2). [5,12]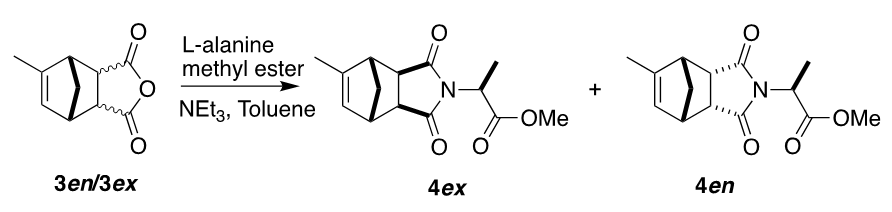 | Scheme 2. L-alanine functionalization of the 5-methyl-5-norbornene-2,3-dicarboxylic acid anhydride isomers mixture |
Since the structure analysis of the endo isomer 4en was previously completed using 1H, 13C, COSY, HSQC, HMBC experiments [4], the same NMR experiments can be used to assign the structure of the exo isomer 4ex (See supplementary information). Additionally, 1D and 2D NOESY experiments were used to differentiate between the exo and endo configuration. As in the case of 5-Methyl-5-norbornene-2,3-dicarboxylic acid anhydride, Figure 15 shows a similar trend for the 1H NMR chemical shifts between exo and endo isomers, with several signals being more deshielded for the exo isomer. The most drastic differences are observed for the chemical shifts of protons H5 and H6 which occur at 2.8-2.6 ppm in case of the exo isomer and 3.2-3.3 ppm in case of the endo isomer.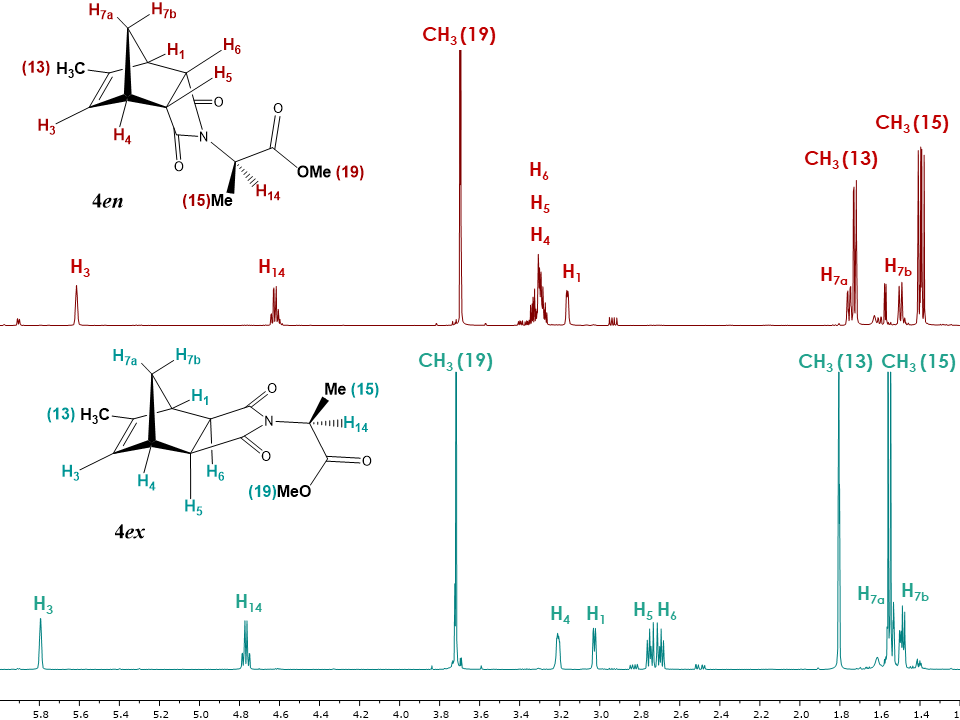 | Figure 15. 1H NMR spectra of isomers 4ex and 4en |
The subsequent 2D NOESY spectrum for the endo adduct 4en shows similar cross peaks between bridge diastereotopic proton H7b and H5, H6 as was previously observed for endo-5-methyl-5-norbornene-2,3-dicarboxylic acid anhydride (Figure 16) as well as a cross peak between H7a and H3. 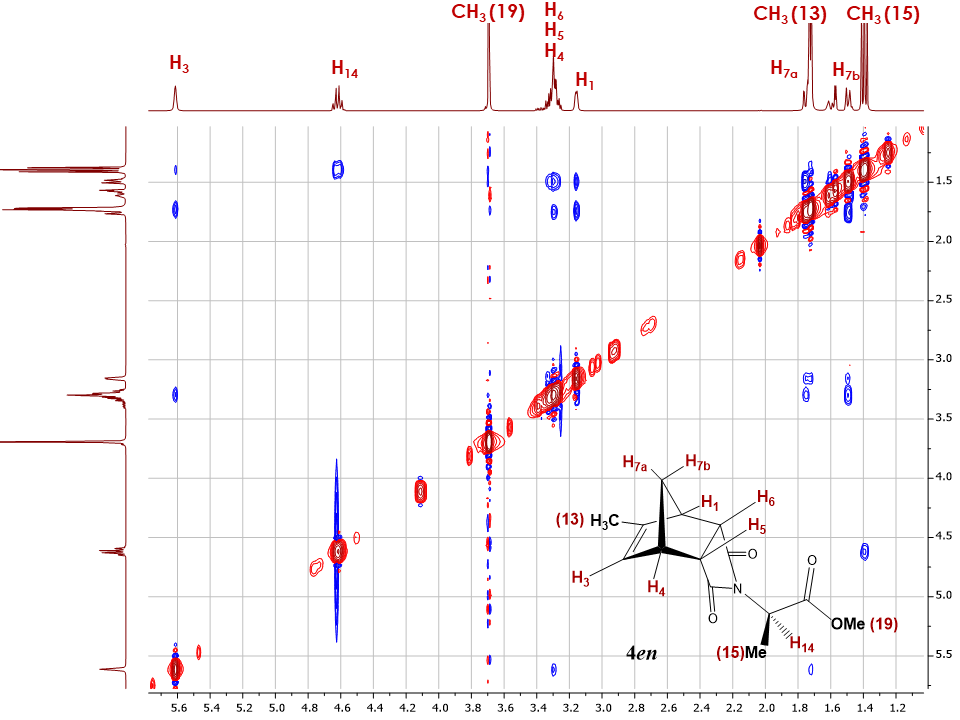 | Figure 16. 2D NOESY spectrum of adduct 4en |
The 1D NOESY spectrum, however, was more informative when focused on the H3 proton, avoiding the ambiguous cross peaks in the 2D NOESY spectrum caused by the t1 noise and the J-couplings. As in adducts 2 and 3, the H3 proton signal does not overlap with any other signal and is easily detected in the 1H-NMR alkene region (5 to 6 ppm). The 1D NOESY spectrum (Figure 17) with irradiated protons H3 shows several correlations with H7a, the methyl groups CH3 (13) and CH3 (15) as well of what appears to be a strong correlation with H4. However, since H4, H5 and H6 overlap in the adduct 4en, the analysis of the adduct 4ex is required to lift any doubt on the 4en configuration.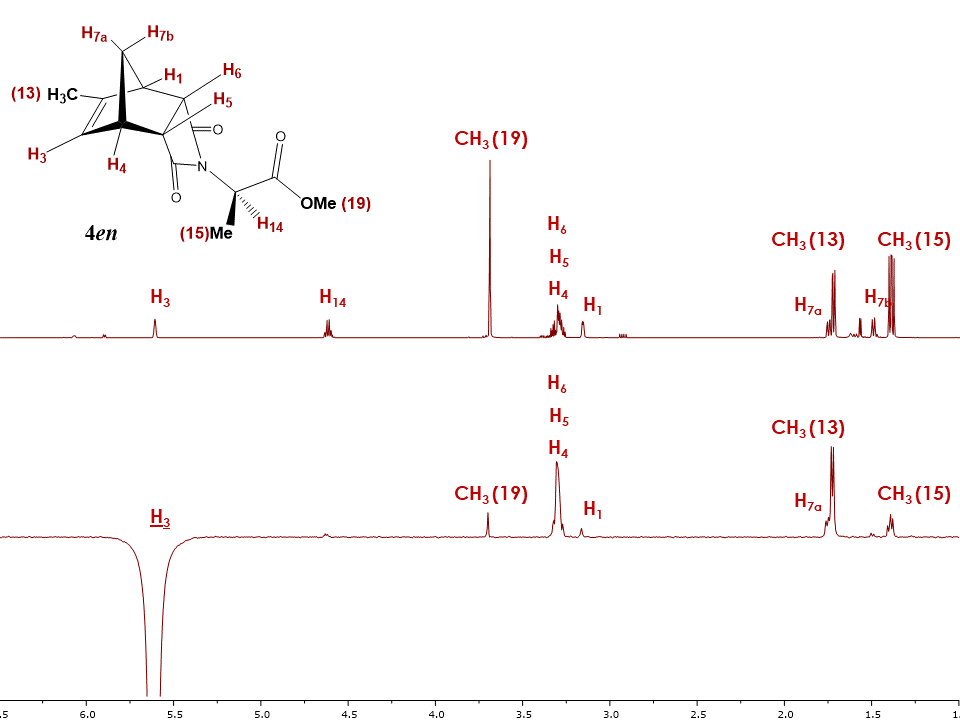 | Figure 17. Stacked 1H-NMR and 1D NOESY spectra of adduct 4en with irradiated H3 proton |
The 2D NOESY spectrum for the exo isomer 4ex showed no correlation between bridge protons H7a, H7b and H5, H6 as expected (Figure 18). Instead H5, H6 show correlations with H1, H3, H4 protons. Additionally, correlations between H3 and H7a, CH3 (13) protons are observed, providing further evidence in favor of the exo configuration for adduct 4ex. The 1D NOESY spectrum (Figure 19) confirms that upon irradiation of H3 magnetization transfers to protons H4, H5, H6, methyl group CH3 (13) as well as to the diastereotopic bridge proton H7a. Students should be encouraged to compare the exo and endo isomers spectra since that is the key strategy for configuration determination.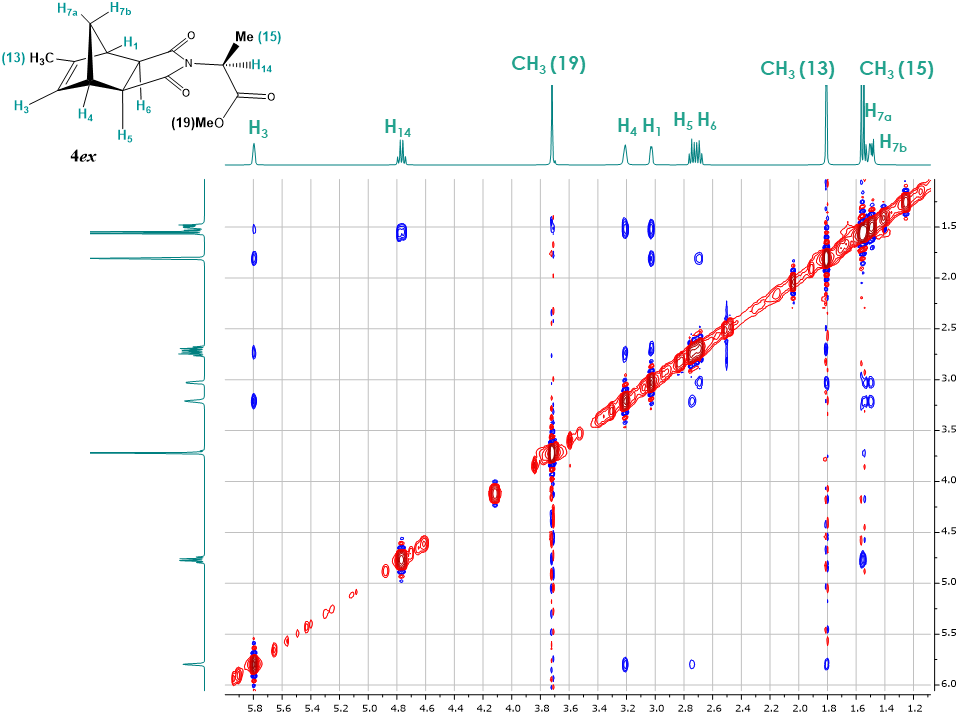 | Figure 18. 2D NOESY spectrum of adduct 4ex |
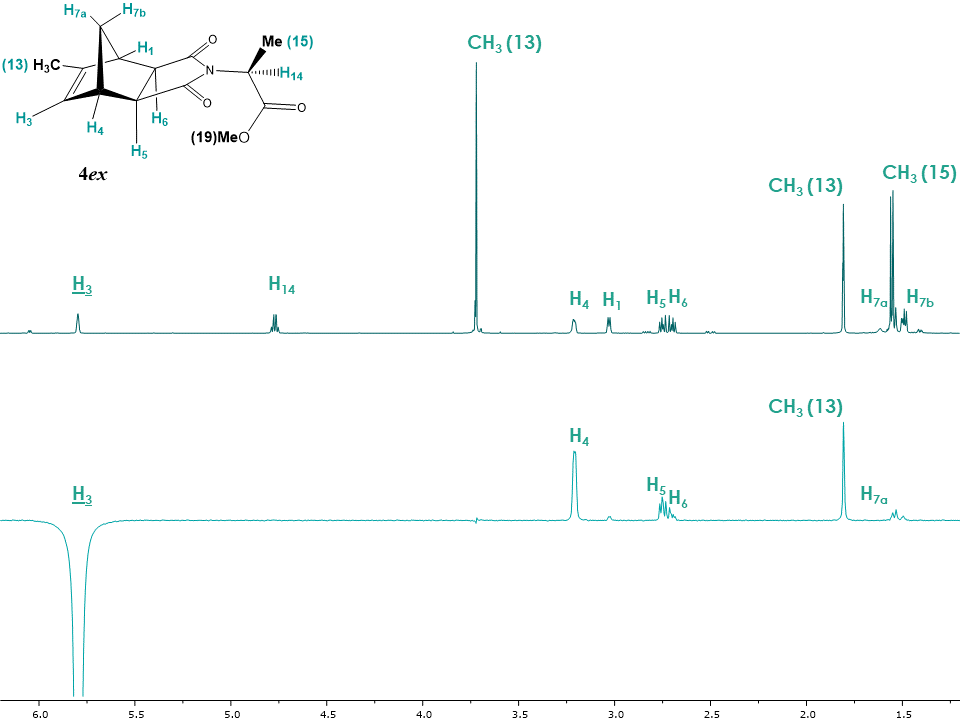 | Figure 19. Stacked 1H-NMR and 1D NOESY spectra of adduct 4ex with H3 proton irradiated |
3.4. Determining the Configuration of 1-methyl-5-norbornene-2,3-dicarboximide L-alanine Derivative (5)
At this point and to summarize the student’s learnings, it is important to provide them with a derivative of unknown configuration and ask them to assign its structure as well as confirm its configuration. From previous and current work, several derivatives of 2en and 2ex can be isolated, purified and used as unknowns for this particular exercise.When an L-alanine methyl ester derivatives of 1-methyl-5-norbornene-2,3-dicarboximide (5) [4] was assigned to the students, a full NMR package was recorded and the proton signals in the molecule assigned when possible. Subsequently, the 2D NOESY spectrum was recorded and the spectrum analyzed (Figure 20). The clear correlations between the alkene protons H2 and H3 with H4 were to be expected, however the absence of correlation with protons H7b and H5 and H6 needed to be further investigated using 1D NOE experiments. 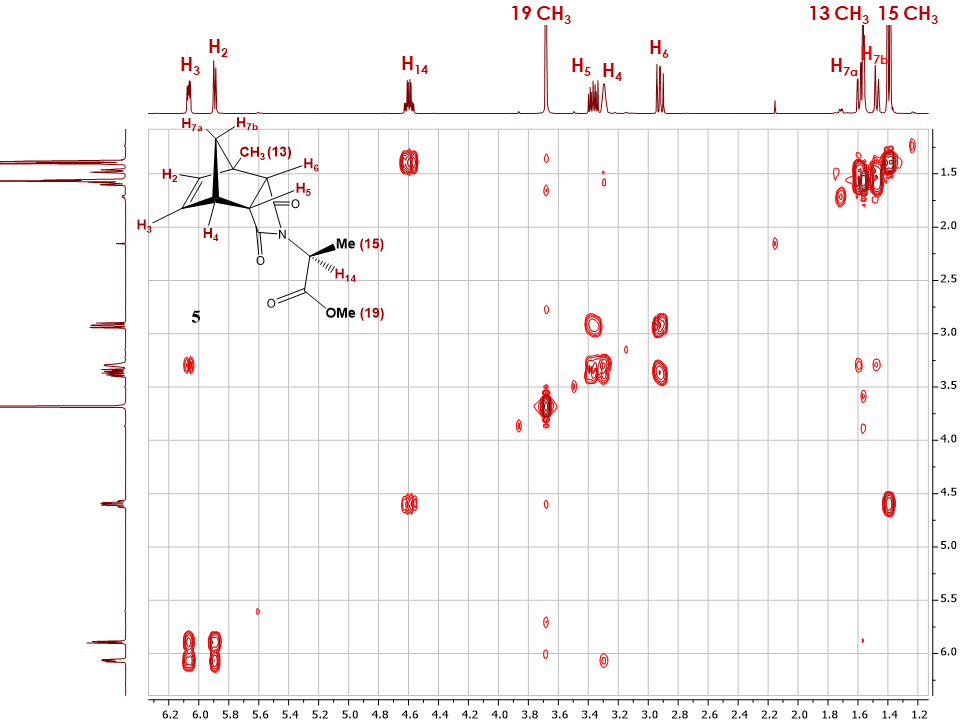 | Figure 20. 2D NOESY spectrum of adduct 5 |
As seen in Figure 21, upon selective irradiation of proton H2 and H3, correlations with proton H4 was confirmed while additional information was acquired. Indeed, these experiments confirmed the assignment of H2 and H3, with H2 showing a correlation to the methyl group Me (13). With no correlation observed with any of the H5 and H6 protons the students could definitely assign the configuration of compound 5 as endo.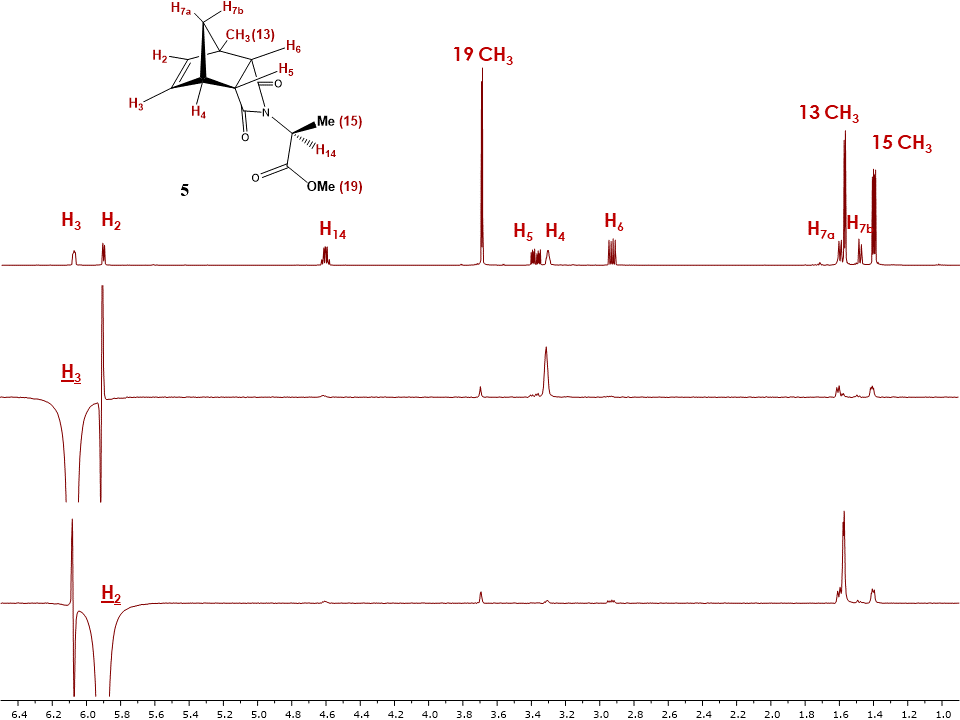 | Figure 21. Stacked 1H-NMR and 1D NOESY spectra of adduct 5 with irradiated H2 and H3 proton |
4. Conclusions
Using the ubiquitous Diels Alder reaction between readily available undergraduate laboratory reagents, the students were able to synthesize methyl substituted norbornene-2,3-dicarboxylic anhydride adducts. Upon microwave irradiation of these adducts a mixture of the endo and exo conformers were formed and were separated using standard chromatography techniques. Such mixtures of conformers proved to be the ideal targets to introduce the students to 2D and 1D Nuclear Overhauser Effect (NOE) NMR spectroscopy experiments.
ACKNOWLEDGEMENTS
The authors thank the Simon Fraser University (SFU) Dean of Science Office for financial support and the SFU Chemistry Department for logistical support.
Supporting Information
All raw “full package” NMRs as well as labelled relevant NMR spectra and correlation tables are available as supplementary information.
References
| [1] | Williamson, K. L.; Masters, K. M. Macroscale and Microscale Organic Experiments, 6th ed.; Brooks/Cole: Belmont, CA, 2011. |
| [2] | Mayo, D. W.; Pike, R. M.; Forbes, D. C. Microscale Organic Laboratory: With Multistep and Multiscale Syntheses, Sixth edition.; John Wiley & Sons, Inc: Hoboken, N.J, 2015. |
| [3] | Schoffstall, A. M.; Gaddis, B. A.; Druelinger, M. L. Microscale and Miniscale Organic Chemistry Laboratory Experiments, 2nd ed.; McGraw-Hill Higher Education: New York, 2004. |
| [4] | Sannikov, O.; Hanson, S.; Saunders, P.; Branch, K. L.; Merbouh, N. Introducing Complex NMR Mixtures at the Undergraduate Level: Analysis of the Diels-Alder Reaction between Methylcyclopentadiene and Maleic Anhydride (Part I). J. Lab. Chem. Educ. 2019, 7 (1), 8–18. https://doi.org/10.5923/j.jlce.20190701.02. |
| [5] | Saunders, P. R. C.; Al-Jobory, Y. M.; Hwangbo, J.; Schultz, S. J.; Merbouh, N. Rapid Microwave-Assisted Isomerization of Cis-Norbornene-Endo-5,6-Dicarboxylic Anhydride. Chem. Educ. 16, 149–151. https://doi.org/10.1333/s00897112362a. |
| [6] | Thrippleton, M. J.; Keeler, J. Elimination of Zero-Quantum Interference in Two-Dimensional NMR Spectra. Angew. Chem. Int. Ed. 2003, 42 (33), 3938–3941. https://doi.org/10.1002/anie.200351947. |
| [7] | Bigler, P. NMR Spectroscopy: Processing Strategies, 2nd updated ed.; Spectroscopic techniques; Wiley-VCH: Weinheim; New York, 2000. |
| [8] | Cobas, C.; Sykora, S. An Expert System for the Auto Assignment of 1H NMR Spectra of Small Molecules. Stans Libr. 2012, No. Volume IV. https://doi.org/10.3247/sl4nmr12.001. |
| [9] | Boros, S.; Gáspári, Z.; Batta, G. Accurate NMR Determinations of Proton–Proton Distances. In Annual Reports on NMR Spectroscopy; Elsevier, 2018; Vol. 94, pp 1–39. https://doi.org/10.1016/bs.arnmr.2017.12.002. |
| [10] | Jones, C. R.; Butts, C. P.; Harvey, J. N. Accuracy in Determining Interproton Distances Using Nuclear Overhauser Effect Data from a Flexible Molecule. Beilstein J. Org. Chem. 2011, 7, 145–150. https://doi.org/10.3762/bjoc.7.20. |
| [11] | Kamezawa, N.; Sakashita, K.; Hayamizu, K. Nuclear Magnetic Resonance Studies of 5,6-Dicarboxy-2-Norbornene Derivatives. Org. Magn. Reson. 1969, 1 (5), 405–414. https://doi.org/10.1002/mrc.1270010508. |
| [12] | Bodtke, A.; Otto, H.-H. Synthesis and Properties of Chiral N,N-Maleoyl Derivatives and Diels-Alder Reactions with Cyclopentadiene. Pharm. - Int. J. Pharm. Sci. 2005, 60 (11), 803–813. |

 Abstract
 Reference
 Full-Text PDF
 Full-text HTML