-
Paper Information
- Paper Submission
-
Journal Information
- About This Journal
- Editorial Board
- Current Issue
- Archive
- Author Guidelines
- Contact Us
Journal of Laboratory Chemical Education
p-ISSN: 2331-7450 e-ISSN: 2331-7469
2020; 8(2): 33-38
doi:10.5923/j.jlce.20200802.03
Received: Jul. 16, 2020; Accepted: Aug. 20, 2020; Published: Sep. 15, 2020

Application of Chemometrics and Tandem Techniques in the Chemistry of Beverages: Analysis of Methylxanthines in Guaraná Powder Extract
 Abstract
 Reference
 Full-Text PDF
 Full-text HTML
Omar A. El Seoud1, Luzia P. Novaki2, Nicolas Keppeler1, Ana M. Chinelatto1, Soraya S. Santos1, Vânia A. B. B. Silva1
1Institute of Chemistry, the University of São Paulo, SP, Brazil
2Human and Natural Science Center, ABC Federal University, SP, Brazil
Correspondence to: Omar A. El Seoud, Institute of Chemistry, the University of São Paulo, SP, Brazil.
| Email: |  |
Copyright © 2020 The Author(s). Published by Scientific & Academic Publishing.
This work is licensed under the Creative Commons Attribution International License (CC BY).
http://creativecommons.org/licenses/by/4.0/

Guaraná is a tropical fruit that grows in the Amazon basin and the northeastern part of Brazil, from which a popular soft drink is manufactured. The main methylxanthine (MX) in the guaraná powder is caffeine (CF); theobromine (TB) and theophylline (TP) are also present in much lower concentrations. Because of the popularity of this soft drink, and the stimulating effects of MXs, we introduced an undergraduate chemistry project on their extraction from guaraná powder and subsequent analysis. A literature survey showed that there is some variation in the values of λmax and εmax of the three MXs. Using purified authentic samples, we showed that values of λmax and εmax of CF, TB and TP are very close. Consequently, their concentrations in guaraná extract cannot be calculated using a single technique (UV-Vis). After discussing this problem with the students, the following project was carried out: (i) guaraná powder was extracted with acidified aqueous ethanol under different experimental conditions (alcohol volume fraction in the binary solvent mixture,  ; powder extraction time, t); (ii) the apparent CF concentration was calculated from the absorbance of the extract at λmax = 272.5 nm; (iii) the extracts were analyzed by high performance liquid chromatography; the three MXs were identified in the chromatograms using internal standards, and the true [CF] calculated. Stage (i) involved use of chemometrics to optimize powder extraction, and to get information on the relative importance of the experimental variables (
 is more important than t). Stage (ii) was a straightforward application of Beer’s law. Stage (iii) demonstrated the power of using tandem techniques to solve complex, everyday situation, namely the separation and analysis of biologically active components in consumer products (soft- and energy drinks).
Keywords: Guaraná extract, Chemometrics, Methylxanthines analysis, Ultraviolet–visible spectroscopy, Tandem techniques, High-performance liquid chromatography
Cite this paper: Omar A. El Seoud, Luzia P. Novaki, Nicolas Keppeler, Ana M. Chinelatto, Soraya S. Santos, Vânia A. B. B. Silva, Application of Chemometrics and Tandem Techniques in the Chemistry of Beverages: Analysis of Methylxanthines in Guaraná Powder Extract, Journal of Laboratory Chemical Education, Vol. 8 No. 2, 2020, pp. 33-38. doi: 10.5923/j.jlce.20200802.03.
Article Outline
1. Introduction
- Guaraná (Paullinia cupana) is a fruit native of the Amazon basin (Brazil, Columbia, Peru and Venezuela), and latter grown in the northeastern part of Brazil. As shown in Figure 1, the fruit has a vivid red skin, covering a thin white aril (an outgrowth that partly, or completely covers the seed) and the seed. After mechanically removing the skin, the hard seed is roasted and then grinded to yield a brown powder from which a syrup and a soft drink is commercialized [1].Guaraná seeds have caffeine (CF) content higher than coffee seeds, cacao beans, and tea leaves. Different commercial guaraná samples may contain from ca. 2 to 9 wt% of CF. Other methylxanthines (MXs) present include theobromine (TB) and theophylline (TP); these are present in much lower concentrations, typically ≤ 0.05 wt% of the powder [2,3]. These MXs are usually extracted from guaraná powder with protic solvents (water, alcohols) alongside with some (antioxidant) polyphenols, e.g., +CT and -CT, see Figure 1 [4].
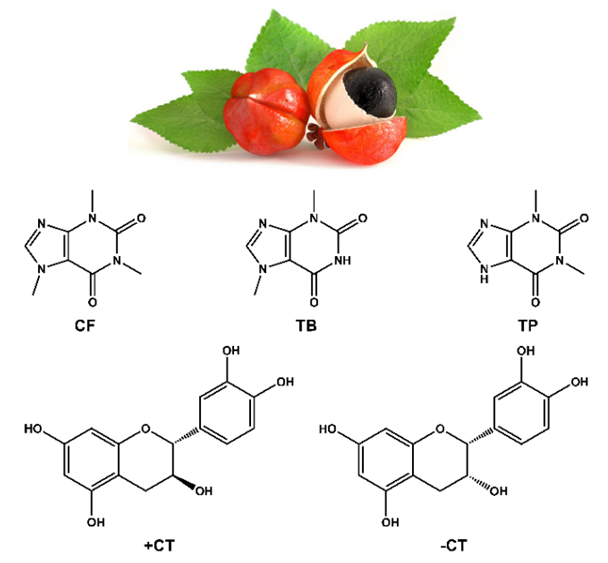 | Figure 1. Closed and open guaraná fruit. The latter shown the aril (white) and the seed (dark). The molecular structures of some compounds of interest, present in these seeds, are shown. These include: the methylxanthines caffeine (CF), theobromine (TB) and theophylline (TP); the polyphenols (+)-catechin (+CT), and (-)-epicatechin (-CT) |
2. Experimental
2.1. Reagents, Solvents and Guaraná Powder
- The following substances were used (name and CAS number): commercial “absolute” ethanol (64-17-5) and standardized HCl solution (7647-01-0) were purchased from Synth (São Paulo). CF (58-08-2), TB (83-67-0), and TP (58-55-9) were from Merck; guaraná powder (84929-28-2) commercialized by Rio Amazonas (Manaus) was purchased from a health food store. All substances, except the MXs (vide infra) were used as received; deionized water was used throughout.
2.2. Equipment and Analysis Conditions
- The following equipment were used: - Melting point: Büchi model M-565 (m.p. uncorrected); - UV-Vis spectroscopy: Shimadzu double-beam UV‐2550 spectrophotometer, operating at 25°C (4000A digital thermometer, Yellow Springs Instruments); - Elemental analysis: Perkin Elmer 2400 Series II, in Central Analytical Laboratories (CAL) of the Institute of Chemistry; - HPLC analyses were performed in the CAL on Shimadzu LC20AD system, provided with UV detector; guaraná extract components detection was monitored at λ = 272 nm. All solutions were loaded on a ShimPack ODS II (2.0 mm x 100.00 mm) column and eluted using a linear solvent gradient of aqueous methanol containing 0.1 volume (v) % formic acid [22]. During analysis, the v% methanol in the eluting solvent was increased from 25 to 60 v% in 6 minutes, returning to 25 v% in 6 s, and stop time at 11 minutes. Column temperature was maintained at 40°C and solvent flow rate was 200 µL min-1.
2.3. Purification of the Methylxanthines
- This part was done by the staff, as follows:- Caffeine: repeated sublimation under reduced pressure, at 160°C; m.p. 236-238°C, literature m.p. 234-238°C [23]. Elemental analysis for C8H10N4O2: Calculated, %C, 49.46; %H, 5.19; %N, 28.86; analyzed: %C, 49.82; %H, 5.20; %N, 28.66.- Theobromine: Repeated recrystallization from methanol; m.p. 348-350°C, literature m.p. 345-350°C [24]. Elemental analysis for C7H8N4O2: Calculated, %C, 46.65; %H, 4.48; %N, 31.11; analyzed: %C, 46.32; %H, 4.52; %N, 31.08.- Theophylline: Repeated sublimation under reduced pressure at 150°C [25]; m.p. 273-274°C, literature m.p. 273-274°C [26]. Elemental analysis for C7H8N4O2: Calculated, %C, 46.65; %H, 4.48; %N, 31.11, analyzed: %C, 46.98; %H, 4.47; %N, 30.52.
2.4. Extraction of the Guaraná Powder and Calculation of the Apparent Concentration of Caffeine
- This part was carried out by the students. It required four hours and involved the following steps:
2.4.1. Preparation of the Extraction Solvent
- Acidified aqueous ethanol was used as extraction solvent in order to enhance the solubility of these MXs [14]. It was prepared as shown by the following example for a solvent with ethanol volume fraction,
 = 0.1: To 100 mL volumetric flask the students pipetted 10 mL ethanol and 1 mL of 0.1 mol L-1 HCl; the solution volume was completed below the mark with water; the flask was left for 10 min in a thermostated bath at 25°C, then completed to the mark with water.
2.4.2. The Extraction Experiments
- Samples of guaraná powder, ca. 0.2 g were weighted (analytical balance, readability = 0.1 mg) into 20 mL cylindrical glass vials, provided with PTFE lined screw caps. To each vial, the students added 10 mL of the acidified aqueous ethanol (final [HCl] = 0.001 mol L-1), containing the required
 , namely 0.1; 0.2; 0.3 for elaborating the statistical model, and 0.15 for testing its validity. The vials were then secured into the clamps of a tube rotator (model 099A RD4512, Glas-Col, Terre Haut) and rotated at room temperature (23±1°C, Aumax model N1540 digital thermometer, São Paulo) at 60 rpm, for the required length of time, namely, 10, 20, 30 min for elaborating the statistical model, and 15 min for testing its validity. For each
  , a dummy run was carried out (without guaraná powder), this solvent was used as blank in the UV-Vis measurement, vide infra. At the required time intervals, the vials were removed from the tube rotator; left to stand for 1 min, and the particle-free supernatant was removed using a 2.5 mL disposable plastic syringe with a needle. This solution was diluted (100 times) with the above-mentioned solvent, and then transferred to Hellma 114-QS semi-micro cuvette, with PTFE stoppers and 1 cm path length, and taken to the spectrophotometer, vide infra.
2.4.3. Determination of the Apparent Caffeine Concentration by UV-Vis Spectrophotometry
- The students calculated the solution absorbance (ACF) at 272.5 nm and 25°C from the first derivative of the spectrum; the solvent from the dummy experiment was used in the reference beam.
2.4.4. Absorbance Data Manipulation and Validation of the Statistical Model
- The data obtained by the students describe the dependence of ACF (extraction efficiency) on extraction time (t), and
 . These were subjected to statistical 32 analysis, vide infra, using the Statistica version 12 software (StatSoft).
2.5. Hazards
- There are no hazards in this project that require special precautions. The waste water produced requires no treatment.
3. Results and Discussion
3.1. Organizing the Project
- This project was carried out as a part of an advanced experimental chemistry course, whose workload is four hours/week. The number of the enrolled students was 33. We divided them into eight groups, each of four- or five students; they perform different experiments in a round-robin style, i.e., they rotate between different experiments including, e.g., organic synthesis. We introduced the project in the classroom by projecting Figure 2 that shows collectively the dependence of the absorbance on MX concentration for the purified MXs. Figure 2 and values of εmax that we calculated (in L mol-1 cm-1) 9750±129, 9682±102, and 9615±115, for CF, TB, and TP, respectively, drove home the point. Namely, the concentration of the three MXs in guaraná extract cannot be calculated using a single technique, viz., UV-Vis spectroscopy. We called the students attention to the fact that the CTs shown in Figure 1 also absorb at the same spectral region. As a solution, the students suggested component separation by chromatography, followed by using Beer’s law plots to calculate the concentrations of the separated components.
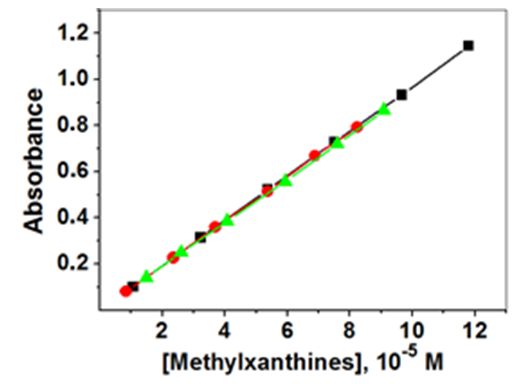 | Figure 2. Beer’s law plot of acidified aqueous solutions (10-3 mol L-1 HCl) of purified MXs: CF (■), TB (●) and TP (▲); spectra recorded at 25°C, λmax = 272.5 nm |
3.2. Experimental Work in the Undergraduate Laboratory
- The discussion below refers to the work of two groups of students. These went to the undergraduate laboratory, did the extraction experiments, and calculated the apparent CF concentration (CF wt%) using the provided value of εmax. The experiment has two independent factors or experimental variables, the extraction time (t, min) and the binary solvent composition, given by
 . Each variable has three levels or different values, namely, 10, 20, and 30 min powder extraction time, and
  = 0.1, 0.2, and 0.3; all extractions were run at room temperature and fixed rotation speed (60 rpm). Each student group ran 11 extraction experiments: 9 extractions (32) whose results are required to calculate the statistical equation, vide infra; one repetition of the central point (t = 20 min;
  = 0.20); one experiment at different conditions (t = 15 min,
  = 0.15) for model validation. This activity required four hours.
3.3. Statistical Treatment of the Extraction Data
- Subsequent data treatment using the above-mentioned commercial software was carried out by the students using the extraction data of the two groups (20 data points).This data treatment was employed to generate:(i) the color-coded response surface shown in Figure 3, for the dependence of CF wt% (z axis) on extraction time and
 , where the color change (green→ yellow→ red→ dark red) corresponds to an increase of CF wt%. As shown in Figure 3, the extraction yield increases as a function of increasing the values of t and
  ;(ii) an equation that relates the dependence of the CF wt% in guaraná powder on the above-mentioned experimental variables. Because the latter have different scales, 20 units for t and 0.2 unit for
  , their values (V) were first reduced (VR) as shown by Eq. 1:
 | (1) |
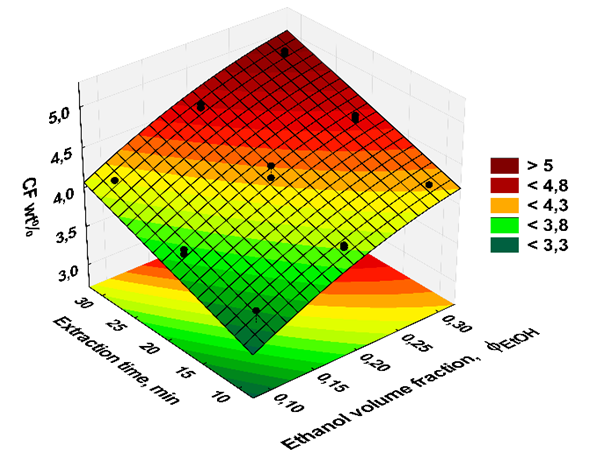 | Figure 3. A color-coded response surface plot of the students’ data showing the dependence of CF wt% (z axis) on extraction time and volume fraction of ethanol in the aqueous solvent,  . Values of the experimental variable are average of the results of two student groups. The color codes shown on the right-hand side of the plot are for the CF wt% . Values of the experimental variable are average of the results of two student groups. The color codes shown on the right-hand side of the plot are for the CF wt% |
 are shown in Eq. 2 and 3, respectively.
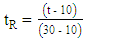 | (2) |
 | (3) |
 | (4) |
 = 0.15. According to Eq. 4, the calculated CF wt% is 3.87%. The mean (3.76%) of the two experimental values (3.80% and 3.72%) differs only by 2.9% from the calculated value, showing the robustness of the statistical model. One extract (20 min,
  = 0.2) was saved for chromatographic analysis in CAL.
3.4. Experimental Work in the Central Analytical Laboratories (CAL)
- The next week, the two student groups went to CAL where the technician demonstrated the HPLC equipment. Under her supervision, the students participated in this experiment that included the following steps: (i) a run on a mixture of authentic CF, TB, and TP to demonstrate the separation efficiency of HPLC, see Figure 4; (ii) appropriate dilution of the guaraná powder extracts with 0.1% aqueous formic acid; (iii) runs using one diluted extract/group, and examination of the produced chromatogram; (iv) a run on the diluted extract to which authentic sample of CF, TB and TP were added for component identification, see Figure 5. All chromatograms were sent to the students. This activity required four hours.Figure 4 shows the power of HPLC in separating the mixtures of authentic MXs, with retention times ca. 1.8, 2.7, 3.8 minutes, respectively; this agreed with literature values [17,27]. This plot, was sent to the students along with a table showing the concentrations of TB, TP, and CF (upper left corner of Figure 4) and the corresponding peak areas, from which the students constructed Beer’s law plots.Figure 5 shows the complexity of analyzing natural product extracts. Thus, the chromatogram shows eight peaks (components), three of them (TB, TP, and CF) were identified using internal standards. For lack of time in CAL, no attempt was made to separate the MXs peaks from the other components. This could have been done, e.g., by a combination of using different elution solvents; longer elution times (15-30 minutes), and a lower HPLC column temperature, 23-28°C [4,19,28]. Because the chromatograms showed a well separated CF peak, the students calculated the concentration of this component; the values calculated were 3.1 wt% and 2.8 wt% of the guaraná powder. The difference between these and the apparent CF concentrations are most certainly due to other components in the extract that absorb at 272 nm. Later, the students showed and discussed their results in the classroom. Their comments on the project showed their positive reaction because of its relevance to experimental planning and consumer products analysis.
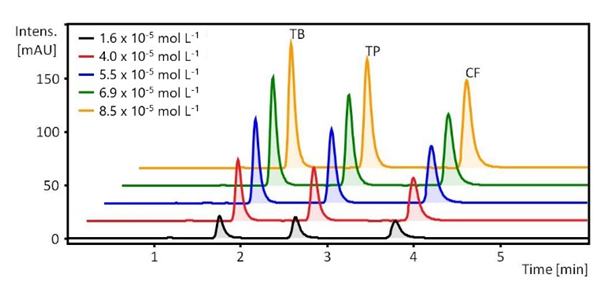 | Figure 4. HPLC chromatograms for an authentic mixture of the three methylxanthines, MXs. The peaks from left to right are those for theobromine, TB, theophylline, TP, and caffeine, CF. The stacked (and shifted to the right on the elution time axis) plots are for different MXs mixtures whose concentrations are listed in the upper left corner, see item 2.2 for the HPLC analysis conditions |
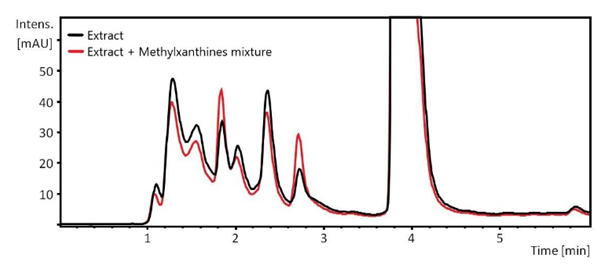 | Figure 5. An example of methylxanthine identification using extract to which authentic standards of theobromine, theophylline and caffeine were added. The black and red curves refer to the original extract and that to which the authentic standards were added, respectively. Areas of the peaks at retention times ca. 1.8 and 2.7 minutes were enhanced |
4. Conclusions
- Guaraná soft drink is very popular in Brazil, and is exported in large quantities. The students were interested in this project because guaraná seeds contain relatively high concentrations of biologically active substances (MXs and polyphenols) that have stimulating and antioxidant effects and, if consumed in excess (as in energy drinks), may pose health risks. We exploited the fact that analysis of this extract is a challenging task to introduce two topics: use of chemometrics to optimize a process (e.g., extraction, chemical reaction, etc.); applying tandem techniques to solve a complex, everyday situation, viz., the consumption of foods and beverages. We recommend this project to science students (chemistry, engineering, pharmacy) because of its relevance, simplicity, low cost, safety, and its use as hands-on learning of chemometrics and analysis of relatively complex mixtures.
ACKNOWLEDGEMENTS
- We are grateful to the students who participated in this project. O. A. El Seoud thanks FAPESP (grant 2014/22136-4) and CNPq (grant 306108/2019-4) for financial support and research productivity fellowship, respectively; N. Keppeler and S. S. Santos thanks CNPq for PhD and postdoctoral fellowships, grants 141853/2019-0, and 409492/2017-5, respectively.