Otávio Luiz Bottecchia
Instituto de Química, Universidade Federal de Uberlândia, Uberlândia, MG, Brazil
Correspondence to: Otávio Luiz Bottecchia, Instituto de Química, Universidade Federal de Uberlândia, Uberlândia, MG, Brazil.
| Email: |  |
Copyright © 2019 The Author(s). Published by Scientific & Academic Publishing.
This work is licensed under the Creative Commons Attribution International License (CC BY).
http://creativecommons.org/licenses/by/4.0/

Abstract
A new experiment is proposed as a laboratory activity for industrial chemistry undergraduate courses. It is a technique based on volumetric titration restricted to a constant volume. The modification of this titration imposes also immediate homogenization as in a continuous-flow stirred tank reactor (CSTR). As a consequence, the reaction mixture flows out of the cell during all the titration process. The detailed setup is described. The mass balance is used to derive the general equations governing the concentrations as function of the titrant volume. These equations are applied to the simplest case of a strong acid with a strong base reaction. The theoretical result is a continuous mathematical step function that predicts both the shape of the titration curve and the volume at the equivalence point. In the laboratory, the actual constant volume titration was carried out to gather experimental data. A pHmeter was used to monitor the titration from the beginning to beyond the equivalence point. The experimental data fit to the simulated curve. The fit is better if the solutions contain an inert salt to compensate ionic strength variations. An acid-base indicator was also used to detect the experimental equivalence point. The theoretical volume at the equivalence point is again confirmed by the experiment.
Keywords:
Open system, Model, Flow kinetics
Cite this paper: Otávio Luiz Bottecchia, Constant Volume Titration: A Physical-chemistry CSTR-like Experiment, Journal of Laboratory Chemical Education, Vol. 7 No. 2, 2019, pp. 38-43. doi: 10.5923/j.jlce.20190702.03.
1. Introduction
Experiments directed to industrial chemistry or chemical engineering courses are demanded, especially within institutions that have upgraded their Bachelor’s degree curricula. Highlighted themes are open systems and continuous-flow, described as differential equations. The mathematical solutions are then validated with experimental data. It is a challenge to work out experiments that relate to the concepts of didactic mathematics, computation, and chemistry altogether [1]. Several approaches have been reported to investigate chemical kinetics as undergraduate experiments, such as multi-impulsion techniques and flow gradient chamber [2], tracer injection [3], back titration [4], and chemical oxygen demand analysis [5]. The present work aims of simpler experimental procedures and proposes a modification of the volumetric titration: the volume of the titrand must be constant. As a consequence, there is an outflow from the system, as well as an inflow. Under this condition and with an efficient mixing, the titration behaves like a continuous-flow stirred tank reactor [6]. The investigation consists in modeling one or more concentrations with differential equations, monitoring the concentration and comparing model with experimental results. Prerequisites are stoichiometry, limiting reactant, volumetric analysis and infinitesimal calculus. Section 3 describes the ideal experiment. The general model developed in Section 4 is applied to a specific case in Section 5 (acid-base reaction). Section 6 contains experimental details and a protocol.The constant volume titration has completely different goals compared to conventional titration. The almost identical experimental setup justifies the nomenclature, without denoting that the two procedures compete nor that they should be comparable.
2. Objectives
The goal is to present a technique based on volumetric titration restricted to a constant volume of titrand. The objectives are to find out an equation that relates the concentrations in such a system as a function of the titrant volume and to compare it with experimental results.
3. Description
A cell contains a titrand. A titrant is added into the cell. A buchner flask (kitasato flask) or anything with a side-arm can be used as shown in Figure 1. The mixture is simultaneously stirred while it flows out. The cell accommodates the accessories for monitoring physico-chemical properties. The cell geometry and the height of the side-arm define the cell volume, V, which must be known and determined experimentally. 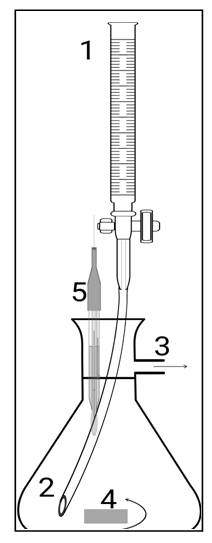 | Figure 1. The titrant flows from the burette (1) through the catheter (2) into the bottom of the cell, which was previously filled with the titrand up to the side-arm level (3). A magnetic bar (4) mixes the two solutions. Some of the mixture overflows and is discarded. The volumes of titrant and of the discarded mixture are equal. An external meter (not shown) connected to a probe (5) measures convenient properties |
The experiment is said to be in standby when both burette and cell are full and the magnetic bar is running. Ideally, the rotation speed must be limited to avoid disturbance of the surface. Otherwise, the mixture would flow out in batches and the volume would not be constant. The titration starts by letting the titrant flow into the bulk of the titrand.A probe monitors the concentration of a solute in the mixture,  as a function of the volume of titrant,
  or simply
  The measurement includes the initial condition (standby mode), when no titrant was added
  through the equivalence point
  and beyond it
  The final volume is arbitrary. In the case of an acid-base reaction, the probe is the combined pH glass electrode.
4. Theory
Some assumptions are made: namely, the chemical reaction is irreversible; the stoichiometric ratio is 1:1; and both chemical and homogenization rates are instantaneous. If the titrant is the limiting reactant, then it does not flow out of the cell. Otherwise, it must flow out of the cell after dilution with the mixture. In the burette no reaction occurs and the titrant concentration,  , is always constant. In the cell, the titrant concentration,
  , must be zero before the equivalence point and increases asymptotically after that.
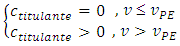 After the equivalence point, titrant gradually substitutes for the mixture in the cell. The titrant concentration increases. Eventually its concentration in the cell must equal the concentration in the burette:
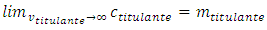 | (1) |
The titrand concentration,  in the cell depends on the volume of titrant according to a function to be determined. It starts from a finite, known value,
  and decreases for two reasons. First, the chemical reaction consumes part of it. Second, some of its excess flows out. The decrease is monotonous. At the equivalence point and after that it is zero.
4.1. Before the Equivalence Point
The initial quantity of titrand is ntitulado,0: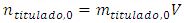 | (2) |
The addition of an infinitesimal amount of titrant, 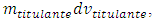 causes the same infinitesimal change of titrand quantity due to the chemical reaction and another infinitesimal change,
  , due to the leakage. The infinitesimal change of the concentration, dmtitulado, takes into account both effects:
 | (3) |
Rearranging: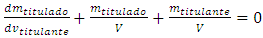 | (4) |
The initial condition necessary to solve this differential equation is the titrant concentration: Thus, Equation 4 solves to:
 | (5) |
This result can be obtained by routine calculus techniques [7] or by using free software [8].
4.2. At the Equivalence Point
At the equivalence point,  , there is no limiting reactant nor excess reactant. The quantity of titrant added equals the quantity of the remaining titrand, which can be used to determine the volume of titrant at the equivalence point. For this, the initial quantity of titrand is diminished by the quantity lost in the leakage,
  which depends on the concentration and volume of titrand:
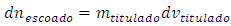 The constant volume imposes that:
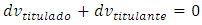 Therefore:
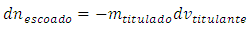 The titrand quantity lost in the leakage is:
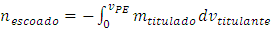 | (6) |
Using Equation 5 in Equation 6 and integrating: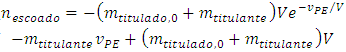 | (7) |
At the imminence of the equivalence point, the quantity of titrant that will have reacted is nefetivo. It can be calculated from the initial quantity of titrand (Equation 2) and the quantity of titrand lost in the leakage (Equation 7):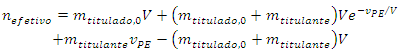 | (8) |
Rearranging: 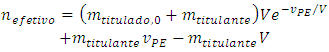 | (9) |
The assumption of stoichiometric ratio 1:1 requires that the quantity of titrant is also 
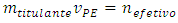 Therefore:
 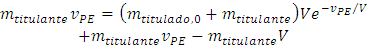 | (10) |
Solving to vPE: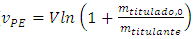 | (11) |
4.3. After the Equivalence Point
This is a washout process with the titrant because there is no chemical reaction after the equivalence point. The titrant dissolves in the cell and gradually replaces its content. In the limit, the cell contains only titrant solution.The infinitesimal increase of titrant from the burette is  . The infinitesimal decrease in titrant from the leakage is
  . Thus, the material balance in the cell is:
 Rearranging:
 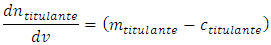 The cell volume cannot be zero, otherwise the experiment has no physical existence. Thus, it is accurate to divide both members by V. After recognizing the following identities:
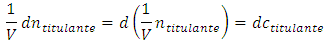 One obtains:
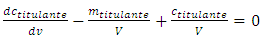 | (12) |
The mathematical solution that satisfies Equation 1 and the asymptotic behavior is Equation 13: | (13) |
5. Application with Acid-base Reaction
Further, additional considerations allow the theory described in Section 4 to be applied in an acid-base titration. Equations 5, 11, and 13 can predict the titration curve.The ionic product of water is to be taken into account, the activity coefficients are assumed to be unitary and both acid and base are assumed to be strong. Section 5.1 describes the case ignoring the contribution of water with hydronium ion. Section 5.2 takes this into account.
5.1. No Hydronium Contribution from Water
The reactant in excess determines the pH. It is the titrand before the equivalence point. At the equivalence point, the pH of the mixture is neutral (7.00 at 25°C or  at other temperatures). After the equivalence point, the titrant determines the pH [7].
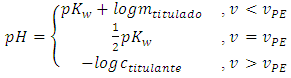 | (14) |
A consequence of disregarding the complete equilibrium system is that Equation 14 is discontinuous at the equivalent point. The more concentrated the reactants, the less this is important. The discontinuity is only detected if the titration curve is plotted with too many data points. If the magnitude of the cell is some tens of milliliters and the concentrations are tenths of mol/L, the use of Equation 14 is acceptable up to 0.2 mL before and after the equivalence point.
5.2. Hydronium from Water Considered
The ionic product of water requires that: | (15a) |
 | (15b) |
Before the equivalence point, the contributions with hydroxide ion are x (from water) and mtitulado (from the titrand). Equation 15a can be rewritten: and solved because the contribution with hydronium is also x:
 Solving the quadratic equation, the only root with physical meaning is [9]:
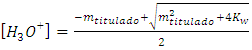 | (16) |
Analogously, after the equivalence point, the contributions with hydronium from water and titrant are respectively, y and ctitulante: 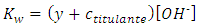 Again, the contributions from water with hydronium and hydroxide ion are equal. The mathematical solution is:
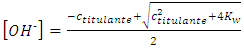 | (17) |
The complete pH function is therefore: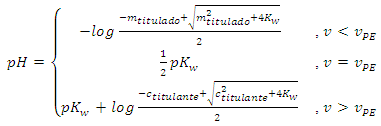 | (18) |
Equation 18 offers the best resolution. This can be important around the equivalence point. Opposed to Equation 14, it is continuous at the equivalence point because the limit from the left is equal to the limit from the right: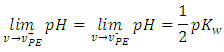
5.3. Traditional Titration
In a traditional titration, Equations 5, 11, and 13 substitute for classical Equations 19, 20, and 21, which were written with the symbols used here. Equation 21 is needed below.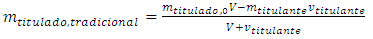 | (19) |
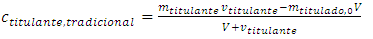 | (20) |
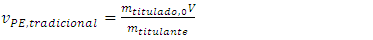 | (21) |
Equations 14 and 18 are still valid. Beside the assumptions earlier described, Equations 19-21 require that the volumes are additive1.
6. Experimental Details
The cell volume excludes the volume of any accessory inside the mixture. The constant volume titration must be slow to guarantee an efficient homogenization.
6.1. Setup
Additional details to the idealized experiment are necessary in the laboratory.
6.1.1. Accessories
The parts shown in Figure 1 must be kept steady at all times necessary to carry out experiments related to each other. The length of the electrode imersed in the cell, the dimensions of the magnetic bar and the diameter of the catheter influence the effective cell volume.
6.1.2. Acid-Base Indicator
Besides the electrometric measurement of pH, an acid-base indicator is used to visually detect the equivalence point experimentally. The comparison of the experimental equivalence point2 with the prediction from Equation 11 is is an additional test to the theory.If the indicator is present only in the titrand, as is usual in a traditional titration, then the color fades because of its dilution. This makes the color change hard to see. To avoid dilution, there must be equal amounts of indicator in both titrant and titrand.
6.1.3. Catheter
Use of a catheter is better than instilment. It can be aligned so that it dispenses the titrant along the laminar flow in the cell. The homogenization can be seen if the acid-base indicator has been added. The best position for the catheter is as far as possible from the side-arm (part 3, Figure 1) and near the magnetic bar (part 4, Figure 1). This arrangement is efficient even if the rotation speed is slow, when the liquid surface is flat, and also if the probe distorts the hydrodynamic geometry of the liquid.
6.1.4. Water-jet Vacuum Aspirator
All experiments are to be conducted using a water-jet vacuum aspirator attached to the side-arm (part 3, Figure 1). A constant outflow was only possible with a pressure gradient. Otherwise the liquid in the cell accumulates to a certain extent, when it suddenly spouts out. This behavior diverges from the constant volume assumption.An electric pump can be used instead. In this case, care is to be taken to collect the outflow and to protect the equipment. An efficient moisture trap must be used.
6.2. Protocol
Calibrate the pHmeter with basic and neutral buffers according to the instruction’s manual. Fill up the burette with HCl solution. Make sure there are no air bubbles in the tip and in the catheter. Setup the glassware and accessories according to Figure 1. Attach the water-jet vacuum aspirator and let it work. Add into the cell the desired aliquot of NaOH solution. Run the magnetic bar. Fill up the cell with distilled water. Take care to avoid overflow. Note the pH. Start the first addition of titrant by opening the burette, letting the desired volume flow (1 mL or more) and closing it. Proceed slowly. Wait the pHmeter to stabilize. Note or record the pH. Repeat addition as required. When the equivalence point is near, the titrant volume step must be decreased (0.2 mL or less) for a better plot resolution. If the indicator color changes, stop addition and note the pH. Continue the addition after the equivalence point. The titrant volume step can be increased again. Once finished, remove all accessories, transfer the cell content to a graduated cylinder and measure the cell content.Before carrying out additional experiments, make sure to keep the accessories steady (see Section 6.1.1). Keep them untouched and purge the cell with plenty of distilled water. Remove enough water from the cell in order to leave room for the next NaOH aliquot. Pipete the desired aliquot into the cell and complete the volume with distilled water. Fill up the burette again and start the new experiment. When finished, remove all accessories and measure the cell content as indicated in the last paragraph.
6.3. Experimental Conditions
Dry potassium hydrogen phtalate was used to standardize the NaOH stock solution, which, in turn, was used to standardize the HCl stock solution. The technique was the traditional titration. All reagents were analytical grade from Vetec. To one liter of each stock solution, one milliliter of hidroalcoholic solution of phenolftalein was added. The pH was monitored with a pHmeter Analion AN-2000 and a combined glass electrode. A 100 mL cell was used. The exact volume depends on the configuration and was determined with an error of ± 2 mL. The standard deviation was calculated from eight measurements. The experiments were carried out at room temperature (23°C ± 3°C) controlled by an air conditioner.
7. Results and Discussion
Equation 18 was used to plot the green line in Figure 2. The electrometric measurements were plotted in red. The prediction from the equation agrees with the measured pH only at the end of the curve. Just before the equivalence point, the prediction is greater than the actual results. The inflection point agrees with the equivalence point. Before that the prediction is always lower.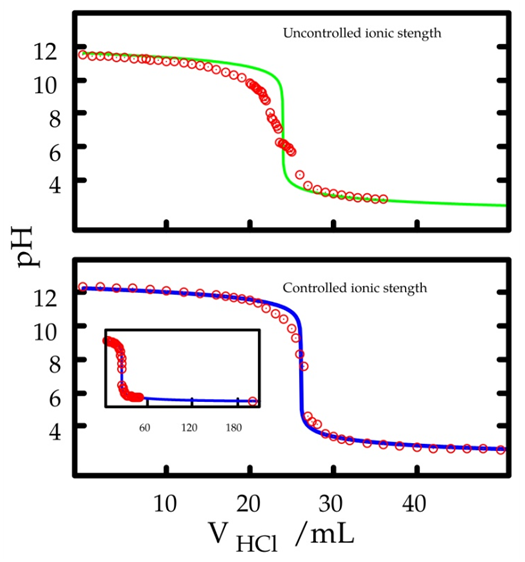 | Figure 2. Prediction from Equation 18 (continuous lines) compared to the experimental results (red circles). Upper green curve: 75.0 mL aliquot of 0.00477 mol/L NaOH in a 75 mL cell volume; 0.0130 mol/L HCl; no offset. Lower blue curves: 75.0 mL aliquot of 0.0100 mol/L NaOH and 0.0900 mol/L KNO3 in a cell 96 mL volume; 0.0250 mol/L HCl and 0.0750 mol/L KNO3; offset 0.36 pH unit. The inset shows the extended titration curve |
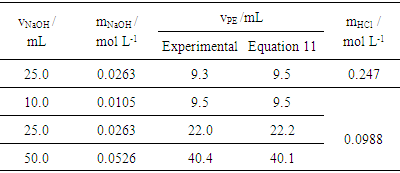
There are two possible causes for the deviation. The uncontrolled ionic strength [10] and the influence of carbon dioxide from atmospheric air. The former influences the acid-base equilibrium. The latter generates sodium bicarbonate, which has a buffer effect. It is worthwhile to investigate the first one because of its conceptual nature and practical consequences. No attempt to block access of carbon dioxide to the solution was made. The necessary setup [11, pp. 358-360] to accomplish such a goal would make the experiment unfeasible as an educational experiment.To investigate the ionic strength, it was made approximately constant by adding an inert electrolyte. Potassium nitrate was chosen. The composition of the titrant was 0.025 mol/L HCl and 0.075 mol/L KNO3. The initial composition in the cell was 0.010 mol/L NaOH and 0.090 mol/L KNO3. Thus, the decrease in ionic strength caused by the chemical reaction (production of water from hydronium and hidroxide ions) is masked by the potassium nitrate. As in other titrations, phenolphtalein was also added both in titrant and in titrand. However, its concentration is so low that the contribution to the ionic strength is minimal. The effect of the ionic strength in the titration curve is a vertical shift. Thus, an offset had to be included into Equation 18, whose value (0.35 pH units) was found by trial and error. A significantly better fit is then obtained (blue lines). It is also worthwhile to investigate the equivalence point. Several experiments were carried out with different concentrations and aliquot volumes. The equivalence point was determined visually and compared with the prediction from Equation 11. Table 1 shows an agreement within 0.3 mL. In the worst case, that means an error of 2%.Table 1. Constant volume titration of NaOH with HCl: experimental equivalence point compared to the prediction from Equation 11. Cell volume: 94 mL. Column 1 shows the NaOH aliquot volumes. Column 2 shows the NaOH concentration. Columns 3 and 4 show, respectively, the HCl volume at the equivalence point as seen via the indicator color change and as predicted by theory. Column 5 shows the two titrant concentrations used in four experiments
 |
| |
|
Table 1 shows that a change from 0.247 mol/L to 0.0988 mol/L (ratio 2.5) for HCl leads to a change from about 9 mL to 22 mL (ratio 2.4) for 25.0 mL of NaOH. This can be misinterpreted as a false proportionality as occurs in traditional titration. It is not proportional; it is logarithmic. This particular result is merely the consequence of a mathematical simplification. The identity [12]: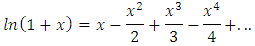 can be simplified for small values of x:
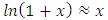 Applying this simplification to Equation 11:
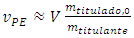 | (22) |
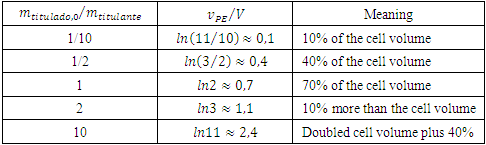
Equation 22 explains the proportionality for small  ratios. It is just in this particular case of the general Equation 11 that Equation 22 is identical to Equation 21. Table 2 demonstrates numerically the non proportionality with ratios ranging from 1:10 to 10:1 It also helps in figuring out the equivalence point before the experiment is made. For instance, if 0.050 mol/L NaOH is titrated with 0.025 mol/L HCl (ratio 2) in a 500 mL cell, then the the equivalence point is expected to be 10% more than 500 mL, that is, 550 mL.
 Table 2. Expected numerical equivalence points according to Equation 11 in a constant volume titration for some common titrand/titrant ratios
 |
| |
|
As a final remark, although the cell volume is easily measured with laboratory glassware, Equation 11 can be used to estimate it as an exercise. In this case the experimental equivalence point,  , from Table 1 is plotted against
  . The angular coefficient is the cell volume. The results from Table 1 was used for this purpose. The result was 94 mL as measured with a graduated cylinder.
8. Conclusions
The proposed experiment can be used in either undergraduate industrial chemistry or chemical engineering courses. Several concepts are encompassed: stoichiometry; equilibrium; limiting reactant; and continuity in open systems. The model itself is a concept to be discussed both in chemistry and calculus classrooms. The mathematical concepts range from infinitesimal calculus, linearized plots, basic statistics, limits and differential equation. Use of computational free software can be exploited. Due to the experiment originating from routine research, the material and equipment required are likely to be available in most campus laboratories. Time needed for completion is less than two hours. The theory fits the experimental results quite well. The deviation is a consequence of simplifying assumptions. It is an opportunity to discuss the role of the model in a scientific context along with its limitations.
Notes
1. The volume of a mixture is additive if the densities of both solutions before the mixture are approximately equal to the density of the mixture. In most cases this is true for diluted solutions, that is, if the density of the solutions or their mixtures are close to the density of the solvent.2. The term “equivalence point” is a theoretical concept based on the stoichiometrically calculated from the measured amount of titrand [11, p. 280]. It is given by Equation 11. Here, the “experimental equivalence point” is the titrant volume that the observer reads when the color indicator changes.
References
| [1] | I. R. Epstein, “The role of flow systems in far-from-equilibrium dynamics”, Journal of Chemical Education, vol. 66(3), 191-195, 1989. |
| [2] | A. C. L. Conceição, and H. P. Diogo, “Determinação de parâmetros cinéticos em fluxo com câmara de gradiente e detecção”, Química Nova, vol. 36, pp. 905-910, 2013. |
| [3] | J. M. Lopes, F. Lemos, C. Pinheiro, F. R. Ribeiro, F. D. Magalhães, A. Mendes, and C. Costa, “Teaching residence time distributions in the laboratory”, International Journal of Engineering Education, vol 18(6), pp. 674-681, 2002. |
| [4] | D. C. Sundberg, T. E. Carleson, and R. D. McCollister, “Experiments in undergraduate reaction engineering: startup and transient response of CSTR”, Chemical Engineering Education, summer volume, pp. 118-121 and 139, 1977. |
| [5] | I. Durruty, and M. A. Ayude, “Modeling of an industrial anaerobic digest”, Chemical Engineering Education, vol. 48(2), pp. 71-78, 2014. |
| [6] | L. D. Schmidt, The Engineering of Chemical Reactions, chap. 3, Oxford University Press, Oxford, 1997. |
| [7] | W. P. Boyce, and R. C. Diprima, Elementary Differential Equations and Boundary Value Problems, Wiley, New York, 7th ed., 2001. |
| [8] | J. E. Vilate, Mathematics for Engineers and Science Labs using Maxima, Apple Academic Press, Florida, 2019. |
| [9] | O. L. Bottecchia, Teoria no Laboratório de Química, pp. 158-161, Scanner, Uberlândia, 2017. |
| [10] | J. W. Moore, and R. G. Pearson, Kinetics and Mechanism, pp 272-276, John Wiley & Sons, New York, 1981. |
| [11] | W. J. Blaedel, and V. W. Meloche, Elementary Quantitative Analysis: theory and practice, Harper & Row, New York, 2nd ed., 1963. |
| [12] | I. S. Gradshteyn, and I. M. Ryzhik, Table of Integrals, Series and Products, p. 53, Elsevier, Amsterdam, 2007. |

 Abstract
 Reference
 Full-Text PDF
 Full-text HTML