-
Paper Information
- Next Paper
- Paper Submission
-
Journal Information
- About This Journal
- Editorial Board
- Current Issue
- Archive
- Author Guidelines
- Contact Us
Journal of Laboratory Chemical Education
p-ISSN: 2331-7450 e-ISSN: 2331-7469
2019; 7(2): 33-37
doi:10.5923/j.jlce.20190702.02

Investigation of Two Component Phase Diagrams of Oleic Acid- Palmitic Acid and Pentadecanoic Acid - Palmitic Acid Systems, Simple Green Experiments for Under Graduation Physical Chemistry Laboratory
 Abstract
 Reference
 Full-Text PDF
 Full-text HTML
Mina Jamialahmadi1, Zahra Ahmadabadi2
1Invited Professor at Farhangian University of Mashhad, Mashhad, Iran
2Department of Chemistry, Faculty of Science, Farhangian University, Tehran, Iran
Correspondence to: Mina Jamialahmadi, Invited Professor at Farhangian University of Mashhad, Mashhad, Iran.
| Email: |  |
Copyright © 2019 The Author(s). Published by Scientific & Academic Publishing.
This work is licensed under the Creative Commons Attribution International License (CC BY).
http://creativecommons.org/licenses/by/4.0/

The phase equilibrium of oleic acid - palmitic acid and palmitic acid - pentadecanoic acid (or stearic acid) experiments associated with the physical chemistry laboratory course for under graduating students of chemistry or engineering chemistry was performed by the simplest equipment of a typical laboratory. These systems which are capable of replacement by hard-risk systems such as naphthalene-benzene or naphthalene – toluene, can not only meet the educational goals of this section, but also have the ability to recycle or use waste as raw materials in other educational laboratories. According to the oleic acid - palmitic acid phase diagram, the melting point of palmitic acid was obtained 64°C. Phase diagram of pentadecanoic acid-palmitic acid system gave the melting points of palmitic acid and pentadecanoic acid, respectively, 66.4 and 60.3°C. ΔHfus of palmitic acid was obtained to be 51.82 kJmole-1 with 3.5% error.
Keywords: Phase diagram, Oleic acid, Palmitic acid, Pentadecanoic acid, Stearic acid, Green chemistry
Cite this paper: Mina Jamialahmadi, Zahra Ahmadabadi, Investigation of Two Component Phase Diagrams of Oleic Acid- Palmitic Acid and Pentadecanoic Acid - Palmitic Acid Systems, Simple Green Experiments for Under Graduation Physical Chemistry Laboratory, Journal of Laboratory Chemical Education, Vol. 7 No. 2, 2019, pp. 33-37. doi: 10.5923/j.jlce.20190702.02.
Article Outline
1. Introduction
- One of the most succinct ways of presenting the physical changes of state that a substance can undergo is in terms of its phase diagram [1]. The phase diagrams show the equilibrium between the different phases, and phase equilibrium is a situation in which the same chemical species exist in different phases, while the chemical potential of the species in the phases is the same [2]. Phase diagram provides useful and valuable information such as the most stable state of a substance at a given temperature, the melting (freezing) point, triple, critical and eutectic points, phase boundaries, and etc. that are important in both research laboratories and industry. One important type of phase equilibrium is solid-liquid equilibrium in the binary system which in its simplest case, two substances are completely soluble in the liquid phase, and completely insoluble in the solid state. These systems are raised in most physical chemistry laboratories around the world for investigation of the simple thermodynamic variables along with convenient running and analysis [3-6]. In addition, the temperature-composition diagrams of these systems are used in designing of industrial processes such as the production of crystals, metal alloys and semiconductors [1].Two-component systems which are currently used in most educational laboratories [7-9] include naphthalene-dimethyl amine [3,10, and 11], Para dichlorobenzene- phenanthrene, naphthalene- phenol, naphthalene- diphenylmethane [11,12] and etc. The fundamental problem with all these systems is environmental pollution, such as air pollution and its harmful effects on respiratory and skin, carcinogenic risks [11], as well as groundwater contamination and thus entrance of the experiments residues and waste to sewage wells. In order to avoid these effects, some laboratory technologists prefer to remove these experiments from laboratory program. In this regard, applying green chemistry in designing experiments related to undergraduate or high school courses, not only can make the idea of replacement of substances and methods inappropriate for the environment and human health in professional and personal lives of learners, but also provides growth and strengthening of this kind of thinking and its development in graduate courses.The main objective of this work is to introduce the binary systems which on the one hand, are without causing environmental problems and adverse effects on human health and match with Articles 3 and 5 of the twelve principles of green chemistry [13] and on the other hand, provide the educational goals related to the curriculum. Several studies have been reported by differential scanning calorimetric [14-18] or other methods [19] on phase transitions of solid and liquid fatty acids, two-component and three-component systems, but this study has been carried out with the goal of using simple and common tools in laboratories and substances with a suitable degree of purity in terms of price and availability. In this study, two-component systems of oleic acid- palmitic acid and palmitic acid- pentadecanoic acid (stearic acid can be used instead of pentadecanoic acid) are used which have the benefits of ease of access, lack of adverse environmental effects and human health, recyclability and reuse or the use of waste as a raw material of this work in other experiments of this training course.
2. Experimental Methods
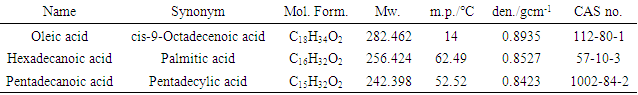
- Oleic acid (CH₃ (CH₂)7C = C (CH₂)7COOH) and pentadecanoic acid (CH₃ (CH₂)13COOH) were prepared from Malaysia as commercial- pharmaceutical grade and palmitic acid (CH3 (CH2)14COOH) with a purity of 95% was purchased from Merck. These substances without further purification were confirmed by controlling the melting point. The most important of physical constants of these substances have been summarized in Table 1 [20].
|
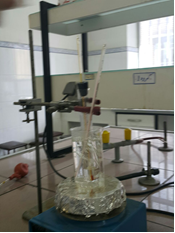 | Figure 1. Water bath plus bulky tube containing oleic acid and palmitic acid |
|
|
|
3. Results and Discussion
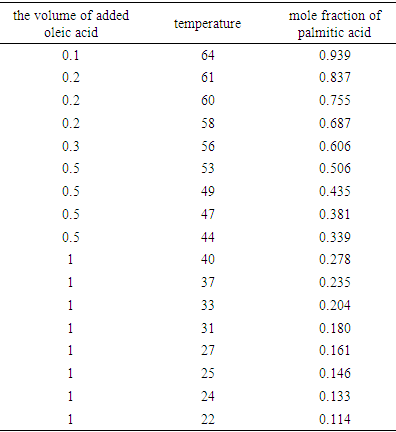
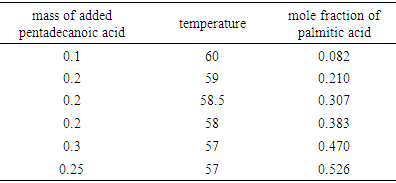
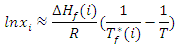
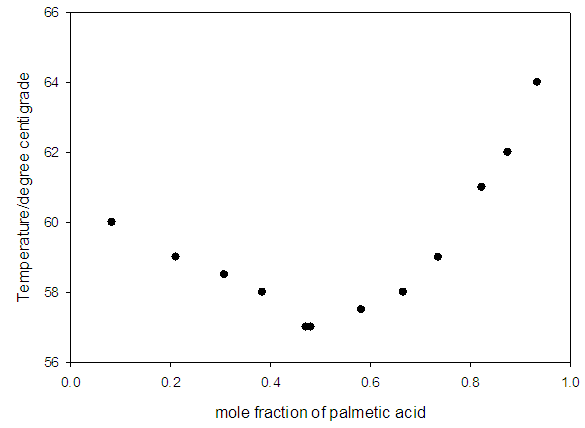
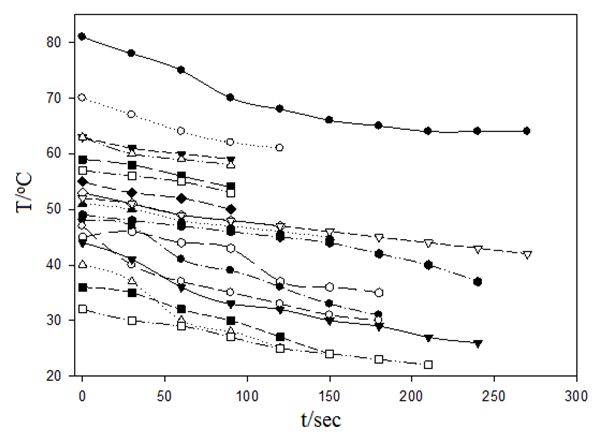
- Table 1 shows the amounts of oleic acid which were added to 1.25 g of palmitic acid, freezing temperatures (the temperatures which two-phase is appeared and the mixture be milky) and the mole fractions of palmitic acid. Figs. 2 and 4 indicate the temperature versus mole fraction of palmitic acid for oleic acid- palmitic acid and palmitic acid- pentadecanoic acid, respectively. Figs. 3 shows the natural log of the mole fraction of palmitic acid versus reverse absolute temperature for oleic acid- palmitic acid system.Figure 5 shows the time-temperature cooling curves for different oleic acid increments. As can be seen, the slope of the curves decreased over time, but, except for the highest curve (pure palmitic acid), due to the presence of oleic acid, no constant melting point was obtained.Extrapolation of these figures gives melting point of 64°C for palmitic acid which shows 1.6% error compared to the real value (62.9°C). Line equation of Fig. 3 determines the value of 51.82 kJ mol-1 (202.09 J g-1) for the fusion enthalpy of palmitic acid in dilute solution of oleic acid in palmitic acid according to the following equation,
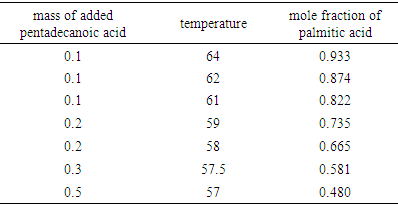
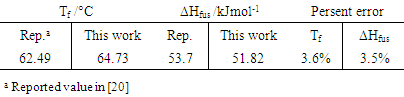
 Compared to the fusion enthalpy reported in the literature [18,20] (208.02 J g-1 and 53.7 kJ mol-1), it has about 3.5% of error. On the other hand, the melting point of palmitic acid and pentadecanoic acid from palmic acid-pentadecanoic acid phase diagrams was obtained of 66.4° and 60.3°C which accompanied with 5.5 and 11.5% error compared with the real amounts of 62.9 and 54°C, respectively. These uncertainties regarding the errors related to experiment methods and equipment used, as well as relatively low purity substances for application in a training lab are justified. The reported values of Tf, ΔHfus, and their corresponding errors for oleic acid have been shown in Table 5.
 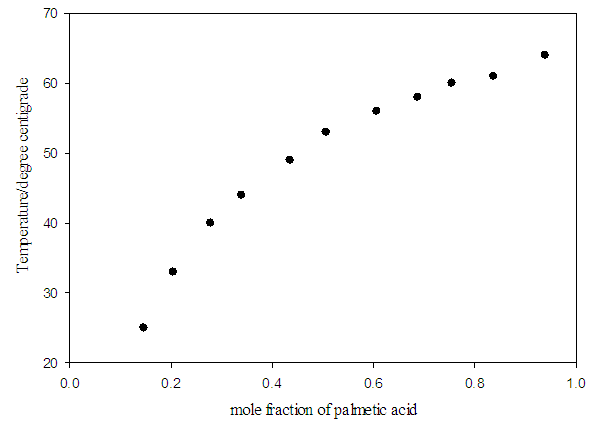 | Figure 2. Temperature against mole fraction of palmitic acid (oleic acid- palmitic acid system) |
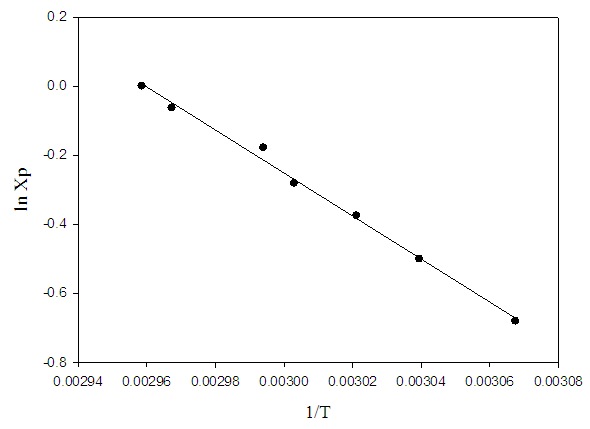 | Figure 3. Natural log of the mole fraction of palmitic acid versus inverse absolute temperature. (oleic acid- palmitic acid system) |
 | Figure 4. Temperature against mole fraction of palmitic acid (pentadecanoic - palmitic acid system) |
 | Figure 5. Fig. 1 Temperature-time cooling curves for increasing oleic acid to palmitic acid |
|
4. Conclusions
- The use of the solid- liquid state equilibrium systems including oleic acid - palmitic acid and palmitic acid-pentadecanoic acid for undergraduate chemistry lab is a good alternative to naphthalene-phenanthrene, naphthalene-diphenylamine, or naphthalene-phenol systems. This replacement has several benefits, including: 1- Using them in repetitive educational labs and large groups is not associated with environmental or human health problems. 2. The waste is simply recyclable or can be used in other experiments, and even if not recycled, it simply decomposes in nature. 3. In these methods, all fatty acids have a melting point below 100°C, and testing with them can be done easily with a water bath. 4. Another advantage of these methods is the similarity of the two-component system derived from these fatty acids with respect to their identical structure, their similar structure with a simple system such as naphthalene-toluene, detecting the melting point of palmitic acid from the phase diagram and calculating the enthalpy of melting which is easily possible and provides the desired educational goals.
List of Abbreviations
- ΔHfus: fusion enthalpyTf: melting point
Funding
- Farhangian University of Mashhad.
Availability of Data and Material
- All experiments were carried out at the Farhangian University of Mashhad.SigmaPlot software was downloaded free of charge from the Internet.
ACKNOWLEDGEMENTS
- Authors thank Ms. Mehrafrooz, the expert of the Chemistry Lab of Farhangian University, and Ms. Fateme Aziz-Abadi, the student at this University, for their help.