-
Paper Information
- Next Paper
- Previous Paper
- Paper Submission
-
Journal Information
- About This Journal
- Editorial Board
- Current Issue
- Archive
- Author Guidelines
- Contact Us
Journal of Laboratory Chemical Education
p-ISSN: 2331-7450 e-ISSN: 2331-7469
2018; 6(4): 122-127
doi:10.5923/j.jlce.20180604.07

Flow Injection Analysis as an Opportunity to Develop Comprehensive Graduation Projects
 Abstract
 Reference
 Full-Text PDF
 Full-text HTML
J. J. Maraver, J. Carbajo, M. López-López, J. D. Mozo
Laboratory of Applied Electrochemistry, University of Huelva, Huelva, ES, Spain
Correspondence to: M. López-López, J. D. Mozo, Laboratory of Applied Electrochemistry, University of Huelva, Huelva, ES, Spain.
| Email: |  |
Copyright © 2018 The Author(s). Published by Scientific & Academic Publishing.
This work is licensed under the Creative Commons Attribution International License (CC BY).
http://creativecommons.org/licenses/by/4.0/

This work describes how the Flow Injection Analysis techniques can be used as a platform for developing graduation projects with several levels of complexity and directed toward undergraduate, master degrees or Ph.D students of diverse degrees (mechanical, electrical or computing engineering, chemistry, pharmaceutical and biomedical technology, etc). Also, they provide the opportunity to coordinate a number of projects into an interdisciplinary large project, which brings the students closer to the true work environment that, more and more frequently, they can find in their working life. Efforts to reduce the economical investment for such projects can be made by assuming the open-science methodology and creating technology with reused parts.
Keywords: Flow Injection Analysis, Chemical Laboratory Instrumentation, Graduation Project
Cite this paper: J. J. Maraver, J. Carbajo, M. López-López, J. D. Mozo, Flow Injection Analysis as an Opportunity to Develop Comprehensive Graduation Projects, Journal of Laboratory Chemical Education, Vol. 6 No. 4, 2018, pp. 122-127. doi: 10.5923/j.jlce.20180604.07.
Article Outline
1. Introduction
- Flow Injection Analysis (FIA) methods are rapid and versatile analytical tools published for first time by Ruzika & Hansen in 1975 [1] decade. They can perform automatic chemical analysis by consuming small amounts of reagents and sample, so they are used in clinical, quality control and production laboratories and there are even a number of official analytical methods based on this technology [2-5].The FIA equipment is based on the arrangement of a series of modules mounted, in the simplest sequential configuration, so that a flow channel goes from a carrier solution reservoir to the detector, where an analytical signal is registered over time (see Figure 1). In an intermediate point some quantity of sample and/or reagent is inserted on the flow channel with an injection valve, and such volume diffuse, mix and reacts as they progress towards the detector. The property measured by the detector varies when this segment passes through in an amount proportional to the sample concentration.
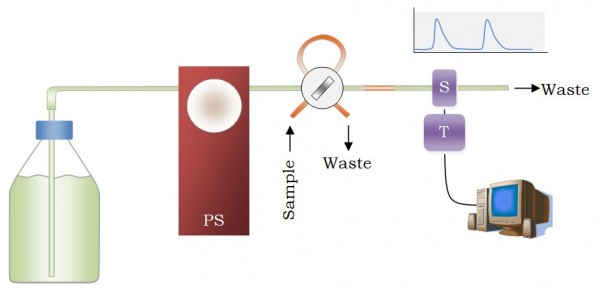 | Figure 1. The simplest single-channel FIA setup. PS: pumping system; S: sensor; T: transducer |
2. Hardware Equipment
- The basic configuration showed in Figure 1 can be implemented with many other modules and also several flow channels can be used and mixed to achieve the desirable results. In any case, the quality of the analytical performance of FIA systems strongly depends on the reproducibility and stability of flow rate, and also on the reproducibility and precision of the injected volume. It is evident that the quality of a FIA system will depend on the characteristics of the modules that compose it. An engineering student would have the opportunity to explore and improve this instrumentation.The necessary investment in equipment for these projects depends on the availability of each laboratory, but can be minimized if reusing, recycling and recovering criteria are followed. On the other hand, the philosophy of open source production facilitates the development times to be adequate for this type of projects while the quality of results is maintained. A revision of characteristics, minimum requirements and versions of each type of modules that commonly includes a FIA system will be presented below.
2.1. Pumping Systems
- The mission of the pumping system is to drive the carrier solution through the flow channel until reaching the detector. The flow rate must be precise and stable over time; it’s desirable that it would be adjustable in the widest range possible including the most used values in FIA techniques (0.01-10 mL min-1). There are several types of pumps that can be used in FIA, from the most expensive to the cheapest ones, being the peristaltic pumps, the syringe pumps and the gravity drip the most used devices.The peristaltic pumps used in chemical laboratories have a drum, with six or more rollers, which rotates to drive the liquid through a flexible tube pressed by the rollers. This configuration produces a pulsed flow that can be minimized by putting some extension of tubing or a column with a big diameter after the pump acting as pulsation damper [6]. The cheapest version of such type of pump is the one used in domestic fish tanks, but they could be conditioned including more rollers and changing the flow rate.The syringe pumps are extensively used to dispense medical treatments in hospitals and can work with extremely low flow rates, so they are also used in microfluidic technologies. There are infusion and withdraw types but, if automation is required, both modes should be supported. Their main lack is the volume that the syringe used can hold, but a pulsation-free flow is achieved. An automatic burette can also be used as syringe pump.In a gravity drip system, the flow rate is regulated by placing the liquid reservoir higher or lower from the rest of elements of FIA system. A pneumatic impulsion can also be used by blowing some gas with controlled pressure into a sealed bottle. The output flow rate can be regulated in addition with a manual valve.If a multi-channel FIA system is implemented, either a multi-channel pump or several single channel pumps can be used depending on wether the desired performance of the system is coordinated or independent for each channel. A variation of FIA systems is the multi-syringe FIA (MSFIA) [7] whose basic schema is showed in Figure 2. This approach substitutes the injection valve by a solenoid valve and uses several syringe pumps to impel both the carrier and the sample.
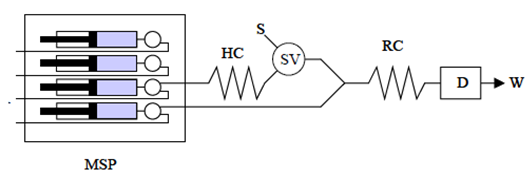 | Figure 2. Schematic diagram of a MSFIA system [8]. MSP, multi-syringe pump; SV, solenoid valve; S, sample; D, detector; W, waste; HC, sample coil; RC, reaction coil |
2.2. Injection Valves
- The function of an injection valve is to insert a precise and reproducible amount of sample in the carrier stream. Usually a two-positions six-ways rotary valve is used to inject, equipped with a loop of tubing that ever contains the same volume. In one position, the valve lets flow the carrier while the injection loop can be externally filled. In the other position, the carrier input is connected to the loop and the volume contained within is pushed along with the carrier.These valves can be manually operated, but also automated with an electrical motor, a solenoid or a pneumatic actuator. The FIA response is proportional to the amount of sample moles injected, so if sample volume is exactly reproducible, the FIA response will be proportional to the sample concentration. To avoid glitches in the FIA response every time that valve is actuated, the valve change should be as fast as possible.Configurations other than two-position six-ways valves can also be used, and even two coupled valves configurations could be used for more complex FIA systems.
2.3. Detectors
- The sensor can be very varied, but it’s always based on measuring a physico-chemical property (colour, temperature, voltage, etc.) that, in some way, is proportionally related to a chemical process suffered by the chemical species to be quantified. The most commonly used detectors are based on optical or electrical properties, that is, spectroscopic or electrochemical detectorsDesktop UV-Visible-IR spectrophotometers equipped with a flow cell can be used for spectroscopic detection and they can follow absorbance or reflectance in a fixed or in a range of wavelength. Also a LED colorimeter can be used for a cheap instrumentation, even the optical detector can be a LED [9] or a photocell and the optical elements (lenses, collimators, etc.) can be replaced by optical fiber.Among the electrochemical detectors, there are potentiometric and amperometric devices. The former are used with those known as selective electrodes and measure the potential of a cell in equilibrium with a high input impedance voltmeter. The latter set a potential and measure the current flowing through the electrode using a potentiostat. Both approaches can use advanced instrumentation but also devoted cheaper instrumentation have been published [10-12].
3. Chemical Optimization
- All factors affecting to the chemical process that develops in the flow channel and/or the physical property measured in the detector will also affect to the sensor performance. That would be investigated and optimized by a chemistry student to achieve the best sensitivity, limit of detection and reproducibility. These factors mainly include carrier parameters such as solvent, pH, concentrations and components, flow rate and others. Also a wide variety of sensor characteristics such as surface morphology, chemical composition, applied potential or wavelength can be investigated if they can be applied to a given sensor type.To optimize a set of experimental operative parameters, a series of experiments can be performed to optimize one parameter at a time, but if there are many parameters and, especially, if synergies affecting the final performance arise between these parameters, advanced techniques of experimental design should be used [13, 14]. Some representative cases of parameter optimization are explained below in detail to illustrate the decision-making process and what are the previous considerations that are usually made.When a colorimetric detection is used, for example by the synthesis of a coloured complex with a metallic ion and an organic chelating agent, is common to consider the stoichiometry of reaction and put the favourable conditions to obtain the biggest amount of colour, i.e. the biggest concentration of complex. Such conditions can be the pH of solution, the solvent polarity, the ligand excess, namely the concentration and volume of injected solution, among others. Such chelation reactions should have a slow kinetic behaviour, so some time should be waited to obtain a totally developed colour. In FIA methods this means that some additional tubing should be included from the injection valve to the detector. This tubing section is known as the “reaction coil” and its function is to delay the arrival of sample to the detector, giving the time enough to complete the reaction as possible, though it is not necessary to have chemical equilibrium for analytical readout. An example of optimizing the length of reaction coil is shown in Figure 3 for the FIA detection of Cu(II) by complexing it with Cuprizone [15]. Obviously, the flow rate will also determine the time required to reach the detector if a reaction coil length is chosen. Thus, both parameters should be considered together, but the last will also affects other characteristics as the carrier consumption or the analytical throughput. It is a common practice to reach a commitment to the best overall features of method.
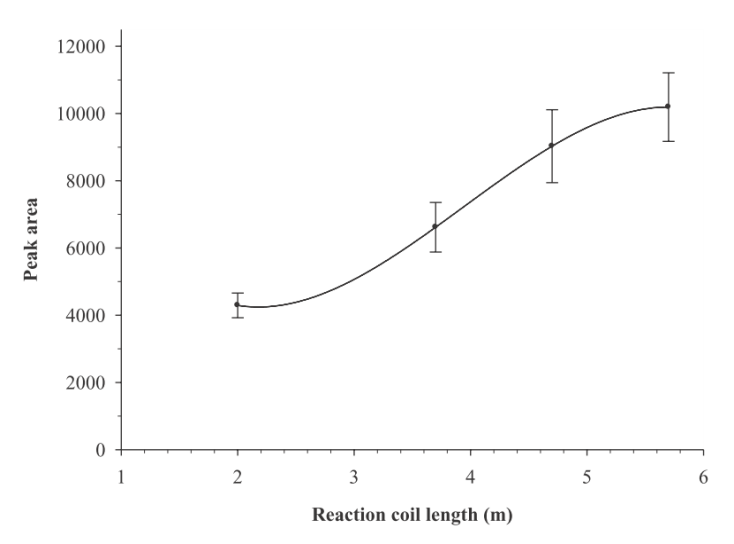 | Figure 3. Reaction coil length effect on absorbance at 595 nm in colorimetric determination of Cu(II) in aqueous solutions [15]. Experimental conditions: carrier flow rate, 0.5 mL/min; injected volume, 25 µL; pH = 8.5; Cu(II) concentration, 2 µg/mL |
 | Figure 4. Potential-time diagram used for the Nifuroxazide analysis by FIA-AdSV on CNF-SPCE [17]. Here the analytical technique is LSV. Ep, preconcentration potential; ti, injection time; tp, preconcentration time; ta, analysis time |
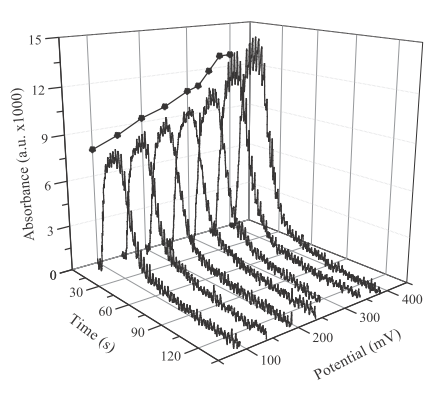 | Figure 5. Spectroscopic absorbance response at 420 nm of a FIA system with spectroelectrochemical detector to 1 mL injections of 2×10⁻³ M ferrocyanide and 0.1 M NaCl solutions for different polarization potentials of stainless steel electrode [26]. Flow rate 3 mL min−1 |
4. Data Recording and Processing
- The typical response in a FIA system, no matter what detector is used is shown in Figure 1. For each sample injection a transient is obtained over a base line signal. The peak value of such transient is proportional to the concentration of sample, although the area is also valuable information. How the sensor response is transformed in electrical signals, digitalized and transferred to a computer could be investigated by an electronic engineering student. Noise depletion, gain stages and impedance adapters should be commonly included in that electronic signal processor, the named as transducer. A sampling frequency range from 1 to 30 Hz is habitual since the flow rate, and hence the transient registered, is broader enough. How such data are processed in the computer would be investigated by a computer engineering student. The data processing software usually includes routines for baseline correction, automatic peak search, random noise numerical filtering, signal integration or deconvolution, among other possibilities. Such software can also integrate routines for the control of the transducer hardware, allowing to change the gain factor or the electronic filter used. Thus, electronic and computer engineers must work together.
5. Automation
- If automation is required, every pump and valve used must allow their remote control. If commercial instrumentation is used, such procedures of remote control should be analyzed and implemented, allowing starting and stopping the pumps, and maybe changing the flow rate, and also opening and closing the valves to control the flow pathway. If instrumentation was designed from scratch, the new modules must include mechanical actuation (by motors, solenoids or any other system) and some type of communication with a remote computer. The easiest way to implement this feature is to include a microprocessor. Nowadays, it’s possible to find several platforms of open-source microprocessors that greatly facilitate the design of intelligent and flexible equipment [27], [28]. The automatic operation of FIA system involves the synchronized operation of pumps, injectors, valves, detectors and data handling. How all the process is synchronized and governed by a computer or one or several microcontrollers would be also investigated by electronics, control and also robotics engineering students.
6. Conclusions
- The FIA experimental setup can have a wide range of parameters that must be optimized, and is complex enough to provide opportunities of study and improvement from many different fields. Virtually a FIA system can be designed for the analytical determination of any chemical species, so the field of application is almost infinite and only depends on the researcher’s inventiveness and imagination.If the same FIA system is analyzed from several perspectives, the possibility arises that each study group, made up of students specialized in a specific field, interact with others, forming an interdisciplinary team in which the different needs, views and even terminologies used will be shared.
ACKNOWLEDGEMENTS
- The experimental data presented in this work was obtained with equipment and facilities founded by the Owner Research Plan of University of Huelva.