-
Paper Information
- Next Paper
- Previous Paper
- Paper Submission
-
Journal Information
- About This Journal
- Editorial Board
- Current Issue
- Archive
- Author Guidelines
- Contact Us
Journal of Laboratory Chemical Education
p-ISSN: 2331-7450 e-ISSN: 2331-7469
2018; 6(4): 118-121
doi:10.5923/j.jlce.20180604.06

Evaluation of Acidity Constants of p-Aminobenzoic Acid by Means of a Bilogarithmic Complete Method
Julia Martín1, Adrián Hidalgo Soria2, Agustín G. Asuero2
1Department of Analytical Chemistry, Escuela Politécnica Superior, University of Seville, Seville, Spain
2Department of Analytical Chemistry, Faculty of Chemistry, University of Seville, Seville, Spain
Correspondence to: Julia Martín, Department of Analytical Chemistry, Escuela Politécnica Superior, University of Seville, Seville, Spain.
| Email: |  |
Copyright © 2018 The Author(s). Published by Scientific & Academic Publishing.
This work is licensed under the Creative Commons Attribution International License (CC BY).
http://creativecommons.org/licenses/by/4.0/

A new bilogarithmic spectrophotometric method has been devised in this paper and applied to the evaluation of simultaneous acidity constants of p-aminobenzoic acid. The method requires a previous knowledge of the limit absorbance of the intermediate specie HR and is based in a minimization process. The pKa values obtained are of the same order of magnitude described in the bibliography.
Keywords: Acidity constant, Spectrophotometry, Bilogarithmic method, p-Aminobenzoic acid
Cite this paper: Julia Martín, Adrián Hidalgo Soria, Agustín G. Asuero, Evaluation of Acidity Constants of p-Aminobenzoic Acid by Means of a Bilogarithmic Complete Method, Journal of Laboratory Chemical Education, Vol. 6 No. 4, 2018, pp. 118-121. doi: 10.5923/j.jlce.20180604.06.
Article Outline
1. Introduction
- For the dissociation of a diprotic acid H2R we have the equilibria
 | (1a,b) |
 | (2a,b) |
 | (3) |
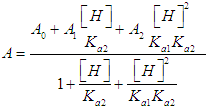 | (4) |
 | (5) |
 | (6) |
 | (7) |
 | (8) |
 | (9) |
2. Experimental Study of the p-Aminobenzoic Acid System
2.1. Reagents
- - p-Aminobenzoic acid (C7H7NO2) M=137.14 g/mol (99%, sigma aldrich); Hydrochloric acid (HCl) solution 1 M (Merck, analytical grade); Potassium hydroxide (KOH) solution 1 M (Merck, analytical grade); Water for ACS analysis (Panreac).
2.2. Apparatus
- - Analytical balance (Metler AE200) (4 digits), Granatario (Metler PJ 400) (2 digits), pH-meter Crison GLP 21 (3 digits), with a combined Ag/AgCl glass electrode. The pH-meter is calibrated using pH buffers 4.01, 7.00 and 9.21, using a two-point calibration method. Ultraviolet-visible molecular absorption spectrophotometer (Shimadzu).
2.3. Solutions
- - p-Aminobenzoic acid 7.39·10-4 M: 0.1014 g of p-aminobenzoic acid are weighed into a beaker, and transferred into a 1 L volumetric flask completing to the mark with distilled water with the aid of an ultrasonic bath for the correct dissolution.- Hydrochloric acid (HCl) solution 0.01 M: From a commercial stock solution 1 M, 0.5 mL is taken into a 50 mL volumetric flask completing to the mark with distilled water.- Potassium hydroxide (KOH) solution 0.01 M: From a commercial stock solution 1 M, 0.5 mL is taken into a 50 mL volumetric flask completing to the mark with distilled water.
2.4. Experimental Procedure
- 2.5 mL of p-aminobenzoic acid solution (7.39·10-4 M) is pipetted into a 25 mL volumetric flask. Then varying amounts of HCl and NaOH solutions are added in order to adjust the pH, completing to the mark with distilled water. The absorbance is measured in the range between 230 to 300 nm (quartz cuvettes, pathlength one-centimetre) versus a blank (see Figure 1). Finally the pH of the solution is also measured (passed into a 50 mL beaker).
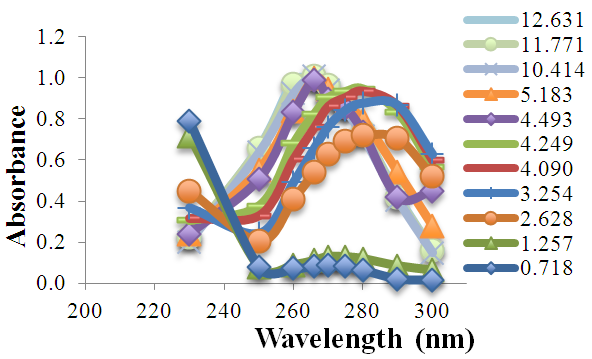 | Figure 1. Absorption spectra of p-amino benzoic acid as a function of wavelength at varying pH values |
|
3. Results and Discussion
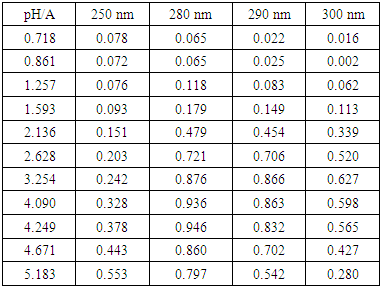
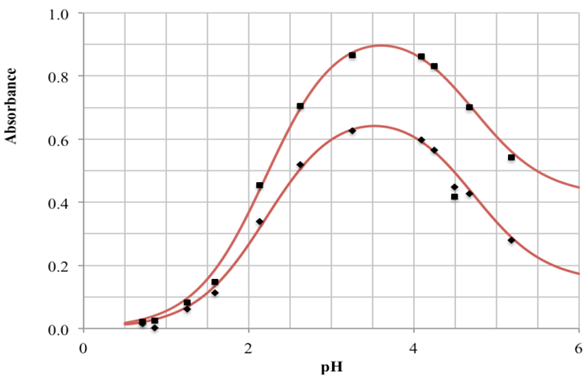
- The p-aminobenzoic acid system shows, at pH values at which the neutral HR specie predominate (Figure 1), a maximum of absorption located towards 280 nm, suffering an hipso and hiperchromic displacement towards 265 nm as the pH values increase, the absorbance values being stabilized in alkaline medium. As the pH decreases, the absorption band located at about 280 nm gradually disappears, appearing at the same time another one located at λ < 230 nm. The largest differences between the limit absorbances occur at 290 and 300 nm (Figure 2), wavelengths that are selected for the evaluation of the pKa values.Figures 3 and 4 (top) show the application of Polster method in the calculation of A1 by applying the orthogonal regression method, which led to values of A1= 0.978 at 290 nm and 0.714 at 300 nm. The application of the bilogarithmic method based on the use of Eqns. 7 and 9 are shown in Figures 3 and 4 (middle and lower) and leads to the values of pKa1 = 2.227 ± 0.027 and pKa2 = 4.682 ± 0.009 at 290 nm, and pKa1 = 2.210 ± 0.023 and pKa2 = 4.660 ± 0.023 at 300 nm. The analysis of residuals is included in the representations pointing in all cases towards the absence of systematic errors, being randomly distributed. The results are in concordance with those obtained by Terada [9], pKa1 = 2.31 and pKa2 = 4.80, applying a distribution method, and Schmid et al. [10]: pKa1=2.204±0.012 and pKa2=4.680±0.014 using potentiometric data. Schmidt’s values derived from the standard potentiometric method agree better with those derived in this work than those from Terada [9].
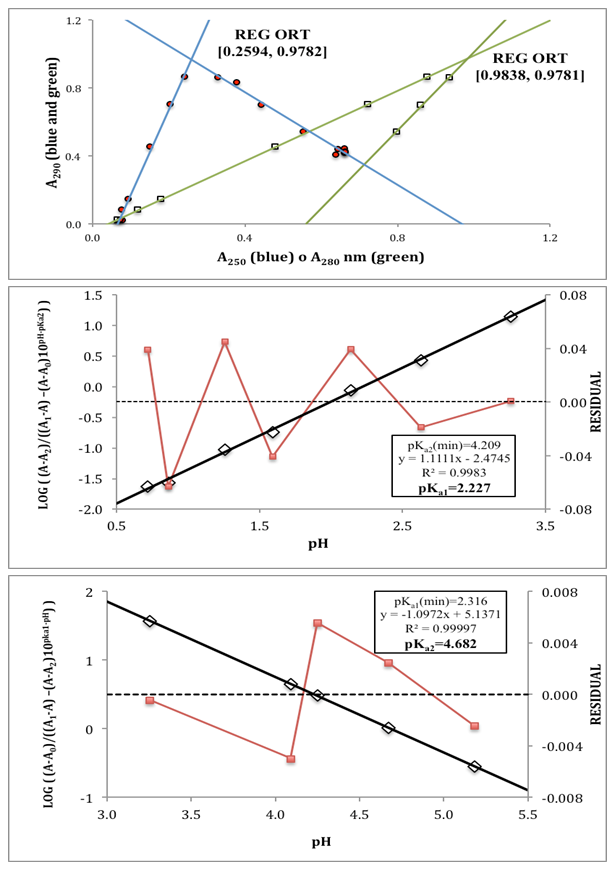 | Figure 3. Top: Polster’s method. Middle and bottom: bilogarithmic method of diprotic acid applied to the calculation of pKa1 and pKa2, respectively, at 290 nm |
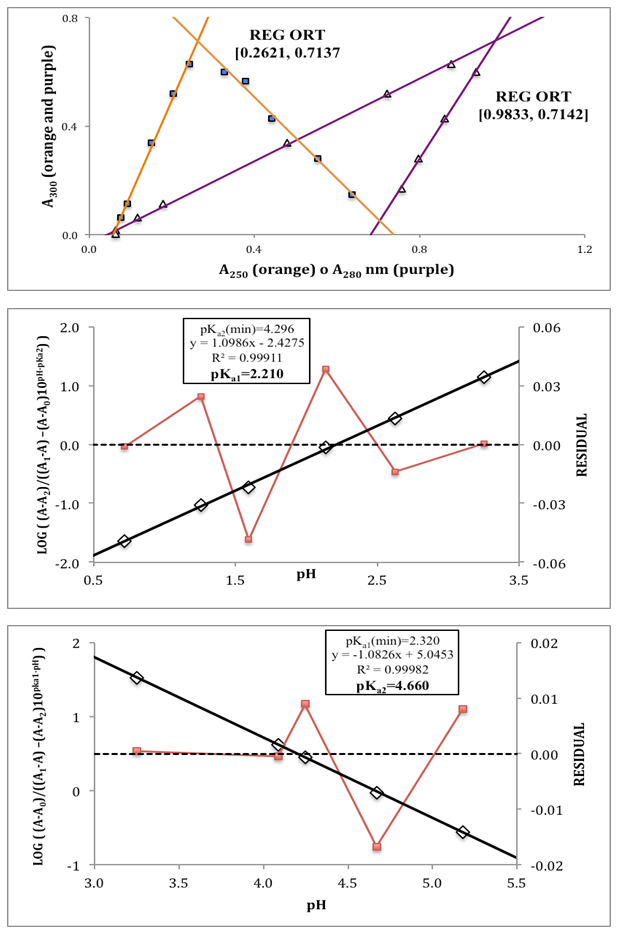 | Figure 4. Top: Polster’s method. Middle and bottom: bilogarithmic method of diprotic acid applied to the calculation of pKa1 and pKa2, respectively, at 300 nm |
ACKNOWLEDGEMENTS
- Thanks are due to the University of Seville for the concession of a Grant destined to the publication of the Bachelor´s degree Final Projects of students.
 Abstract
 Reference
 Full-Text PDF
 Full-text HTML