Journal of Laboratory Chemical Education

p-ISSN: 2331-7450    e-ISSN: 2331-7469

2018;  6(4): 107-117

doi:10.5923/j.jlce.20180604.05


Spectrophotometric Evaluation of Acidity Constants: Can a Diprotic Acid be Treated as a Monoprotic One?

Julia Martín1, Adrián Hidalgo Soria2, Agustín G. Asuero2

1Department of Analytical Chemistry, Escuela Politécnica Superior, University of Seville, Seville, Spain

2Department of Analytical Chemistry, Faculty of Chemistry, University of Seville, Seville, Spain

Correspondence to: Julia Martín, Department of Analytical Chemistry, Escuela Politécnica Superior, University of Seville, Seville, Spain.

Email:

Copyright © 2018 The Author(s). Published by Scientific & Academic Publishing.

This work is licensed under the Creative Commons Attribution International License (CC BY).
http://creativecommons.org/licenses/by/4.0/

Abstract

Spectrophotometric methods are both sensitive and suitable for studying acidity constants in solutions. These methods imply the direct determination of the mole ratio of acid-base conjugate pairs through absorbance (A) measurements in a series of solutions of known pH. The evaluation of acid dissociation constants is very simple, if the species involved in the equilibria may be obtained in pure form (i.e. the limit absorbances A2 and A0 of H2R and R species respectively, are known), and do not overlap (i.e. A1, the limit absorbance of the specie HR is also known). The situation is more complex when the two ionizing groups of a substance lie within three pKa units of one another; the absorbance of the intermediate specie HR cannot then be determined experimentally and calculations being necessarily involved. Based on the expression of the absorbance as a function of the concentration for a diprotic acid, it is possible to calculate the pH values for which the absorbances coincide with the mean of the limit values of the absorbances corresponding to the different species: A*=(A2+A1)/2 and A**=(A1+A0)/2. Then the limit values of pH* and pH**, and the parameters α = pKa1-pH* and β = pH**- pKa2 are calculated, checking in turn under what conditions a diprotic acid can be treated as a monoprotic one from a spectrophotometric point of view. Nevertheless, in order to apply the above expressions A1 must be known, which can be made by the Polster method, i.e. by measuring the absorbances of varying pH solutions at two wavelengths λ1 and λ2, using orthogonal regression method Aλ1 versus Aλ2 (similar errors are assumed in both axis). In this work, a method of evaluation of acidity constants based on the rearrangement of the A versus pH expression is applied which implies the use of a straight-line (y=a0+a1x method) in order to separate the variables Ka2 (=1/a0) and Ka1 (=a0 /a1). The method presupposes the prior knowledge of A1, which may be previously obtained by the Polster method. The theory developed in this paper has been successfully applied to the experimental data reported in the literature for the resorcinol system.

Keywords: Acidity constant, Spectrophotometric methods, Polster method, Resorcinol system

Cite this paper: Julia Martín, Adrián Hidalgo Soria, Agustín G. Asuero, Spectrophotometric Evaluation of Acidity Constants: Can a Diprotic Acid be Treated as a Monoprotic One?, Journal of Laboratory Chemical Education, Vol. 6 No. 4, 2018, pp. 107-117. doi: 10.5923/j.jlce.20180604.05.

1. Introduction

Among the physico-chemical properties of molecules, the acidity constants are of vital importance both in the analysis of drugs as well as in the interpretation of their mechanism of action [1-9]. The solution of many galenical problems requires the knowledge of the acidity constants of compounds [10] having pharmaceutical interest. Many compounds of biological interest have acidity constants, which lie close to each other. Their absorption, further transport and effect in the living organism are affected by the ratio of concentration of protonated and non-protonated forms in various media, the knowledge of acidity constants [11-15] being thus of great worth. Evaluation of acidity constants of organic reagents is also of great value in planning analytical work [16, 17], e.g., the acidity constants can be employed in the design of titration procedures [18] and examining the possibility of separation of mixtures of compounds by extraction. The complexing properties of a molecule depends on the number and steric disposition of is donor centres as well as on its acid-base properties [19-21].
The ionization equilibrium of a monobasic acid
(1)
is characterized by the acidity constant
(2)
β1 is the stability constant of HA, i.e. the constant corresponding to the formation equilibria H + R = HR. The ionic strength and temperature of the solution are assumed to be constant, so that mixed or conditional constants are used in the calculations. Charges are omitted for simplicity.
If A is the measured absorbance (for 1-cm pathlength) of a solution containing a total concentration
(3)
of the acid, then assuming that Beer’s law holds, we have [22, 23]
(4)
(5)
where f0 and f1 are the molar fractions of R and HR
(6)
and A0 and A1 are the limit absorbances of the species R and HR, respectively, i.e. the absorbances of the pure forms of the reagent R and HR, respectively, which have molar absorptivities ε0 and ε1; A00CR and A11CR. Eqn. (5) on rearrangement gives
(7)
The slope of the A-pH curve (Figure 1) is given by
(8)
Differentiation of Eqn. (8) with respect to pH leads to
(9)
The condition d2A/d(pH)2 will locate the point of inflexion (Figure 1) in the graph of A against pH [23-25]. At this point [H] = Ka, and then by applying Eqn. (5) we have at this point (A’’, pH’’)
(10)
Figure 1. Absorbance-pH curve corresponding to a monoprotic acis HR (blue), and first derivative A-pH curve (red) and second derivative A-pH curve (black)
Note that the value of dA/d(pH) at this point [26] is given by
(11)
where ΔA= A1-A0.
The pKa value of a monoprotic acid can thus be determined by plotting absorbances as a function of pH for a series of solutions having a constant concentration CR of reagent. The inflexion point of the curve A versus pH, i.e. the value of pH (equal to pH’’) that satisfies the condition (10) coincides exactly with the pKa value. Although this is strictly true for monoprotic acids, one can wonder if this simple procedure is applicable to diprotic acids. In other words: can a diprotic acid be treated as a monoprotic one? An answer to this question is given in that follows.

2. The Diprotic Acid System

For the dissociation of a diprotic acid H2R we have the equilibriadescribed by the equationswhere we are specifically neglecting charges for the sake of the generality. The absorbance and the composition of any given solution of a diprotic acid having concentration CR (Figure 2) is given by [22, 27-30]
(14)
Figure 2. Top: A2= 0.2; A1=0.4; A0=0.8; pKa1=5.5 and varying ΔpKa. Middle: A2=0.4; A1=0.8; A0=0.2; pKa1=5.5 and varying ΔpKa. Bottom: A2=0.8; A1=0.2; A0=0.4; pKa1=5.5 and ΔpKa (ΔpKa: 1; 2; 2,5; 3, 4; and 5)
(15)
where A0, A1, and A2 are the limit absorbances of R, HR and H2R, respectively, and f2, f1 and f0 the molarity fractions (fj=[HjR]/CR and AjjCR). Let A* and A** be the absorbance values of two samples which have pH values pH* and pH**, respectively, which satisfies the following conditions
Substituting condition (16a) into Eqn. (15), upon rearrangement and collecting the terms containing identical powers of [H*] one obtains
(17)
Solving this quadratic equation for the concentration of hydrogen ions gives
(18)
In this case the negative root has no physical significance. A more compact version of Eqn. (18) can be obtained by usingand thus
(20)
From Eqn. (20) it is seen that [H*]=Ka1 only if – a 10-x is negligible compared with the unity. Effectively when x is large to unite there is a wide range of concentration of [H] over which f1=[HR]/CR is very close to 1, as well as the square root included in the expression (20), and then
(21)
A not unexpected result. The value of the ratio Ka1/Ka2=10x is an important property of a diprotic acid, because this relation can be regarded as the equilibrium constant of the following reaction [31]
(22)
(23)
On the other hand, Eqns. (16b) and (15) can be combined to give, once upon rearrangement and collecting the terms in powers of [H]
(24)
The meaningful solution of this quadratic equation is
(25)
The form in which Eqn. (25) is presented is important. In effect, although it is evident from Eqn. (20) that [H*] tends to Ka1 when x is large, it is not clear from Eqn. (25) that [H**] tends to Ka2 when x is large. In order to place the limiting process on a sounder basis we will demonstrate that the limit of the ratio is actually the desired quantity. Taking into account expression (19a) we get for [H**]
(26)
which can conveniently be re-written as follows
(27)
where for the sake of brevity
The limit of the term in parenthesis, f(x), in Eqn. (27) when x is very large to the unity is the unity. Effectively, by applying L’Hôpital’s rule [32, 33] we get
(29)
Rewriting Eqns. (20) and (27) in logarithmic form gives
(30)
(31)
The values of α and β as a function of x for a few systems taken as examples are shown in Table 1, where it is seen that the situation of pKa values in the pH scale with respect to pH* and pH** is dependent on the relative values of the limit absorbances A0, A1 and A2, as well as on the value of x=ΔpKa. However, except for very close pKa values the acidity constants are easily experimentally obtained making use of expressions (16a,b).
Table 1. Dependence of the α and β values with ΔpKa
     
Nevertheless, Eqns. (16a,b) though instructive are not very useful since A1 must be known. In cases in which equilibria overlap A1 is usually evaluated together with Ka1 or Ka2 by applying graphical methods of evaluation [34], although in some numerical and graphical method of evaluation Ka1 and Ka2 are simultaneously evaluated whereas A1 is not. Thus, at first glance the calculations given above are not only somewhat a waste of time, but are also philosophically unattractive. How can be avoided this logical absurdity? Are the expression derived above merely an academic exercise?. A new method reported by Polster [35-39] and based on the measurements of absorbances at two wavelengths (λ and λ*) allows to evaluate graphically the limit absorbances A1 and A1* for the intermediate specie HR, thus making the matter presented in this work useful both in research as in the teaching of chemical equilibria methods at all levels.

3. Evaluation of the Limit Absorbance A1 from Absorbance Measurements at Two Wavelengths

In the evaluation of acidity constants of overlapping equilibria approximations of various sorts are frequently made in order to carry out calculations. Working at low pH values where it is only assumed the presence of the species H2R and HR, i.e. f0 is close to zero, and from Eqn. (14), we have for measurements at two wavelengths λ and λ*
(32)
(33)
since in this specific case f2 + f1 = 1. Whence it follows that (rearrangement f1 from Eqns. (32) and (33) and equating the result in both cases)
(34)
From which
(35)
and thus plotting A against A* for a series of solutions we obtain a straight line having a slope equal to k and an intercept on the ordinate axis equal to A2 – k A2*. In much the same fashion one can obtain in the pH range in which the species HR and R are present that the absorbance at any particular wavelength is given by
(36)
since in this case 
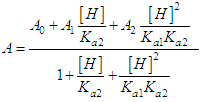
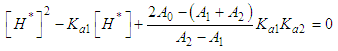
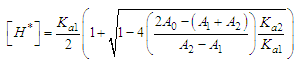
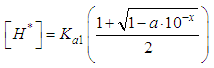
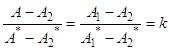
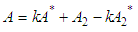
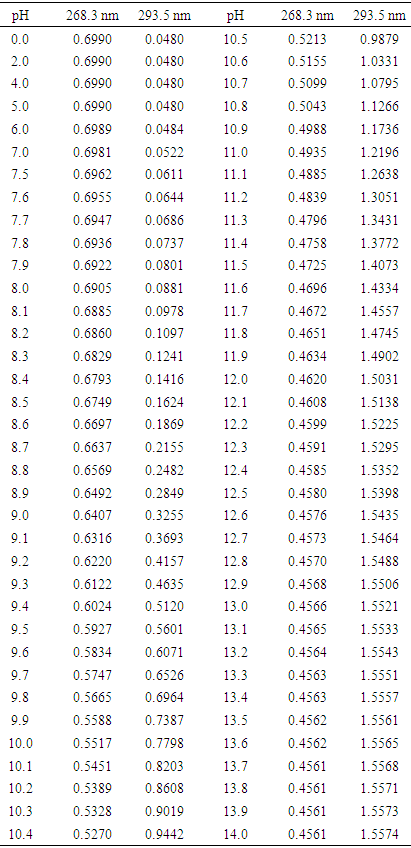
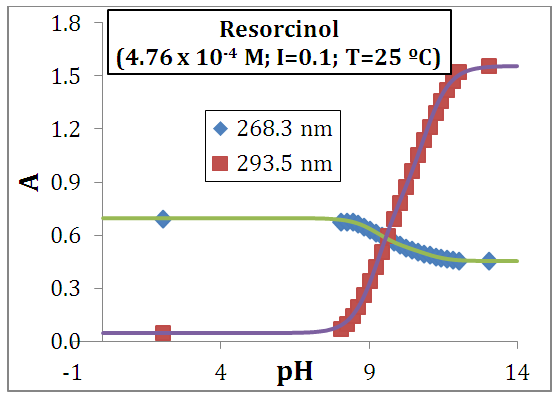
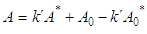
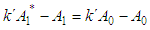
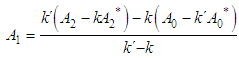
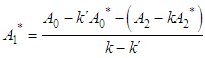
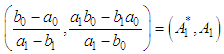
and then from measurements at two wavelengths λ and λ* we have
(37)
from which
(38)
A plot of A against A* for a series of solutions will be a straight line. Its slope will be equal to k’ and the point at which A*=0 is equal to A0 – k’ A0*. It should be noted that Eqns. (32) and (36) are strictly true only when two species are present in solution. However, when equilibria overlaps there is a range of pH in the neighbourhood of ½ (pKa1+pKa2) where the three species R, HR and H2R are present in solution, a curvature being obtained in both representations with these points.
Equations. (34) and (37) are really particular examples of the more general case, easily derivable from Eqns. (33) and (36)
(39)
previously used by Coleman et al. [40] in the determination of the number of species, n, in solution. When n=2 the plot of the absorbance minus the absorbance of a solution j taken as reference, at λ, against the absorbance minus the absorbance of the reference solution, at λ*, for a series of solutions, gives a straight line passing through the origin. Working with different pairs of wavelengths a family of straight lines intersecting in the origin of coordinates is obtained.
It can be easily demonstrated that the point of intersection of the two straight lines is given by
(40)
On the other hand the required unknowns A1 and A1* can be obtained by solving pairs of simultaneous equations derived from Eqns. (35) and (38)
(41)
(42)
which lead to
(43)
(44)
Comparing Eqns. (43) and (44) and Eqn. (40) we see that the coordinates of the point of intersection of both straight lines defined by Eqns. (35) and (38) are given by (A1*, A1). By substituting the expression for k and k’ given by Eqns. (34) and (37), respectively, into Eqn. (40) we also get the coordinates of the intersecting point, but much algebra would be needed to achieve the same results.
Plots of A against A* are easy to construct, especially with the aid of a spreadsheet. It is a simple matter to evaluate A1 and A1* from such a plot; the extended tangents or limiting slopes of straight lines should intersect at the point (A1*, A1). From an experimental point of view the conditions more favourable for obtain A-pH data is spectrophotometric titration, but fairly precise results can be obtained and good accuracy can be achieved obtaining a number of data closely spaced. However, arithmetic calculation in this method is reduced at a minimum, which undoubtedly constitutes an attractive feature with purposes of teaching in the undergraduate analytical laboratory if comparing with other graphical or numerical methods of evaluation.
Nevertheless, although it is true that at the pH values corresponding to the absorbances A* and A** we have (ΔpKa>2)
(45)
there seems little point in measuring the whole absorbance versus pH graphs merely to determine three points. So, the constants obtained are little efficient in terms of return for effort used [41]. Another way, which is more complicated but which uses the data more efficiently and provides a much more reliable value A1 and A1* is described in the following. An orthogonal regression method should be applied to A versus A* data because the two axes are affected by errors of similar magnitude.

4. Orthogonal Regression

We can apply a least squares method to the experimental data (A*, A), but single linear regression is not strictly applicable to fitting the best straight line through data points because both variables A and A* contain analogous random error of measurement [42-45].
The perpendicular distance from the point (xi, yi) to the line whose algebraic representation is
(46)
is given by
(47)
We will minimize the sum of the squares of the distance perpendicular to the least squares line
(48)
Note that there is only to unknown quantities in Q: a0 and a1. If Q is to be a minimum the first partial derivatives of Q with respect to a0 and a1 must be zero. Then
(49)
and
On the other hand by combing Eqns. (48) and (50b) we have
(51)
where SXX, SYY are sums of squares about the mean for two variables (x and y), and SXY is the corresponding sum of cross-products
(52)
(53)
(54)
and thus
(55)
(56)
(57)
(58)
The meaningful solution of the quadratic Eqn. (57) gives the value of a1. The sign of a1 is the same as the sign of SXY. Once the value of a1 is known, the value of a0 is calculated from Eqn. (50b). The (A1*, A1) point is defined by the intersection of the extrapolated linear portion of the two branches obtained (by the least squares method above described) plotting A against A*, y=a0+a1x and y = b0+b1x, and then we have
(59)
In those cases in which measurement errors affect both axes in an unequal way, Boccio et al. [46], and McCartin [47, 48] should be consulted, in addition to the references cited at the beginning of this section. Once the limit absorbance, A1, of the intermediate specie HR, is known the acidity constants can be evaluated as follows.

5. Spectrophotometric Evaluation of Acidity Constants

From Eqn. (15) we get
(60)
which on rearrangement gives
(61)
A plot of the left hand against [H] (A-A2)/(A-A1) gives a straight line of slope 1/(Ka2Ka1) and intercept 1/Ka2 from which
(62)
(63)

6. Error Analysis

All analytical measurements are random variables and the information they provide is subject to uncertainty. Changes of interest are usually based on a set of observations and we want to know if the mean and variance of these functions are related to the mean, variance and covariance of the original measurements. The relationship for calculating the variance 
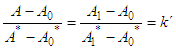
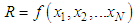
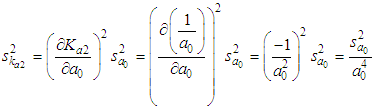
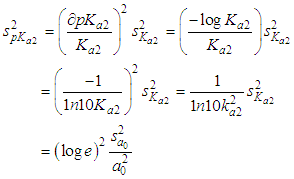
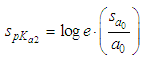
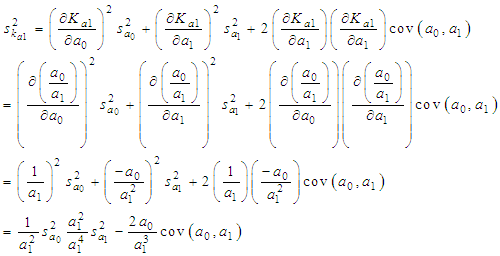
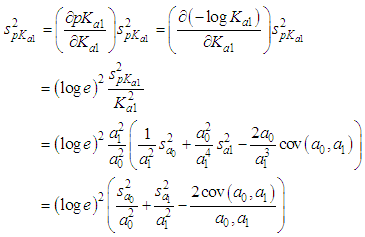
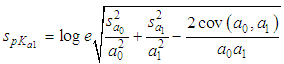
of a continuous arbitrary function of multiple variables, x1, x2 ... xN, which are normally distributed with variances 
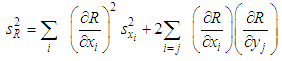
, is known as the law of random error propagation [49, 50], which is expressed as
(64)
(65)
The law of error propagation applied to the function R = f (a0, a1) leads to
(66)
sa02, sa12, and cov(a0, a1), are the variance of the intercept, the variance of the slope and the covariance between the intercept and the slope of the regression line using the conventional least squares method in this case
(67)
(68)
(69)
(70)
(71)
where sy/x2 is the variance of the regression line, given by
(72)
Note that the sy/x value can be easily get using linear regression (method of the least squares), in EXCEL, with the function LINEST (but no the covariance between the intercept and the slope).
Since Ka2 is a function of the intercept
(73)
the variance of Ka2 is equal to
(74)
and as pKa2, is a function of Ka2
(75)
we can calculate the variance of pKa2 as
(76)
and its standard deviation as
(77)
The first acidity constant is function of the intercept and the slope, so the corresponding expressions are more complicated
(78)
Thus applying the law of random error propagation
(79)
and then, the variance of pKa1 is equal to
(80)
and as pKa1, is a function of Ka1, we can calculate the variance of pKa1 as
(81)
the covariance of measurements can be as important as the variances and both contribute significantly to the total analytical error [51, 52].

7. Evaluation of Acidity Constants in Experimental System: Resorcinol

Resorcinol or 1,3-benzenediol is used in the determination of ascorbic acid in pharmaceuticals and in the synthesis of several organic compounds [53]. However, there are few studies dealing with the molecular structure [54] or the acid–base properties of this compound in solution [10]. Considering that knowledge of the acid dissociation constants (pKa) becomes essential for the development of new compounds with biological activity [55, 56], in this paper we determine the overlapping pKa values of resorcinol in water.
In this section, we apply the developed theory to the experimental A-pH data (see Table 2) described in the literature for resorcinol published by Blanco et al. [57]. The A-pH curves corresponding to a resorcinol at 368.3 and 293.5 nm are plotted in Figure 3.
Table 2. A-pH data for the resorcinol system published by Blanco et al. [57]
     
Figure 3. A-pH data at 268.3 and 193.5 nm, I=0.1, T=25°C, CR=4.76·10-4 M for the resorcinol system
Figure 4 shows the application of the Polster method. The orthogonal regression leads to A1 values of [0.5353; 0.8271]. After the application of Eqn. (61) the pKa values were obtained from the slope 1/(Ka2Ka1) and the intercept 1/Ka2. The best value of the limit absorbance for the intermediate specie HR (A1) was obtained by a trial and error method, i.e. the best value of A1 is taken as that which minimizes the standard deviation of the corresponding regression line. The value assumed for A1 was 0.814 (Figure 6).
Figure 4. Evaluation of the limit absorbance of the intermediate specie, HR
Figure 5. Evaluation of the acidity constants of resorcinol by Eqn. 61
Figure 6. s(y/x) as a function of the A1 value assumed
The pKa values obtained are: pKa1 = 9.251 ± 0.066 and pKa2 = 10.879 ± 0.014. These values are of the same order of magnitude as those published in the original work of Blanco et al. [57], or those described in the literature for resorcinol. Values of estimated pKa are reported with three digits in all cases, even if they are not significant. In addition, the experimental data considered are of high quality as can be seen from the low standard deviation of the regression lines.

8. Conclusions

It can finally be argued that a diprotic acid with overlapping (simultaneous equilibria) acidity constants may be treated as a monoprotic acid provided that some approximation is made. The simplifying assumption is that the concentrations of the species R or H2R are small compared with the total concentration CR at enough low and pH values, respectively. Such approximations are often necessary to have an accurate knowledge of the composition of the solution at a certain pH interval.
A new method reported by Polster and based on the measurements of absorbances at two wavelengths (λ and λ*) allows to evaluate graphically the limit absorbances A1 and A1* for the intermediate species HR of a diprotic acid H2R, dealing with overlapping (simultaneous) equilibria. Least squares treatment, which takes into account similar errors in both x and y variables, i.e. orthogonal regression, is also included in this work. Few attempts to deal with this problem in the evaluation of equilibrium constants have been made.
Except for very close pKa values the acidity constants are easily experimentally obtained making use of expressions A(pKa1)=(A2+A1)/2 and A(pKa2)=(A1+A0)/2. However, there seems little point in measuring a whole A-pH curve to determine one point. The constants so obtained are much less efficient in terms of return for effort used.
The theory developed in this work has been successfully applied to the experimental systems described in the bibliography (resorcinol, with ΔpKa of about 1.7). A detailed analysis of the errors implied is also made, taking into account the strong correlation existing between the slope and intercept of a straight line obtained by the least squares method. The covariance between two variables is so important as the variances and both contribute significantly to the total analytical error.

ACKNOWLEDGEMENTS

Thanks are due to the University of Seville for the concession of a Grant destined to the publication of the Bachelor´s degree Final Projects of students.

References

[1]  Avdeef, A., 2012, pKa determination. In Absorption and Drug Development: Solubility, Permeability and Charge State. 2nd ed., Hoboken, NJ: Wiley, Chapter 3, pp. 129.
[2]  Avdeef, A., Testa, B., 2002, Physicochemical profiling in drug research; a brief survey of the state-of-the-art of experimental techniques. Cellular and Molecular Life Science, 59, 1681-1689.
[3]  Babic, S., Horvat, M. J. A., Pavlovic, M. D., Macan, K. M., 2007, Determination of pKa values of active pharmaceutical ingredients., Trends in Analytical Chemistry, 26 (11), 1043-1060.
[4]  Balogh, T. G., Tarcsay, A., Kescru, M. G., 2012, Comparative evaluation of pKa prediction tools on a drug discovery data set., Journal of Pharmaceutical and Biomedical Analysis, 67-68, 63-70.
[5]  Kerns, H. E., 2011, High throughput physicochemical profiling for drug discovery. Journal of Pharmaceutical Sciences, vol. 90 (11), 1838-1858.
[6]  Manallack, T. D., Prankecd, J. R., Yuriev, E., Opreale, I. T., Chalmersa, K. D., 2013, The significance of acid/base properties in drug discovery., Chemical Society Reviews, 42 (2), 485-496.
[7]  Nakashima, S., Yamamoto, K., Arai, Y. Ideda, Y., 2013, Impact of physicochemical profiling for rational approach on drug discovery., Chemical and Pharmaceutical Bulletin, 61 (12), 1229-1230.
[8]  Prankera, J. R., 2007, Critical Compilation of pKa values for Pharmaceutical Substances., Amsterdam: Elsevier.
[9]  Tietgen, H., Walden, M., 2013, Physicochemical Properties. In Drug Discovery and Evaluation: Safety and Pharmacokinetic Assays. 2nd ed., New York: Springer, pp. 1125-1138.
[10]  Asuero, A. G., 1989, A bilogarithmic method for the evaluation of acidity constants of amphoteric substances from solubility measurements. International Journal of Pharmaceutics, 52, 129-137.
[11]  Asuero, A. G., 1992, A hyperbolic cosine method for the spectrophotometric evaluation of acidity constants of two-step overlapping equilibria. International Journal of Pharmaceutics, 88, 15-22.
[12]  Pathare, B., Tambe, V., Patil, V. A., 2014, review on various analytical methods used in determination of dissociation constant., International Journal of Pharmacy and Pharmaceutical Sciences, 6 (8), 26-34.
[13]  Reijenga, J., Hoof, V. A., Loon, V. A., Teunisien, B., 2013, Development of methods for the determination of pKa values. Analytical Chemistry Insights, 8, 53-71.
[14]  Sistovaris, N., Hamachi, Y., Kuriki, T., 1991, Multifunctional substances- Determination of pKa-values by various methods. Fresenius Journal of Analytical Chemistry, 340, 345-349.
[15]  Zhou, L., Wang, J., 2008, Physico-chemical characterization in drug discovery. Trends in the Pharmaceutical Industry, 4, 12-18.
[16]  Zevatskii, Y. E., Samoilov, D. V., Mchedlov-Petrosyan, N. O., 2009, Contemporary methods for the experimental determination of dissociation constants of organic acids in solutions., Russian Journal of General Chemistry, 79 (9), 1859-1889.
[17]  Papanastasiou, G., Kokkinidis, G., 2003, Development of iterative methods for the exact determination of acid dissociation constants and specific reaction rates in various ionic or electrochemical systems. A review. Collection of Czechoslovak Chemical Communications, 68 (8), 1345-1378.
[18]  Asuero, A. G., Michalowski, T., 2011, Comprehensive formulation of titration curves for complex acid-base systems and its analytical implications. Critical Reviews in Analytical Chemistry, 41 (2), 151-187.
[19]  Alongi, K. S., Shields, G. C., 2010, Annual Reports in Computational Chemistry, Chapter 8 – Theoretical calculations of acid-dissociation constants: a review article, pp. 133-138.
[20]  Martell, A. E., 1992, Determination and Uses of Stability Constants. New York: Wiley.
[21]  Martell, A. E., Hancock, R. D., 1996, Metal Complexes in Aqueous Solution. New York: Springer.
[22]  Asuero, A. G., Herrador, M. A., Camean, A. M., 1986, Spectrophotometric evaluation of acidity constants of diprotic acids: errors envolved as a consequence o an erroneous choice of the limit absorbance. Analytical Letters, 19 (19-20), 1867-1880.
[23]  Asuero, A. G., Jimenez-Trillo, J. L., Navas, M. J., 1986, Spectrophotometric methods for the evaluation of acidity constants—I. Numerical methods for single equilibria. Talanta, 33 (6), 531-535.
[24]  Asuero, A. G., Jimenez-Trillo, J. L., Navas, M. J., 1986, Mathematical treatment of absorbance versus pH graphs of polybasic acids. Talanta, 33 (11), 929-934.
[25]  Palalikit, D., Block, J. H., 1980, Determination of ionization constants by chromatography. Analytical Chemistry, 52 (4), 624-30.
[26]  Budesinsky, B. W., 1969, Acidity of several chromotropic acid azo derivatives. Talanta, 16 (9), 1277-1288.
[27]  Asuero, A. G., Recamales, M. A., 1993, A bilogarithmic method for the spectrophotometric evaluation evaluation of acidity constants of two-step overlapping equilibria. Analytical Letters, 26 (1), 163-181.
[28]  Asuero, A. G., 2009, A Hiperbolic Sine Procedure for the Spectrophotometric Evaluation of Acidity Constants for Two-Step Overlapping Equilibria. Journal of Analytical Chemistry, 64 (10), 1026-1030.
[29]  Asuero, A. G., Navas, M. J., Jimenez-Trillo, J. L., Spectrophotometric methods for the evaluation of acidity constants-II: Numerical methods for two-step overlapping equilibria., Talanta, 33 (6), 195.
[30]  Meites, L., 1981, An Introduction to Chemical Equilibrium and Kinetics. Oxford: Pergamon Press.
[31]  Asuero, A. G., Herrador, M. A., Jimenez, A. M., 1986, A Three Equation Method for the Numerical Evaluation of Acidity Constants of Single Equilibria from Spectrophotometric Data., Analytical Letters, 19 (7-8), 837-843.
[32]  Matsumoto, P. S., Ring, J., Zhu, J. L., 2008, The use of limits in an advance placement chemistry course. Journal of Chemical Education, 84 (10), 1655-1658.
[33]  Missen, R. W., 1977, Applications of the L’Hôpital-Bernoulli rule in chemical systems. Journal of Chemical Education, 54 (8), 488-490.
[34]  Herrador, M. A., Jimenez, A. M., Asuero, A. G., 1987, Spectrophotometric evaluation of acidity constants of methylglyoxal bis(4-phenyl-3-thiosemicarbazone)., Acta Pharmaceutica Technologica, 33(2), 74-90.
[35]  Polster, J., 2006, Chromatography, Titration, and Reaction Kinetics: UV-VIS Spectroscopic Evaluation on the Basis of the Mauser Diagrams, Research Signpost. Kerala, India: Trivandrum.
[36]  Polster, J., 1995, Reaktionskinetische Auswertung spektroskopischer Medβdaten. Eine Einführung in die kinetische Analyse chemischer und photochemischer Reaktionen. Wiesbaden: Vieweg.
[37]  Polster, J., Lachmann, H., 1989, Spectrometric Titrations. Analysis of Chemical Equilibria. Weinheim: VCH.
[38]  Polster, J., 1982, Spektrometrische Titration. Teil II. GIT Labor-Fachzeitschrift 26 (6), 581-592.
[39]  Polster, J., 1975, Über eine allgemeine graphische Methode zur Analyse von mehrstufigen spektrophotometrischen Titrationsgleichgewichten. Analysis of multistep spectrophotometric titration equilibria by means of a general graphical method. Zeitschrift für Physikalische Chemie Neue Folge, 97, S55-68.
[40]  Coleman, J. S., Varga, L. P., Mastin, H. S., 1970, Graphical methods for determining the number of species in solution from spectrophotometric data. Inorganic Chemistry, 9, 1015.
[41]  Rossotti, H., 1978, The Study of Ionic Equilibria. An Introduction. London: Longman.
[42]  Linnet, K., 1998, Performance of Deming regression techniques analysis in case of misspecified analytical error ratio in method comparison studies., Clinical Chemistry, 44 (5), 1024-1031.
[43]  Linnet, K., 1993, Evaluation of regression procedures for method comparison studies. Clinical Chemistry, 39 (3), 424-432.
[44]  Ripley, B. D., Thompson, M., 1987, Regression techniques for the detection of analytical bias. Analyst, 112, 377-383.
[45]  Thompson, M., 1982, Regression methods in the comparison of accuracy. Analyst, 107, 1169-1180.
[46]  Boccio, M., Sayago, A., Asuero, A. G., 2006, A bilogarithmic method for the spectrophotometric evaluation of stability constants of 1:1 weak complexes from the mole ratio data., International Journal of Pharmaceutics, vol. 318, 70-77.
[47]  McCartin, B. J., 2010, Oblique linear least squares approximation. Applied Mathematical Sciences, 58 (4), 2891-2904.
[48]  McCartin, B. J., 2003, A geometric characterization of linear regression. Statistics, 37 (2), 101-117.
[49]  Asuero, A. G., Gonzalez, G., de Pablos, F., Ariza, J. L., 1988, Determination of the optimum working range in spectrophotometric procedures., Talanta, 35 (7), 531-537,
[50]  Martín, J., Padilla Mairena, J., Asuero, A. G., 2016, On the Evaluation of Autoprotolysis Constans of Amphiprotic and Inert Solvents from Electrochemical Measurements: Consideration of Liquid Junction Potentials when Necessary. Current Topics in Analytical Chemistry, 10, 43-71.
[51]  Bayne, C. K., Rubin, I. B., 1986, Practical Experimental Designs and Optimization Methods for Chemists. Deerfield Beach, FL: VCH.
[52]  Kowalski, B. R., 1980, Chemometrics., Analytical Chemistry, 52 (5), 112R-122R.
[53]  Tripathi, A. K. Khan, K. R. Taneja, S. C., 2003, Reaction of Resorcinol with Mesityl Oxide: Synthesis of 2,2-Dimethyl-4-formyl- 7-methoxy-(2 H)-1-benzopyran., Synthetic Communications 33,
579–585.
[54]  Bouchoux, G. Defaye, D. McMahon, T. Likholyot, A. Mo, O. Yañez, M., 2002, 
 Structural and Energetic Aspects of the Protonation of Phenol, Catechol, Resorcinol, and Hydroquinone. Chemistry. A European Journal, 8, 2900–2909.
[55]  Cartensen, J. T. Rhodes, C.T. Drug Stability, 3rd ed., Marcel Dekker, 
1999, pp. 145–189, 209–260.
[56]  Wells, J. I. Pharmaceutical Preformulation: The Physicochemical 
Properties of Drug Substances, Ellis Harwood, England, 1990, pp. 15, 
80.
[57]  Blanco, S. E., Almandoz, M. C., Ferretti, F. H., 2005, Determination of the overlapping pKa values of resorcinol using UV-visible spectroscopy and DFT methods. Spectrochimica Acta A, 61, 93-102.