Julia Martín1, Irene Abengózar Suárez2, Agustín G. Asuero2
1Department of Analytical Chemistry, Escuela Politécnica Superior, University of Seville, Seville, Spain
2Department of Analytical Chemistry, Faculty of Chemistry, University of Seville, Seville, Spain
Correspondence to: Julia Martín, Department of Analytical Chemistry, Escuela Politécnica Superior, University of Seville, Seville, Spain.
| Email: |  |
Copyright © 2018 The Author(s). Published by Scientific & Academic Publishing.
This work is licensed under the Creative Commons Attribution International License (CC BY).
http://creativecommons.org/licenses/by/4.0/

Abstract
The aim of this work is to find out in which experimental conditions a diprotic acid H2R may be treated as a monoprotic one, HR, in order to determining their acidity constants spectrophotometrically, as the relationship between the absorbance (A) and the concentration for a monoprotic acid HR is susceptible of linear transformation. It can be argued that a diprotic acid with overlapping acidity constants may be treated as a monoprotic acid provided that some approximation is made. The simplifying assumption is that the concentration (CR) at enough low and high pH values equals to [H2R] + [HR] and [HR] + [R], respectively. A bilogarithmic method for the spectrophotometric evaluation of acidity constants of two-step overlapping equilibria may be applied on this basis. The singular straight line (bilogarithmic) complete (diprotic acid model) or single (monoprotic acid model) version requires for its application the knowledge of the limit absorbance of the intermediate specie HR (A1). A trial and error method may be applied, i.e. the best value of A1 is taken as that which minimizes the standard deviation of the corresponding regression line. An additional bilogarithmic method is proposed in this work when spectrophotometric measurements are made at the wavelength of an isosbestic point (i.e. a wavelength at which the limit absorbance of two species are equal). The method has been checked with synthetic theoretical data and model systems, and has been applied to the experimental data obtained in the literature for benzidine, vanillyl ammonium ion and isoniconitic acid, and to the A-pH experimental data for isoniconitic acid obtained in this paper.
Keywords:
Acidity constant, Spectrophotometric measurements, Bilogarithmic Method, Isosbestic point
Cite this paper: Julia Martín, Irene Abengózar Suárez, Agustín G. Asuero, On the Existence of Two Species in Solution, Simple or Simultaneous Equilibria?, Journal of Laboratory Chemical Education, Vol. 6 No. 4, 2018, pp. 99-106. doi: 10.5923/j.jlce.20180604.04.
1. Introduction
The relationship between the absorbance (A) and the composition of any given solution of a diprotic acid having concentration CR and mixed acidity constants 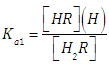 | (1) |
and | (2) |
corresponding to the dissociation equilibria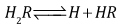 | (3) |
where the charges are omitted for the sake of simplicity,and 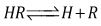 | (4) |
respectively, is given by [1, 2]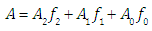 | (5) |
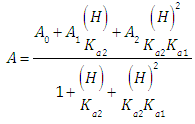 | (6) |
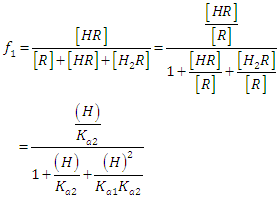
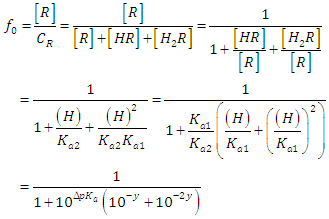
where A0, A1 and A2 are the limit absorbance of R, HR and H2R species, respectively, and f2, f1 and f0 the molar fractions  | (7) |
 | (8) |
 | (9) |
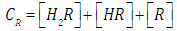
(path length one-centimetre); εj is the molar absorptivity of the species HjR, and CR the analytical (total) concentration of the acid.At low pH values one would expect the formation of H2R and HR only and in consequence Eqn. (6) is reduced to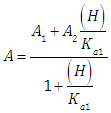 | (10) |
At high enough pH only the species HR and R are found in solution from a practical point of view, and from Eqn. (6) we have instead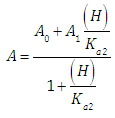 | (11) |
Expressions (10) and (11) have the general form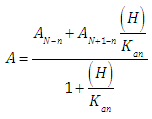 | (12) |
corresponding to the single equilibria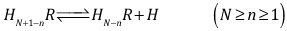 | (13) |
and then we may evaluate the acidity constants Kan as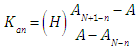 | (14) |
by measuring absorbances at a given wavelength and pH, once the values of AN+1-n and AN-n are known. Taking decadic logarithms on Eqn. (14) and rearranging terms we get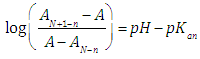 | (15) |
By plotting the left hand of Eqn. (15) against pH we get a straight line (least squares method) with slope unity which cuts the x-axis at pH=pKa. Eqns. (12) or (14) may also be arranged into several forms [3] suitable for linear plotting. The aim of this work is to find out in which experimental conditions a diprotic acid H2R may be treated as a monoprotic one, HR, in order to determining their acidity constants spectrophotometrically. A bilogarithmic method for the spectrophotometric evaluation of acidity constants of two-step overlapping equilibria has been devised on this basis. The method has been checked with synthetic theoretical data. Finally, another non-approximate bilogarithmic isosbestic point method has been devised and applied to A-pH (literature) data for benzidine, vanillyl ammonium ion and isonicotinic acid, being also the A-pH data obtained in this work for isonicotinic acid the subject of study and application.
2. Spectrophotometric Evaluation of Acidity Constants of Diprotic Acids by Monoprotic Acid Methods
From Eqn. (6) we get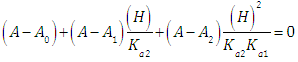 | (16) |
which may be rearranged into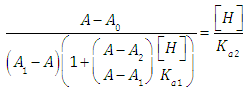 | (17) |
Taking decadic logarithms on Eqn. (17) we get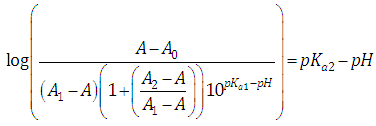 | (18) |
which has the form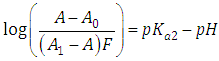 | (19) |
where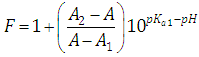 | (20) |
A representation of the left hand of Eqn. (18) against the pH gives a straight line (least squares method) of slope -1 which cut the x-axis at a value equals to pKa2.Similarly, Eqn. (16) on rearrangement gives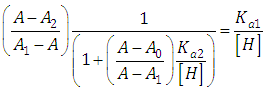 | (21) |
Taking decadic logarithms on Eqn. (21) we get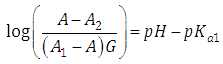 | (22) |
where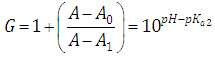 | (23) |
A representation of the left hand of Eqn. (22) against the pH gives a straight line (least squares method) of slope 1 which cut the x-axis at a value equals to pKa1.At high enough pH values it is expected that only the two RH and R species will be present in solution; so, from a practical point of view, since 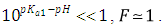 The equilibrium given by Eqn. (4) is thus obtained, and Eqn. (19) becomes
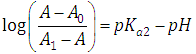 | (24) |
At low enough pH values it is expected that only the two H2R and HR species will be present in solution; so, from a practical point of view, since 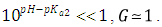 The equilibrium given by Eqn. (3) is thus obtained, and Eqn. (22) becomes
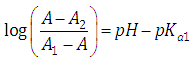 | (25) |
Both expressions, Eqns. (24) and (25) have the form of Eqn. (14) and are applicable when the limit absorbance of the intermediate specie A1 is known, which can be systematically varied up to minimize a given parameter, such as the standard deviation of the regression line, for example.
3. Spectrophotometric Evaluation of Acidity Constants of Diprotic Acids from Absorbance Measurements at the Isosbestic Point Wavelength
If measurements are made at the wavelength in which A1 = A0 = Ai, then from Eqn. (16) we get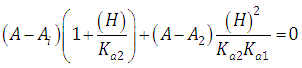 | (26) |
which on rearrangement gives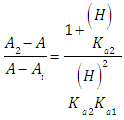 | (27) |
Taking into account that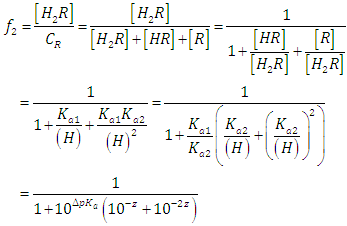 | (28) |
where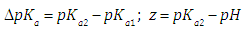 | (29) |
 | (30) |
 | (31) |
being in this case | (32) |
we get | (33) |
Then, from Eqns. (33) and (28), after taking decadic logarithms we get 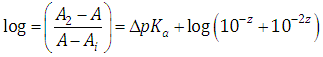 | (34) |
A representation of the left hand of Eqn. (34) against the second term of the right hand gives a straight line (least squares method) of slope unity which cut the x-axis at a value equals to ΔpKa. Moreover, from Eqn. (33) we get | (35) |
The same considerations can be applied supposing that the measurements are realized at the wavelength of the isosbestic point in which A1=A2=Aj, in order to evaluate pKa2. Then, 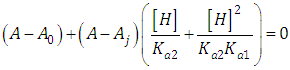 | (36) |
which on rearrangement gives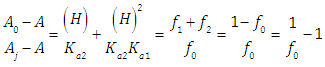 | (37) |
Taking reciprocals in Eqn. (31), subtracting 1, and then taking decimal logarithms of both sides we get an expression analogous to Eqn. (34)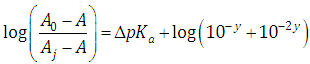 | (38) |
As before, a representation of the left hand of Eqn. (38) against the second term of the right hand gives a straight line with unity slope and intercept equals to ΔpKa.From Eqn. (37) we get | (39) |
It can finally be argued that a diprotic acid with overlapping acidity constants may be treated as a monoprotic acid provided that some approximation is made. The simplifying assumption is that the concentration CR at low enough and high pH values equals to [H2R] + [HR] and [HR] + [R], respectively.
4. A-pH Curves of Diprotic Acids: Simulated Data
Simulated data have been generated using Eqn. (6). Figure 1 shows the A-pH curves, corresponding to a family of diprotic acids with pKa2 equal to 8.000, and pKa1 variable (from 5.500 to 7.600). The ΔpKa studied are: 0.250; 0.200; 0.150; 0.100 and 0.600. This last value is the smallest ΔpKa difference that a diprotic acid can exhibit, as it is deduced from the analysis of their microconstants of acidity [4].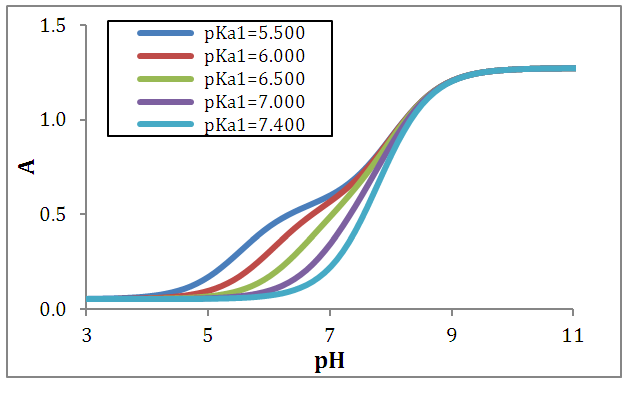 | Figure 1. A-pH curves for a diprotic acid H2R with pKa2 = 8.000 and variable pKa1 (indicated in the legend in each case) |
When the two pKa’s are far away, the two ionization equilibria can be treated independently. If the successive acidity constants are close (ΔpKa<4.000) a simultaneous adjustment of the data is necessary [5]. Figure 2 shows the singular straight line (bilogarithmic) complete (diprotic acid model (RU), Eqn. 19) or single (monoprotic acid model, Eqn. 24) version applied to the calculation of pKa2 (assuming known pKa1 and the limit absorbance for the intermediate specie, A1). Regardless of the wavelength measurement, which leads to different values for the limit absorbance A2, A1 and A0 of the species, H2R, RH and R, respectively, a straight line with slope equal to -1 is obtained. Theoretically, this same line is also obtained in spite of the ΔpKa value.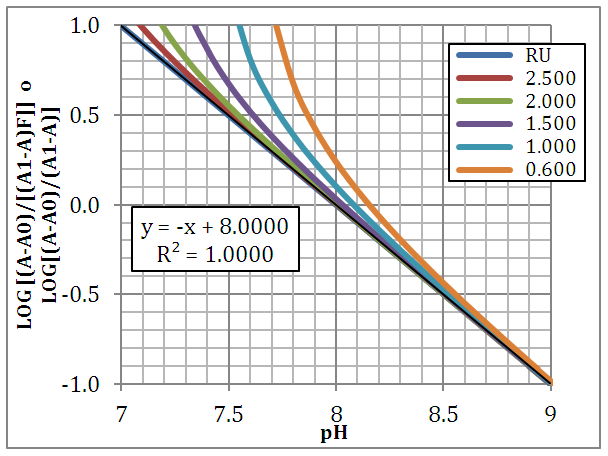 | Figure 2. The singular straight line (bilogarithmic) complete (diprotic acid model (RU), Eqn. 19) or single (monoprotic acid model, Eqn. 24) version applied to the family of curves of Figure 1 (assuming known pKa1 and the limit absorbance for the intermediate specie, A1) |
When the diprotic acid is treated as monoprotic one (Eqn. 24) an accentuated curvature is observed at lower ΔpKa values due to the occurrence of the H2R specie involved in the first dissociation equilibrium of the acid.A graph analogous to Fig. 2, with slope +1.000, is obtained when calculated pKa1 from Eqn. (22) assuming pKa2 and A1 known (see Fig. 3). The cut-off point of the straight line with the x-axis is equal to the pKa1 value of in each case. If the acid were considered as monoprotic one (Eqn. 25), it would get lines whose curvature is more accentuated when the pH increases and ΔpKa decreases, due to the occurrence of the R specie involved in the second dissociation equilibrium of the acid.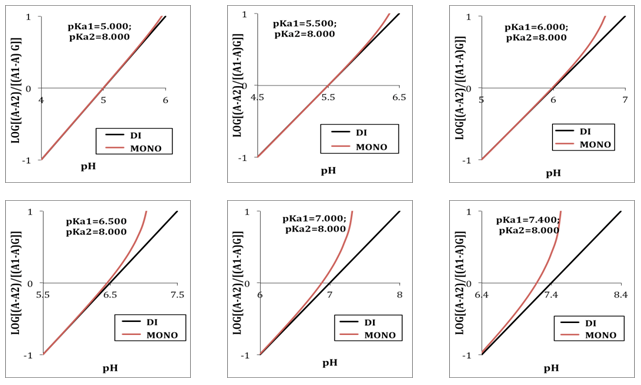 | Figure 3. The singular straight line (bilogarithmic) complete (diprotic acid model (RU), Eqn. 22) or single (monoprotic acid model, Eqn. 25) version applied to the family of curves of Figure 1 (assuming known pKa2 and the limit absorbance for the intermediate specie, A1) |
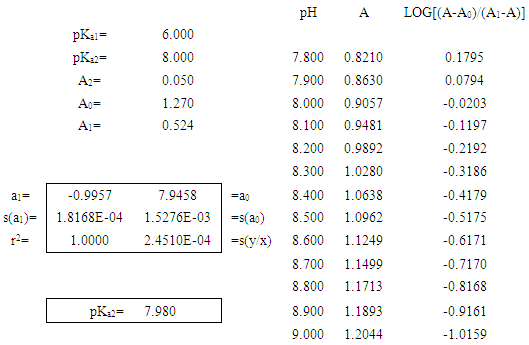
Note that A2 and A0 can be obtained at enough acid and basic pH values, respectively. However, the singular straight line (bilogarithmic) complete (diprotic acid model) or single (monoprotic acid model) version requires for its application the knowledge of the limit absorbance of the intermediate specie HR (A1). To do that, a trial and error method may be applied. For example the best value of A1 is taken as that which minimizes the standard deviation of the corresponding regression line. The pKa2 value is obtained from | (40) |
The LINEST function in EXCEL [6] is very useful on this respect. We select for study the system shown in Table 1, absorbances theoretically generated from known pH values by applying Eqn. 6 (rounded to four digits). In order to evaluate pKa2 by means of Eqn. (24), the pH values were selected in the range [7.800-9.000; N=13] when only the two species HR and R are practically present in solution. The value of the fit parameter assumed is not critical, variations between 0.520 and 0.560 for A1 lead to pKa2 values of 7.975 and 8.023, respectively. A pKa2 = 7.980 is found (Table 1) using A1 = 0.524. Figure 4 shows the minimization process. Another possibility of trial and error method would be taking as A1 that whose slope is closest to the unit. In this latter case, the optimal value of A1 is 0.531 and pKa2=7.988, in line with the previously obtained. The slight difference from the pKa2 = 8.000 value comes from the fact that the single method is approximate.Table 1. Evaluation of the pKa2 of a diprotic acid H2R as monoprotic one
 |
| |
|
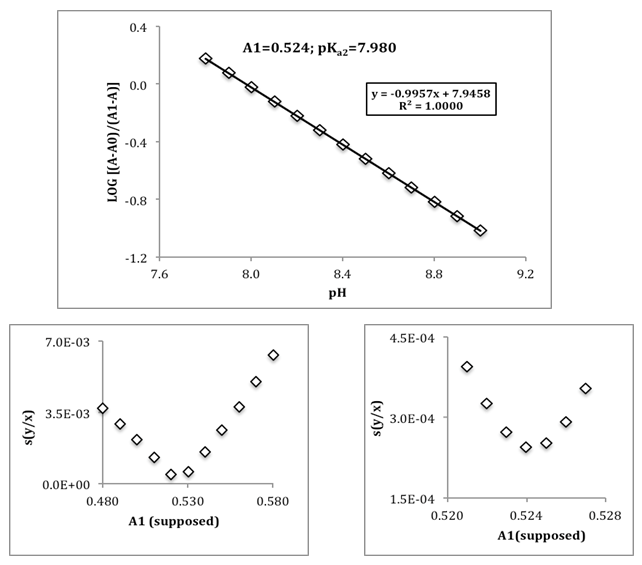 | Figure 4. Evaluation of the pKa2 of a diprotic acid H2R as monoprotic one |
In a same way, we proceed to calculate pKa1 according to Eqn. (25) selecting the pH range [5.000 – 6.200; N=13] in this case obtaining analogous good results. Then, a diprotic acid can be treated as monoprotic one without a considerable sacrifice in accuracy.
5. Determination of the Acidity Constants of Diprotic Acids from Absorbance Measurements at the Isosbestic Point Wavelength: Theoretical Model Systems
5.1. Benzidine
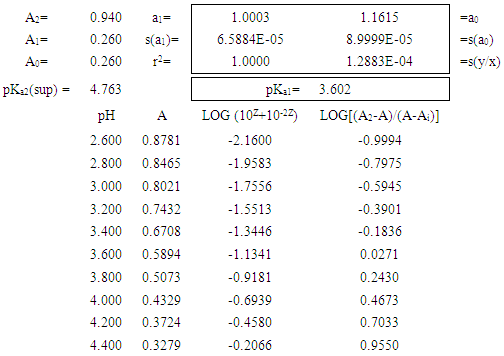
Theoretical [A, pH] data (Eqn. 6) are generated (A rounded to four digits) for the model system benzidine, R, a diacid base with parameter values: pKa1=3.602; pKa2=4.761; A2=0.940; A1=A0=0.260 (isosbestic point). The application of the complete bilogarithmic method (Eqn. (19)) to the theoretical data generated over the entire range of pH values leads to the exact value of the second dissociation constant, pKa2=4.761, assuming a correct value of pKa1 equal to 3.602 (straight line with slope -1.000). In the same way, the application of the complete bilogarithmic method based on the use of Eqn. (22) leads to the exact value of the first dissociation constant, pKa1=3.602, assuming known the correct value of pKa2=4.761 (straight line with slope 1.000).Additionally, in order to apply the isobestic point bilogarithmic method (Eqn. 34), ten pairs of data [A, pH] were selected in the range of pH from 2.600 to 4.400 (near to pKa1), from 0.200 to 0.200 units of pH. The minimization criterion leads to a pKa2 value of 4.763. The bilogarithmic method at the isosbestic point wavelength leads to a pKa1 value equal to 3.602. So, it can be concluded that the results obtained are excellent. The value of the selected adjustment parameter is not especially critical on the pKa1 calculation, i.e., assuming pKa2 values of 4.700 and 4.800 lead to pKa1 values equal to 3.619 and 3.592, respectively. If we adopt as the best value of the adjustment parameter those straight line with slope closest to the unit, we get pKa2=4.761 and pKa1=3.602, coinciding in both cases with the true values.
5.2. Vanillyl Ammonium Ion and Isonicotinic Acid
Analogous good results are obtained with vanyllil ammonium ion system (pKa1=9.032; pKa2=10.460; A2=0.024; A1=A0=0.787) and to isonicotinic acid system (pKa1=1.820; pKa2=4.760; A2=A1=0.702; A0=0.407).
6. Determination of the Acidity Constants of Diprotic Acids from Absorbance Measurements at the Isosbestic Point Wavelength: Experimental Systems
Table 2. Benzidine model system: pKa1 evaluation using the bilogarithmic method at the isosbestic point, A1=A0
 |
| |
|
6.1. Experimental Systems Described in the Literature
The bilogarithmic method has been applied to the literature data for benzidine [7], vanillyl ammonium ion [8], and isonicotinic acid [9]. Results obtained for benzidine are shown in Fig. 5. The pKa values obtained were: Benzidine: pKa1=3.657 and pKa2=4.455, ΔpKa=0.798; Vanillyl ammonium ion: pKa1=9.044 and pKa2=10.657, ΔpKa=1.613; Isonicotinic acid: pKa1=1.816 and pKa2=4.751, ΔpKa=2.935.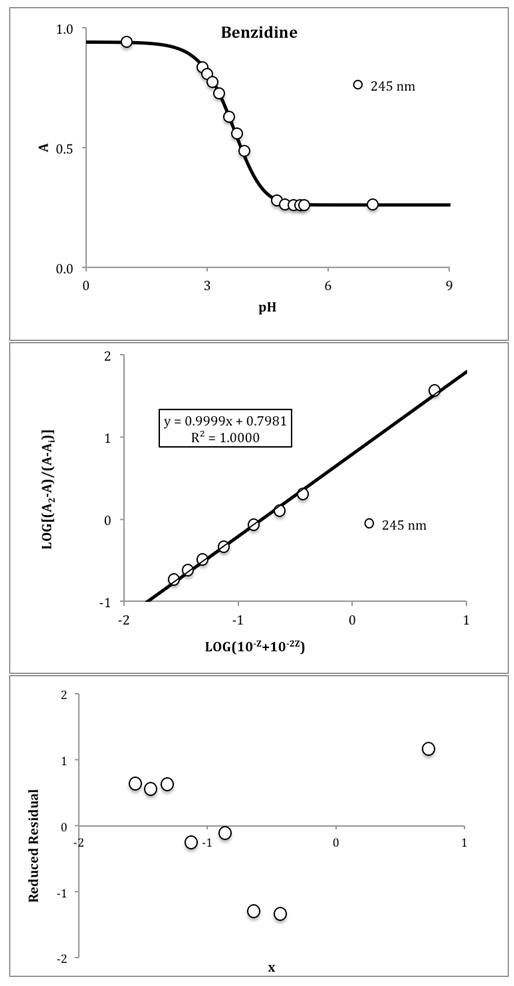 | Figure 5. Benzidine test system. Top: A-pH data at 245 nm, I=0.01, T=25° C, CR=0.5·10-4 M. Middle: pKa evaluation using the bilogarithmic method at the isosbestic point. Bottom: Reduced residuals (residual divided by sy/x) |
These values are of the same order of magnitude as those published in their original papers, and of high quality as can be seen from the low s(y/x) of the regression lines, with the residuals randomly distributed. pKa are reported with three digits in all cases, even if they are not significant.
6.2. Experimental Data: Isonicotinic Acid
ReagentsIsonicotinic acid (C6H5NO2) M = 123.06 g/mol (Sigma, > 99%); Sodium hydroxide (NaOH) M = 40,01g/mol (Merck, analytical grade); Perchloric acid (HClO4) M=100.5 g/mol (Merck, 72%); sodium perchlorate (NaClO4) M=122.5 g/mol (Merck, analytical grade); Water for ACS analysis.InstrumentsAnalytical balance (Metler AE200), Granatario (Metler PJ 400), pH-meter Crison GLP 21 (3 decimals), with a combined Ag/AgCl glass electrode. pH-meter is calibrated using pH buffers 4.01, 7.00 and 9.21 (setting the pH meter to 4,010, 7.000 and 9.210, respectively). Ultraviolet-visible molecular absorption spectrophotometer (Shimadzu).Experimental partTwo point five mL of isonicotinic acid solution (1.750 10-3 M) is pipetted into a 25 mL volumetric flask containing 2.5 mL of a NaClO4 solution (1 M). Then varying amounts of HClO4 and NaOH solutions are added in order to adjust the pH, completing to the mark with distilled water. The absorbance is measured at 266.7 nm (quartz cuvettes, pathlength one-centimetre) versus a blank. Finally the pH of the solution is also measured (passed into a 50 mL beaker).Details of the experimental data (Fig. 6) follows: A2 =A1= 0.7052; A0=0.4028. [pH, A]: [3.337, 0.6906; 3.962, 0.6793; 4.073, 0.6442; 4.149, 0.6222; 4.230, 0.6277; 4.240, 0.5969; 4.281, 0.6036; 4.383, 0.5756; 4.385, 0.6000; 4.392, 0.5894; 4.429, 0.5817; 4.659, 0.5309; 4.772, 0.5424. The dispersion of the data is greater than that obtained by Evans et al. [9].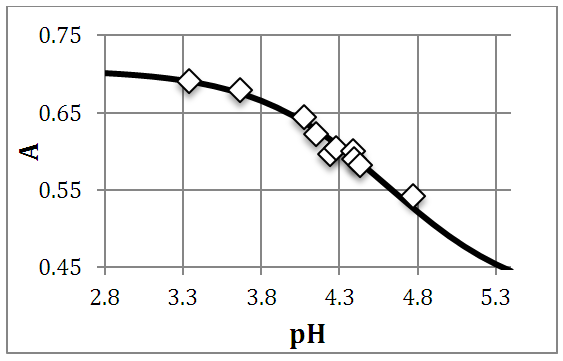 | Figure 6. Isonicotinic acid experimental system. A-pH data at 266.7 nm, I=0.1 M, T=25ºC, CR=1.675•10-4M |
The application of the bilogarithmic method from absorbance measurements at the isosbestic point wavelength (Figure 7, top) leads to pKa1=1.920 and pKa2=4.615, ΔpKa=2.695 ± 0.125, not very distant from those previously published by Evans et al. [9], calculated at a different ionic strength. The results are given with three decimal digits in order to show the precision of measurements achieved even if they are not significant.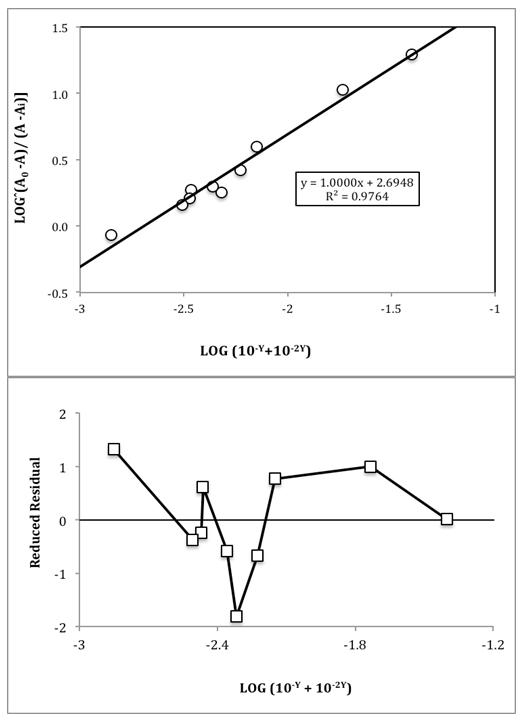 | Figure 7. Top: Isonicotinic acid pKa evaluation by the bilogarithmic method at the isosbestic point. Bottom: Reduced residuals (residual divided by sy/x) versus x |
The residual analysis (Fig. 7, bottom) indicates a random pattern and values of reduced residuals lower to 2, in absolute value, so that no data was eliminated. The non-linear regression method (CSS Statistica) leads to a pKa2 value of 4.611, although the pKa1 value by this method is very sensitive to the initial starting value (i.e. Figure 8).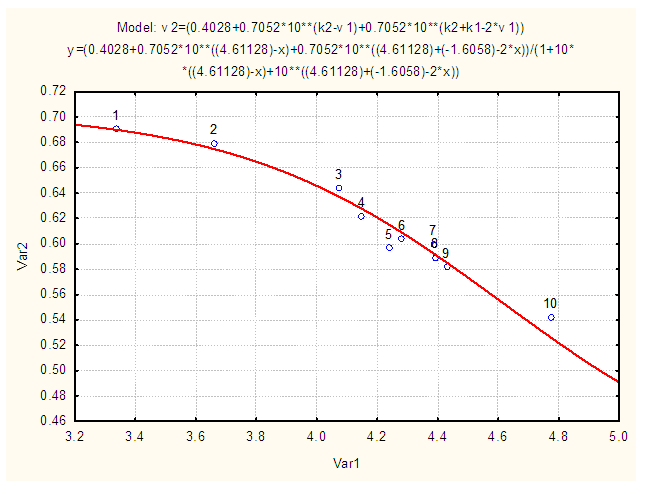 | Figure 8. Non-linear regression method applied to the A-pH data obtained in this work for isonicotinic acid (pKa2=4.611) |
7. Conclusions
Many molecules having analytical and biological interest [10] behave as diprotic acids. The bilogarithmic procedures (complete or simplified versions) and isobestic point bilogarithmic method applied in this work have been tested with synthetic data and model and experimental (benzidine, vanillyl ammonium ion, isonicotinic acid) systems and found to be satisfactory, yielding results of noticeable precision. The efficiency of the procedure relies upon having a reasonable a priori estimate of pKa1 or pKa2. The efficiency of the procedure relies upon having a reasonable a priori estimate of pKa1 or pKa2.In spite of the modern possibility of calculating acidity constants using black-box computer programs, the determination of these constants by linearized plots seems to be more prevalent, probably owing to the transparency of the method used. Proper nonlinear fitting data is often difficult and non-linear least squares are not always free from problems. Occasionally, problems arise because of the choice of the data, initial estimates, convergence or multiple local minima, all typical of nonlinear regression. Therefore, the importance of transformation stems from the various limitations of nonlinear approaches.
ACKNOWLEDGEMENTS
Thanks are due to the University of Seville for the concession of a Grant destined to the publication of the Bachelor´s degree Final Projects of students.
References
| [1] | Asuero, A. G., Jimenez-Trillo, J. L., Navas, M. J., 1986, Mathematical treatment of absorbance versus pH graphs of polybasic acids. Talanta, 33 (11), 929-934. |
| [2] | Asuero, A. G., Jimenez-Trillo, J. L., Navas, M. J., 1986, Spectrophotometric methods for two-step overlapping equilibria, Talanta, 33 (6), 531-535. |
| [3] | Meloun, M., Havel, J., Högfeldt, E., 1988, Computation of Solution Equilibria: a guide to methods in potentiometry, extraction and spectrophotometry. Chichester: Ellis Horwood. |
| [4] | Asuero, A. G., 2007, Buffer capacity of polyprotic acids: first derivative of the buffer capacity and pKa values of single and overlapping equilibria., Critical Reviews in Analytical Chemistry., 37 (4), 269-301. |
| [5] | Asuero, A. G., 2009, Hyperbolic sine procedure for the spectrophotometric evaluation of acidity constants of two-step overlapping equilibria. Journal of Analytical Chemistry, 64 (10), 1026-1030. |
| [6] | Liengme, B. V., 2016, A Guide to Microsoft Excel 2013 for Scientists and Engineers. Amsterdam: Elsevier. |
| [7] | Albert, A., Serjeant, E. P., 1962, Ionization Constants of Acids and Bases. London, United Kingdom: Methuen & Co. Ltd., 2nd ed., London, United Kingdom: Chapman and Hall, 1971, 3th ed., 1984. |
| [8] | Robinson, R. A., Kiang, A. K., 1956, The spectrophotometric determination of the ionization constants of a dibasic acid. Transactions of the Faraday Society, 327-331. |
| [9] | Evans, R. F., Herington, E. F. G., Kynaston, W., 1953, Determination of dissociation constants of the pyridine-monocarboxylic acids by ultra-violet photoelectric spectrophotometry. Transactions of the Faraday Society, 1284-1290. |
| [10] | Avdeef, A., 2012, Absorption and Drug Development: Solubility, Permeability, and Charge State, 2nd ed., New York, USA: Wiley. |

 Abstract
 Reference
 Full-Text PDF
 Full-text HTML