-
Paper Information
- Next Paper
- Previous Paper
- Paper Submission
-
Journal Information
- About This Journal
- Editorial Board
- Current Issue
- Archive
- Author Guidelines
- Contact Us
Journal of Laboratory Chemical Education
p-ISSN: 2331-7450 e-ISSN: 2331-7469
2018; 6(4): 91-98
doi:10.5923/j.jlce.20180604.03

On the Titration of a Weak Acid with a Weak Base: Application to the Potentiometric Determination of the Degree of Acidity of Vinegar
 Abstract
 Reference
 Full-Text PDF
 Full-text HTML
Julia Martín1, Laura Ortega Estévez2, Agustín G. Asuero2
1Department of Analytical Chemistry, Escuela Politécnica Superior, University of Seville, Seville, Spain
2Department of Analytical Chemistry, Faculty of Chemistry, University of Seville, Seville, Spain
Correspondence to: Julia Martín, Department of Analytical Chemistry, Escuela Politécnica Superior, University of Seville, Seville, Spain.
| Email: |  |
Copyright © 2018 The Author(s). Published by Scientific & Academic Publishing.
This work is licensed under the Creative Commons Attribution International License (CC BY).
http://creativecommons.org/licenses/by/4.0/

Although the number of direct instrumental methods of chemical analysis is continuously increased, titrations are still important in routine practice in many laboratories. The aim of this contribution is to carry out the study of weak acid/ weak base titration curves, while also emphasizing titration error. A diagram for the titration error in function of the difference between the end and equivalence point (pHeq) is drawn in order to facilitate the graphical calculation of titration error. The approach to the construction of redox titration curves, based on the use of a hyperbolic sine expression, is applied here to weak acid/ weak base titrations. While the approach in its simplified form is limited by the water ionization, herein we derive a complete expression applicable in all situations when dealing with weak and medium strength acids titrated with weak and medium strength bases. The acetic acid/ammonia system is selected first as example in order to derive the equations, the reaction is studied in detail and applied to the determination of acetic acid (acidity degree) in vinegar.
Keywords: Weak acid/weak base, Titration curves, Titration error, Vinegar acidity, Potentiometric titrations, Gran method
Cite this paper: Julia Martín, Laura Ortega Estévez, Agustín G. Asuero, On the Titration of a Weak Acid with a Weak Base: Application to the Potentiometric Determination of the Degree of Acidity of Vinegar, Journal of Laboratory Chemical Education, Vol. 6 No. 4, 2018, pp. 91-98. doi: 10.5923/j.jlce.20180604.03.
Article Outline
1. Introduction
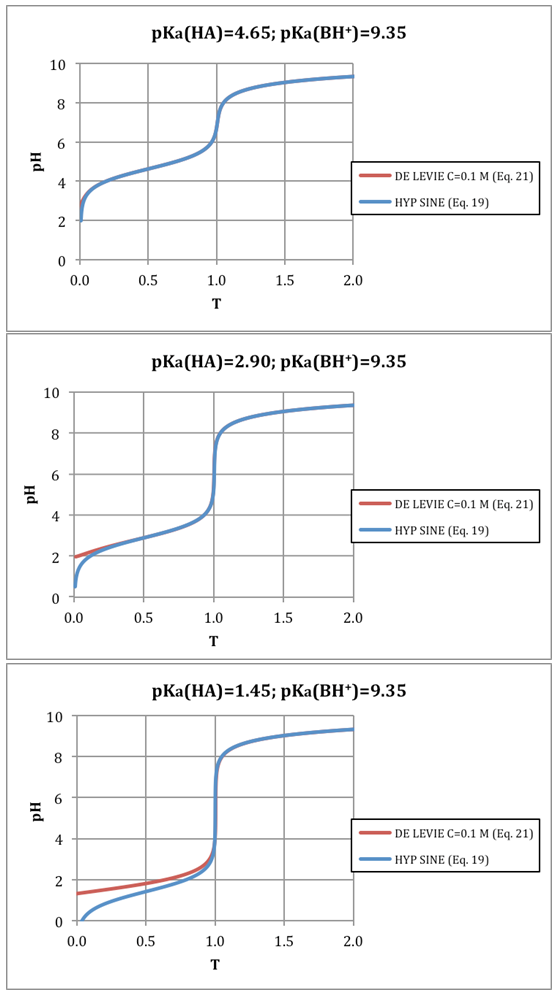
- Titrimetry has been applied since the late 18th century and is one of the oldest known methods [1] of chemical analysis. Based on reaction chemistry, it is still developing [2-4] and it plays an important role in various analytical fields as well as routine studies. Among their main advantages are [5-7] its superior speed and simplicity, with little sacrifice in accuracy and precision and its low cost. Titrimetry does not require expensive equipment and measurements are quickly carried out and easily automated. Together with gravimetry, titrimetry is one of the two primary methods used to determine chemical composition on the basis of chemical reactions [8-9]. Both gravimetry and titrimetry (classical analysis) lead directly to independent values of chemical quantities expressed in S.I. units. The wide-ranging applications combined with the simplicity of the method make titrimetry an attractive method of measurement and it continues to be extensively employed in a wide range of laboratories. The aim of this contribution is to carry out the study of weak acid/weak bases titration curves including error titration. A method, which allows to drawn redox titration curves [5] without piecemeal approximations, based on the use of a hyperbolic sine expression is applied here to weak acid/weak base titrations. While the approach in its simplified form is limited by the water ionization, herein we derive a complete expression applicable in all situations when dealing with weak and medium strength acids titrated with weak and medium strength bases. The reaction between acetic acid and ammonia is studied in detail, being in addition applied to the determination of acetic acid (acidity degree) in vinegar. The complete method developed here and the equivalent “de Levie” method [10-12] are used as “control methods” in order to check calculations on Excel spreadsheets. Titration error may be expressed as a function of the difference between the end and equivalence (pHeq) points [13-14] and a diagram for the titration error is drawn. In spite that acid-base titration curves have received a great attention and numerous papers on this topic may be found in the analytical literature, papers concerning with weak and medium strength acids titrated with weak and medium strength bases are usually scarce.
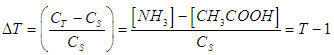
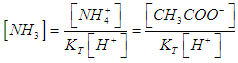
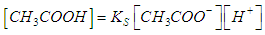
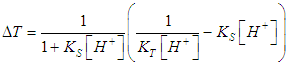
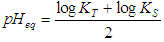
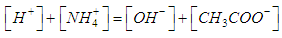
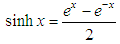
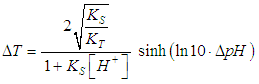
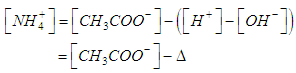
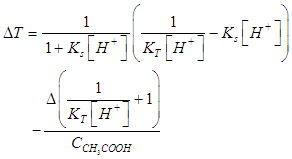
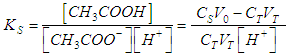
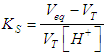
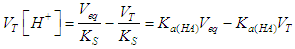
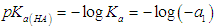
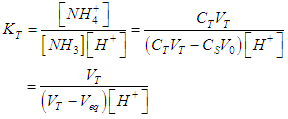
2. Theory: Basic Equations
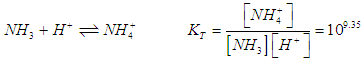
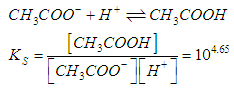
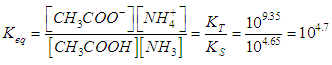
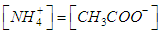
- For the acid/base conjugate pair ammonia / ammonium ion, we have
 | (1) |
 | (2) |
 | (3) |
 | (4) |
 | (5) |
 | (6) |
 | (7) |
 | (8) |
 | (9) |
 | (10) |
 | (11) |
 | (12) |
 | (13) |
 | (14) |
 | (15) |
 | (16) |
 | (17) |
 | (18) |
 | (19) |
 | (20) |
 | (21) |
 | (22) |
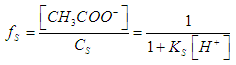
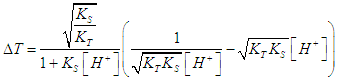
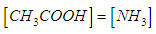
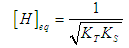
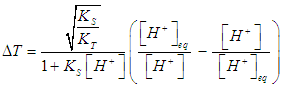
3. Weak Acids/Weak Bases Titration Curves
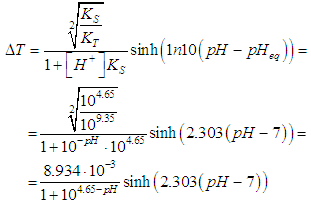
- Equation (19) is first used to drawn the titration curves of acetic acid (pKa= log KS= 4.65) with ammonia (pKa=log KT= 9.35) as titrant, by applying
 | (23) |
 | Figure 1. Theoretical titration curves drawn with the function described by Eq. (19) |
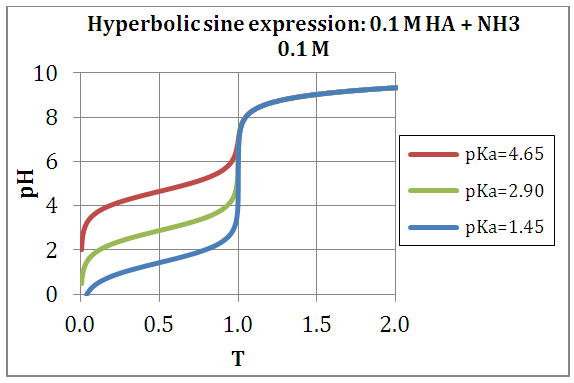
 | Figure 2. Titration of 0.1 M acids of pKa = 4.65, 2.90 and 1.45 with a 0.1 M base of pKa = 9.35 (i.e. ammonia) |
 | Figure 3. Titration of 0.1, 0.01, and 0.001 M acids of pKa = 4.65, 2.90 and 1.45 with a 0.1, 0.01 and 0.001 M base of pKa = 9.35 (i.e. ammonia) |
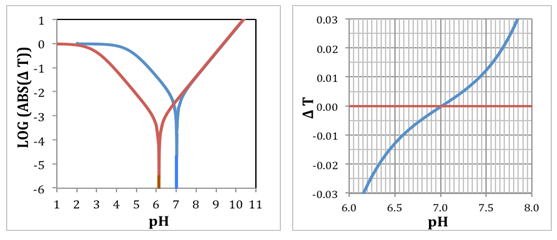 | Figure 4. Left: Logarithmic plot of the titration error for acids with pKa = 4.65 (blue line) and 2.90 (red line). Right: Titration error diagram ΔT = f (pH) (in the environment of ± 3%); pKa = 4.65 |
4. Experimental Part. Determination of the Degree of Acidity of Commercial (Wine) Vinegar
- Article 3.1 of Spanish Royal Decree 661/2012 of April 13 (BOE No. 100 of April 23, 2012) defines vinegar [16] as "the liquid suitable for human consumption resulting from the double alcoholic and acetic fermentation of products of agricultural origin”. Wine vinegar is the product obtained exclusively by acetic fermentation of wine (article 3.3, RD 661/2012) [16-19]. Vinegar is a product obtained by the oxidation of ethanol contained in alcoholic beverages of low graduation thanks to the action of microorganisms (acetic bacteria). It contains different organic acids, mainly acetic acid, and other components such as sulphates, chlorides, sulphur dioxide, etc. Total acidity or acetic grade is a quality index, and is defined as all the volatile and fixed acids contained in vinegar expressed in grams of acetic acid in 100 ml of vinegar (acidity degree), i.e. % w / V. It can be determined by titration with a solution of a base of known concentration. Spanish legislation provides that commercial vinegars must contain at least 60 grams of acetic acid per litter (6% w/V) for wine vinegars. That is, commercial wine vinegars must have an approximate concentration of 1 M acetic acid. For other kind of vinegars, the minimum concentration required is 50 g/L acetic acid.Apparatus and Reagents - pH-meter Crison GLP 21, with a combined Ag / AgCl glass electrode. The pH meter is calibrated (tthree-point method) using the pH 4.01, 7.00 and 9.21 buffers. Calibration is repeated at the beginning of each series of titrations. Five mL burettes (Brand) (± 0.01 at 20°C) and 50 mL burettes (Brand) (± 0.1 at 20°C). Adjustable volume micropipettes 100-1000 μL, and1000-5000 μL (Hamilton).Acetic acid (C2H4O2) M = 60 g/mol (Merck> 99.5%, 1.049 g/mL); Ammonia in 30% solution M = 17.03 g/mol (Panreac, p.a.); Sherry vinegar (7.5%); Potassium hydrogen phthalate (C8H5KO4) M = 204.22 g/mol (Merck, analytical grade); Water for ACS analysis (Panreac).Solutions- 0.100 M acetic acid: 1.573 mL of commercial acetic acid is taken and the solution is transferred to a 250 mL volumetric flask and diluted with distilled water to the mark.- 0.100 M Ammonia: 1.582 mL of commercial ammonia solution is taken and transferred to a 250 mL volumetric flask and diluted with distilled water to the mark. Experimental procedure: Titration of acetic acid20.0 mL of the 0.100 M acetic acid solution is pipetted. The contents of this solution are transferred to a 200 mL beaker, and the solution is titrated with a freshly prepared ammonia solution of 0.095 M ammonia (previously standardized with potassium hydrogen phthalate) with a burette of 50.0 mL. The pH readings are performed with the pH-meter Crison GLP 21 (Figure 5). Two titrations were made. The results obtained in the first one are drawn in Figure 6.
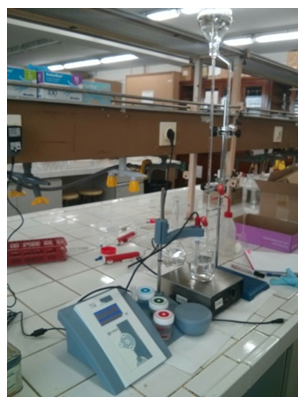 | Figure 5. Device used in potentiometric titration |
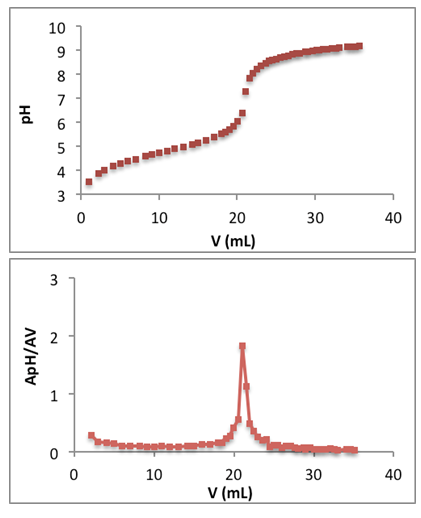 | Figure 6. Top: titration curve of 20.0 mL of 0.100 M acetic acid with ammonia. Bottom: first derivative |
5. Determination of the End Point: Method of the First Derivative
- Calculate the quotient of the pH increments between the volume increments and plot against the semi-sum of the pH values
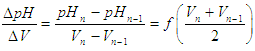 | (24) |
6. Determination of the End Point: Gran Linearization Method [20]
- When the acetic acid is titrated with the ammonia according to Eq. (3), prior to the equivalence point, from Eq. (2) we get
 | (25) |
 | (26) |
 | (27) |
 | (28) |
 | (29) |
 | (30) |
 | (31) |
 | (32) |
 | (33) |
7. Results and Discussion
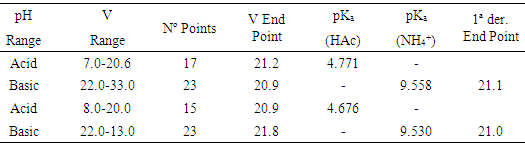
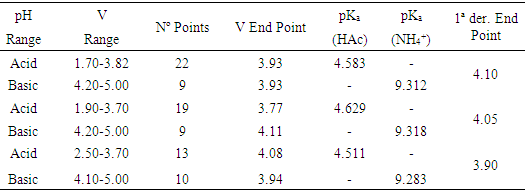
- The results of the Gran (and first derivative) method are shown in Table 1. To the end point volume data obtained the Q test of Dixon and G test of Grubbs are applied [21-23], dropping the 21.8 value, since Qexp = 0.667> Qtab (0. 95,6) and Gexp = 1.916> Gtab (0.95,6) = 1.887. An end point volume of 21.0 ± 0.1 mL is obtained, which corresponds to 0.0952 ± 0.0006 M in ammonia. Results obtained by the Gran and first derivative methods in the titration of vinegar with ammonia are shown in Table 2 and Figure 7. The Dixon and Grubbs tests do not rule out any data, resulting in an end point of 3.98 ± 0.11 mL and a % w/v of acetic acid of 7.57 ± 0.22. The pKa values of CH3COOH and NH4+ at I = 0.1 are equal to 4.629 (4.760) and 9.318 (9.250), respectively. Note the proximity of pKa values obtained in this contribution to these pKa values (except for acetic with ammonia in the basic range). Approximate single point method pH1/2 gives 4.684 for acetic acid pKa.
|
|
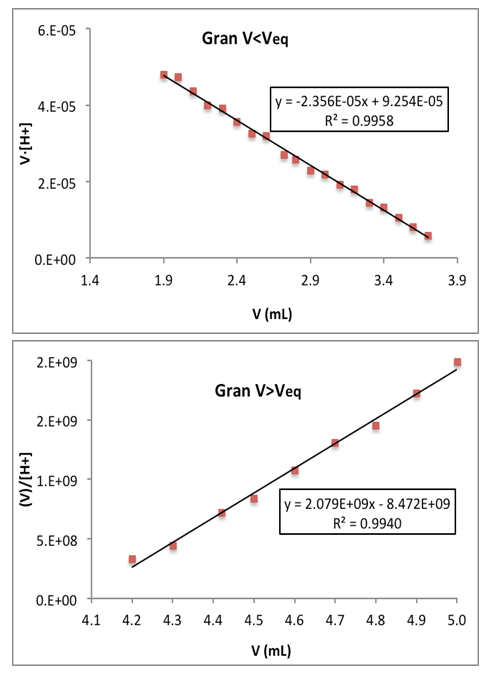 | Figure 7. Gran method applied to the evaluation of a sherry vinegar with ammonia: sample # 2. Upper part: range of acid pH values, Eq. (28). Bottom: range of basic pH values, Eq. (32) |
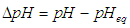
8. Final Comments
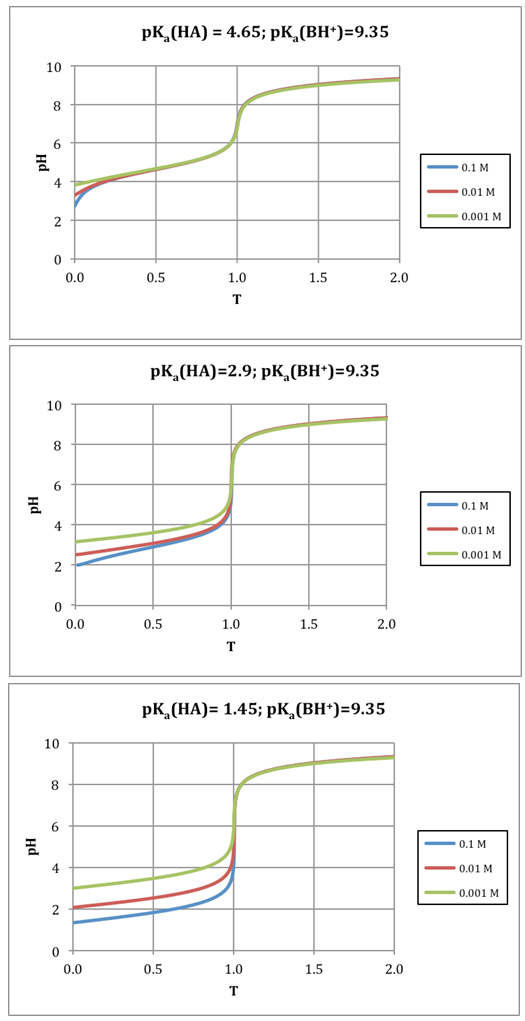
- A method for the calculation of titration curves and titration error in weak acids/weak bases titrations reactions has been devised. The hyperbolic sine expression formulated is compact and allows calculating the entire titration curve without piecemeal approximations. A diagram for the titration error in function of the difference between the end and equivalence point (ΔpH) is drawn in order to facilitate the graphical calculation of titration error. All calculations involved have been checked, for the sake of comparison, with a rigorous method proposed [10-12] by “de Levie”, and no differences were found in the numerical values obtained by both methods. The titration curves in the case of weak acid-weak base systems proves to be very useful because their shapes are independent-concentration, thus allowing to carry out the determinations without necessity of previous dilution.The acetic acid/ ammonia system has been studied in detail, and an application to the determination of acetic acid in vinegar is described. Gran method is easy to automatize and it constitutes a way of pKa determination of the acid-base systems involved (ionic strength should be maintained constant through titration) without even a prior knowledge of the concentrations. Ammonia solution may possess volatility problems and it could therefore be replace by a less volatile diethylamine, which has a pKa value of 8.95 [24].
ACKNOWLEDGEMENTS
- Thanks are due to the University of Seville for the concession of a Grant destined to the publication of the Bachelor´s degree Final Projects of students.